


生信分析中,经常要建立分险模型,对每个患者进行分险评分,根据这些评分对患者进行分组,不同分组的预后差异很大。
### 1. 构造数据
risk_df<- data.frame(samples=paste0("S",1:100),
                     score=runif(100,1,10),
                     surv_time =rnorm(100,10,2),
                     surv_status = sample(c("alive","dead"),100,replace = TRUE)
)
library(dplyr)
risk_df <- mutate(risk_df,
                  group= ifelse(score>5,"high_risk","low_risk"))
head(risk_df)

### 2.风险评分绘图
library(ggplot2)
## 样品按score值排序
risk_df <- risk_df[order(risk_df$score),]
p1 <- ggplot(data = risk_df) +
      geom_point(aes(x=seq(1:100), y=score, color=group)) +
      scale_color_manual(values = c("red","grey")) + # 自定义颜色映射
      ggtitle("Risk Score") +
      theme(plot.title = element_text(hjust = 0.5)) + # title居中
      xlab("") +
      ylab("Risk Score") +
      geom_vline(aes(xintercept=45),colour = "#BB0000",linetype = "dashed")

### 3.生存状态散点图
p2 <- ggplot(data = risk_df) +
      geom_point(aes(x=seq(1:100), y=surv_time, color=surv_status)) +
      ggtitle("Survival status") +
      theme(plot.title = element_text(hjust = 0.5)) + # title居中
      xlab("patients") +
      ylab("Survival time (years)")

### 4.组成图
library(cowplot)
plot_grid(p2,p1,ncol = 1, align = "h",labels = c("A","B"))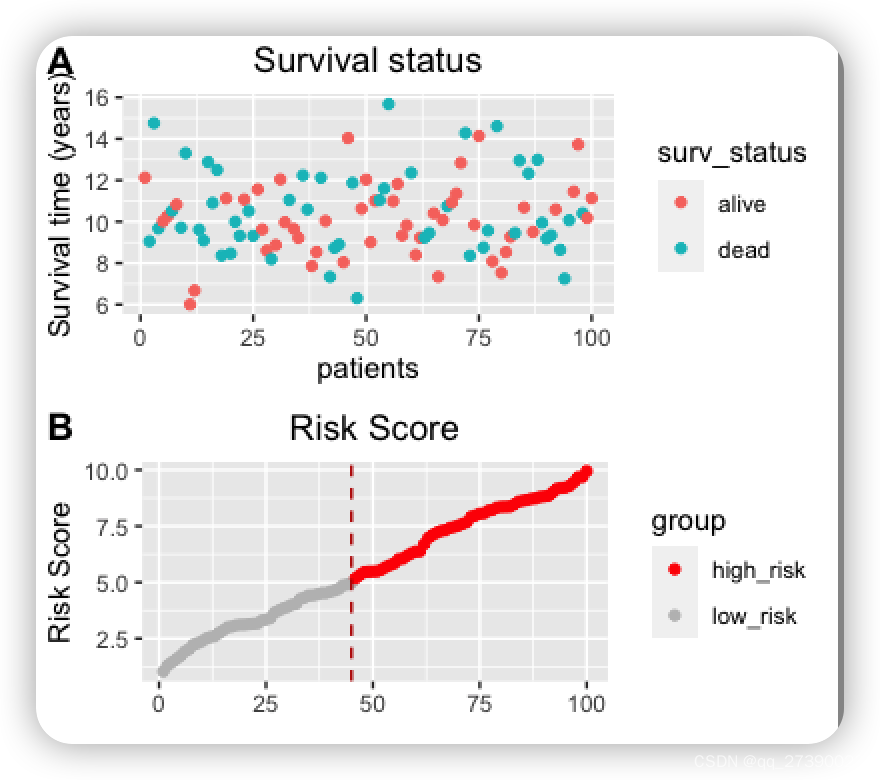


 1074
1074


 被折叠的 条评论
为什么被折叠?
被折叠的 条评论
为什么被折叠?
 到【灌水乐园】发言


