


目录
简介
SENTINEL-2 / TOA数据的NDVI、NDSI、NDWI、NDMI、NDGI的直方图和最大、小值统计以及下载
数据
SENTINEL-2是欧空局(ESA)发射的一系列卫星,旨在提供全球范围内高分辨率的地球观测数据。其中,SR(Surface Reflectance)数据是SENTINEL-2卫星所获取的一种数据产品,其具体介绍如下:
-
数据特点:SR数据是通过对原始观测数据进行校正和辐射定标得到的,具有高质量和高灵敏度。它能够提供多光谱波段的观测,包括可见光、近红外和短波红外等波段。
-
空间分辨率:SENTINEL-2的传感器具有10米、20米和60米三个不同的空间分辨率。其中,10米分辨率的波段主要用于陆地表面的观测,20米分辨率的波段主要用于水体和植被的观测,60米分辨率的波段主要用于大尺度的气象和环境监测。
-
波段范围:SENTINEL-2的SR数据提供了13个波段的观测,覆盖了可见光、近红外和短波红外等波段。这些波段可以用于陆地、水体和大气的观测研究。
-
应用领域:SR数据可以广泛应用于农业、林业、环境监测、气象预测等领域。它可以用于土地利用、植被监测、水资源管理、灾害评估等方面的研究和决策支持。
总之,SENTINEL-2的SR数据具有高质量、多波段和多空间分辨率的特点,适用于各种地球观测研究和应用领域。它为科学家、决策者和环境监测机构提供了重要的信息源,促进了对地球环境变化的理解和管理。
指数
以下是对NDVI、NDSI、NDWI、NDMI和NDGI指数的具体介绍:
1. NDVI(Normalized Difference Vegetation Index):NDVI是通过反映植被的绿色度和活力程度来评估植被状况的指数。它由近红外波段和红光波段的反射率之差除以两者之和得到。NDVI的取值范围为-1到1之间,数值越高表示植被越茂盛。NDVI广泛应用于农业、林业和生态研究等领域。
2. NDSI(Normalized Difference Snow Index):NDSI是用于评估地表积雪覆盖程度的指数。它由可见光的绿光波段和近红外波段的反射率之差除以两者之和得到。NDSI的取值范围在-1到1之间,越高的数值表示地表上的积雪覆盖越多。NDSI常用于雪灾监测、水资源管理和气候研究等方面。
3. NDWI(Normalized Difference Water Index):NDWI是用于评估水体分布和含量的指数。它结合了近红外波段和绿光波段的反射率,通过反映水体与其他地物的反射率之差来区分水体。NDWI的取值范围在-1到1之间,越高的数值表示地表上的水体含量越高。NDWI在水资源管理、洪水监测和湖泊蓝藻监测等方面具有重要应用价值。
4. NDMI(Normalized Difference Moisture Index):NDMI是用于评估土壤湿度和植被水分状况的指数。它由近红外波段和短波红外波段的反射率之差除以两者之和得到。NMDI的取值范围在-1到1之间,越高的数值表示土壤湿度和植被水分含量越高。NMDI广泛应用于农业管理、干旱监测和森林健康评估等方面。
5. NDGI(Normalized Difference Greenness Index):NDGI是用于评估地表绿度的指数。它由近红外波段和绿光波段的反射率之差除以两者之和得到。NDGI的取值范围在-1到1之间,越高的数值表示地表绿度越丰富。NDGI常用于植被监测、土地利用变化分析和环境监测等方面。
以上指数在遥感图像分析中被广泛使用,可以提供有关植被、水体、雪量、土壤湿度和绿度等方面的信息,为决策者和研究人员提供重要的数据支持。
代码
// --------------------------------------------------------------------------------------------------------------------------
// 图像大小: "image" = 卫星图像大小; “矩形”=较小的部分
// 云量:返回图像的云量;导出期间遮罩矩形的云像素
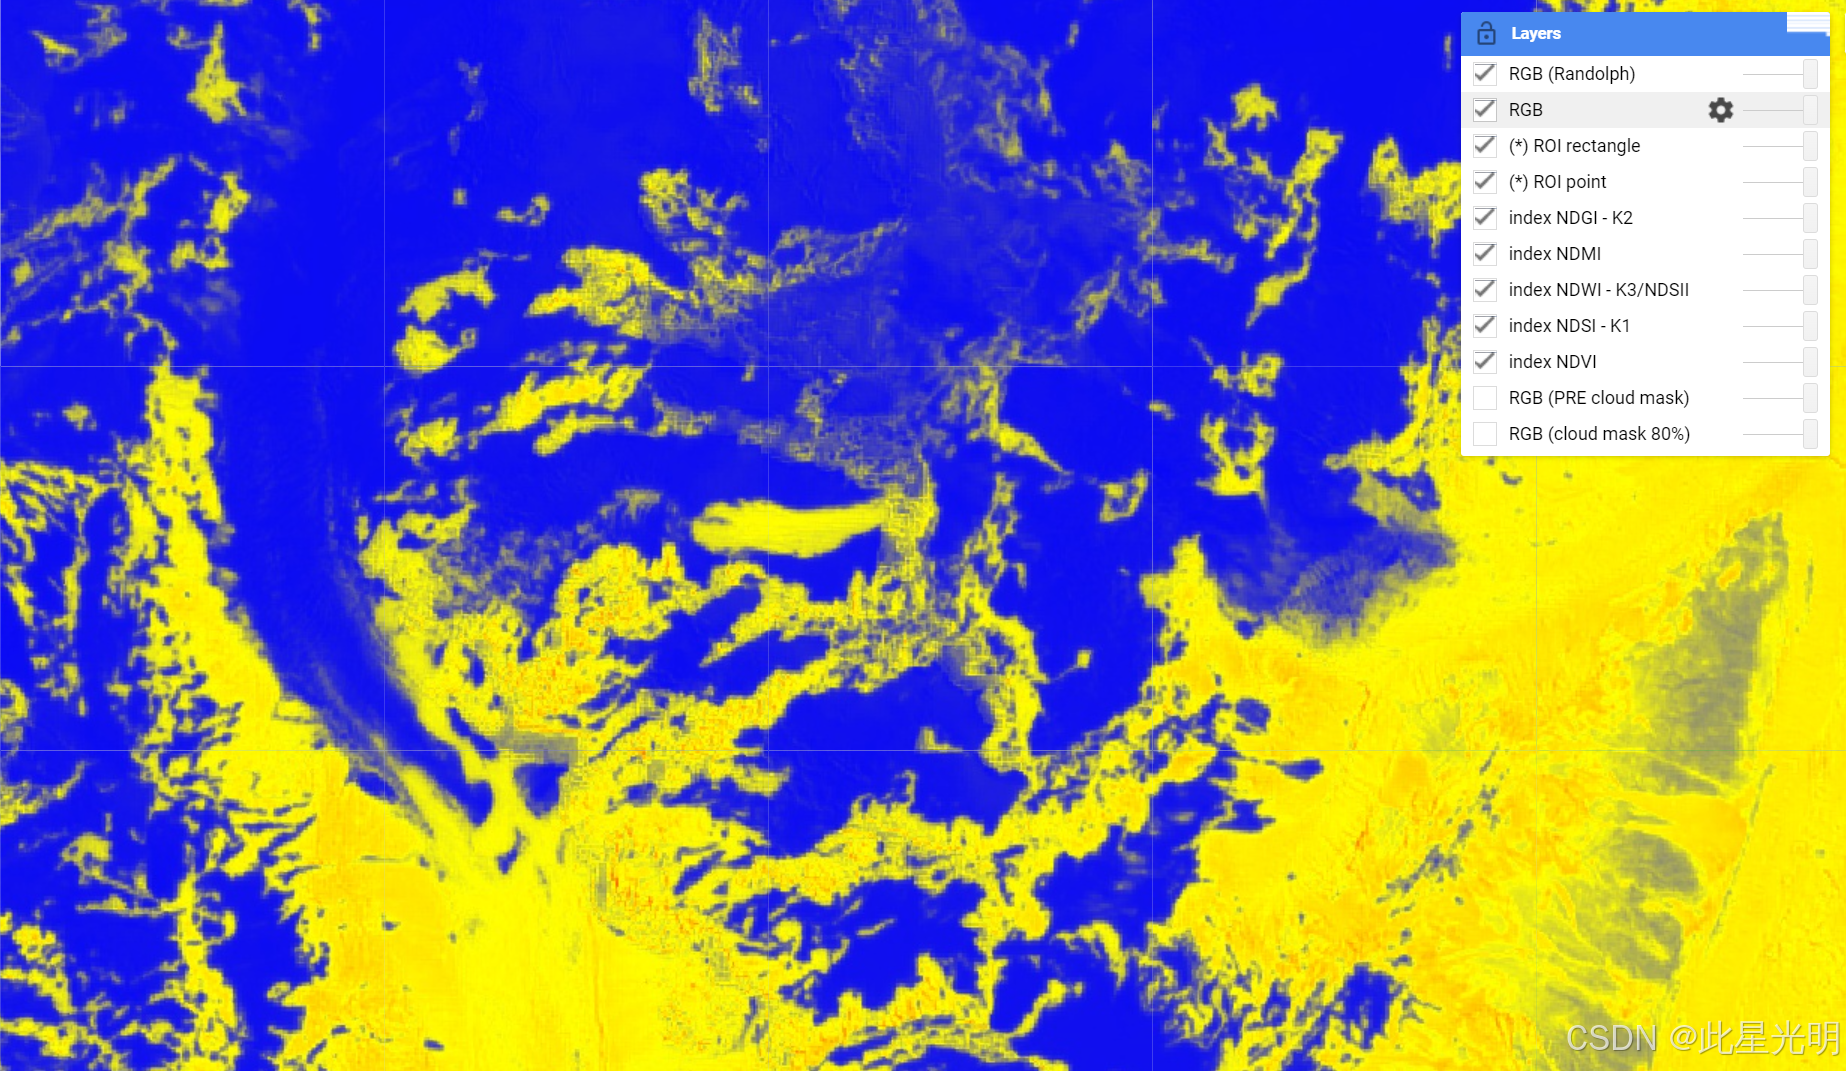
// RGB:使用 Randolph Glacier Inventory (v.6) 的一个未裁剪矩形和一个裁剪矩形
// 索引:NDVI、NDSI、NDWI、NDMI、NDGI
// 假色:显示 NIR-R-G 和 SWIR2-NIR-R
// 导出 (TIFF):RGB(未剪辑)、RGB(使用 RGI 剪辑)、5 个索引、2 个假颜色(全部为矩形大小)
// --------------------------------------------------------------------------------------------------------------------------
// customized functions
var mymin = function(a, b) // finding min out of two values
{
var aa=ee.Number(a); var bb=ee.Number(b);
if (aa.lt(bb)==1) {
return a;
} else {
return b;
}
};
var mymax = function(a, b) // finding max out of two values
{
var aa=ee.Number(a); var bb=ee.Number(b);
if (aa.gt(bb)==1) {
return a;
} else {
return b;
}
};
// customized functions (but not ours)
function maskClouds(img)
{
var clouds = ee.Image(img.get('cloud_mask')).select('probability');
var isNotCloud = clouds.lte(CLOUD_THRESHOLD);
return img.updateMask(isNotCloud);
}
// The masks for the 10m bands sometimes do not exclude bad data at scene edges, so we apply masks from the 20m and 60m bands as well.
// Example asset that needs this operation: COPERNICUS/S2_CLOUD_PROBABILITY/20190301T000239_20190301T000238_T55GDP.
function maskEdges(s2_img)
{
return s2_img.updateMask(
s2_img.select('B8A').mask().updateMask(s2_img.select('B9').mask()));
}
// --------------------------------------------------------------------------------------------------------------------------
// load image via its ID
var image_ID = 'COPERNICUS/S2_HARMONIZED/20181223T223659_20181223T223658_T59GMM'; // SET !!! (testing Hooker 5)
var STR_EXP = 'Hooker5_S2_TOA_20181223'; // SET !!! (later used for export)
var image = ee.Image(image_ID);
// give location for point and rectangle around (0.2° x 0.1°)
var Px = 170.137251; // LON // SET !!!
var Py = -43.619609; // LAT // SET !!!
var RxMin = Px - 0.1;
var RyMin = Py - 0.05;
var RxMax = Px + 0.1;
var RyMax = Py + 0.05;
var point = ee.Geometry.Point([Px, Py]);
var rectangle = ee.Geometry.Rectangle([RxMin, RyMin, RxMax, RyMax]);
print('image area (m²)', image.geometry().area());
print('rectangle area (m²)', rectangle.area());
// cloud cover (of image) (made via CLOUDY_PIXEL_PERCENTAGE)
var clouds = image.get('CLOUDY_PIXEL_PERCENTAGE');
print('could % (CLOUDY_PIXEL_PERCENTAGE):', clouds);
// cloud mask (made via COPERNICUS/S2_CLOUD_PROBABILITY)
// load cloud probability collection
var s2Clouds = ee.ImageCollection('COPERNICUS/S2_CLOUD_PROBABILITY');
var CLOUD_THRESHOLD = 80;
// join S2 with cloud probability dataset to add cloud mask
var s2SrWithCloudMask = ee.Join.saveFirst('cloud_mask').apply({
primary: ee.ImageCollection(image),
secondary: s2Clouds,
condition: ee.Filter.equals({leftField: 'system:index', rightField: 'system:index'})
});
var masked = ee.ImageCollection(s2SrWithCloudMask).map(maskClouds);
//var image = masked; // OVERWRITE (original sattelite) IMAGE TO CONTINUE THE ENTIRE CODE WITHOUT CLOUDS
var maskParams= {bands: ['B4', 'B3', 'B2'], gamma: 2, gain: 0.025}
Map.addLayer(masked, maskParams, 'RGB (cloud mask ' + CLOUD_THRESHOLD + '%)', false);
Map.addLayer(image, maskParams, 'RGB (PRE cloud mask)', false);
// bands
var AERO = image.select('B1'); // 60m // attention: variables only used for indexes
var BLUE = image.select('B2'); // 10m // var in use // (bands set for RGB and false-color manually)
var GREEN = image.select('B3'); // 10m // var in use
var RED = image.select('B4'); // 10m // var in use
var RE1 = image.select('B5'); // 20m // var in use
var RE2 = image.select('B6'); // 20m
var RE3 = image.select('B7'); // 20m
var NIR = image.select('B8'); // 10m // var in use
var nNIR = image.select('B8A');// 20m // var in use
var VAP = image.select('B9'); // 60m
var CIRR = image.select('B10');// 60m
var SWIR1 = image.select('B11');// 20m // var in use
var SWIR2 = image.select('B12');// 20m // var in use
var STR_GREEN = 'B3'; // string variable used in index function
var STR_RED = 'B4'; // string variable used in index function
var STR_NIR = 'B8'; // string variable used in index function
var STR_SWIR1 = 'B11'; // string variable used in index function
// verify date and ID (as given in image identifier here above)
print('image date', image.date());
print('image ID', image.id());
// get projection info of image (e.g. B2; projections are different for bands with transform relating to resolution in m)
var projection = image.select('B2').projection().getInfo(); // use a band with best resolution (of those bands that are in use!)
print('projection', projection);
// make layers (image size; shown in GEE)
// RGB
var imageRGB = image.select(['B4', 'B3', 'B2']);
// RGB (clipped with RGI)
var imageRGI = imageRGB.clip(ee.FeatureCollection("users/willsmith140/rgi60_all"));
// 5 indexes
var NDVI = image.normalizedDifference([STR_NIR, STR_RED]);
var NDSI = image.normalizedDifference([STR_GREEN, STR_SWIR1]);
var NDWI = image.normalizedDifference([STR_GREEN, STR_NIR]);
var NDMI = image.normalizedDifference([STR_NIR, STR_SWIR1]);
var NDGI = image.normalizedDifference([STR_GREEN, STR_RED]);
// 2 false-colors
var imageF1 = image.select(['B8', 'B4', 'B3']); // (NIR-RED-GREEN)
var imageF2 = image.select(['B12', 'B8A', 'B5']); // (SWIR2-nNIR-RE1)
// make layers (rectangle size; not shown in GEE)
// RGB
var imageRGBrec = imageRGB.clip(rectangle);
var REDrec = RED.clip(rectangle); // used in histograms
var GREENrec = GREEN.clip(rectangle); // used in histograms
var BLUErec = BLUE.clip(rectangle); // used in histograms
// RGB (clipped with RGI)
var imageRGIrec = imageRGI.clip(rectangle);
// 5 indexes
var NDVIrec = NDVI.clip(rectangle);
var NDSIrec = NDSI.clip(rectangle);
var NDWIrec = NDWI.clip(rectangle);
var NDMIrec = NDMI.clip(rectangle);
var NDGIrec = NDGI.clip(rectangle);
// 2 false-colors
var imageF1rec = imageF1.clip(rectangle);
var imageF2rec = imageF2.clip(rectangle);
var RE1rec = RE1.clip(rectangle); // used in histograms
var NIRrec = NIR.clip(rectangle); // used in histograms
var nNIRrec = nNIR.clip(rectangle); // used in histograms
var SWIR2rec = SWIR2.clip(rectangle); // used in histograms
// make multi-band layers (rectangle size; not shown in GEE) to export all bands with same resolution in one file
var packRES10 = image.select(['B2', 'B3', 'B4', 'B8']);
var packRES20 = image.select(['B5', 'B6', 'B7', 'B8A', 'B11', 'B12']);
var packRES60 = image.select('B1');
var packRES10rec = packRES10.clip(rectangle);
var packRES20rec = packRES20.clip(rectangle);
var packRES60rec = packRES60.clip(rectangle);
var projection10 = image.select('B2').projection().getInfo(); print('projection10', projection10);
var projection20 = image.select('B5').projection().getInfo(); print('projection20', projection20);
var projection60 = image.select('B1').projection().getInfo(); print('projection60', projection60);
// make histograms for image size (burgundy color; scale: native scale = resolution; maxPixels: bigger than number of pixels in the image)
// RGB (in 3 separate histograms for smallest min and greatest max)
var chart_RED = ui.Chart.image.histogram({image: RED, scale: 10, maxPixels: 1e10})
.setSeriesNames(['RED'])
.setOptions({
title: 'RED - full satellite image size',
hAxis: {
title: 'RED Value',
titleTextStyle: {italic: false, bold: true},
},
vAxis:
{title: 'Count', titleTextStyle: {italic: false, bold: true}},
colors: ['cf513e']
});
print(chart_RED);
var chart_GREEN = ui.Chart.image.histogram({image: GREEN, scale: 10, maxPixels: 1e10})
.setSeriesNames(['GREEN'])
.setOptions({
title: 'GREEN - full satellite image size',
hAxis: {
title: 'GREEN Value',
titleTextStyle: {italic: false, bold: true},
},
vAxis:
{title: 'Count', titleTextStyle: {italic: false, bold: true}},
colors: ['cf513e']
});
print(chart_GREEN);
var chart_BLUE = ui.Chart.image.histogram({image: BLUE, scale: 10, maxPixels: 1e10})
.setSeriesNames(['BLUE'])
.setOptions({
title: 'BLUE - full satellite image size',
hAxis: {
title: 'BLUE Value',
titleTextStyle: {italic: false, bold: true},
},
vAxis:
{title: 'Count', titleTextStyle: {italic: false, bold: true}},
colors: ['cf513e']
});
print(chart_BLUE);
// 5 indexes
var chart_NDVI = ui.Chart.image.histogram({image: NDVI, scale: 10, maxPixels: 1e10})
.setSeriesNames(['NDVI'])
.setOptions({
title: 'NDVI - full satellite image size',
hAxis: {
title: 'NDVI Value',
titleTextStyle: {italic: false, bold: true},
},
vAxis:
{title: 'Count', titleTextStyle: {italic: false, bold: true}},
colors: ['cf513e']
});
print(chart_NDVI);
var chart_NDSI = ui.Chart.image.histogram({image: NDSI, scale: 10, maxPixels: 1e10}) // scale 10 because of resampling
.setSeriesNames(['NDSI'])
.setOptions({
title: 'NDSI - full satellite image size',
hAxis: {
title: 'NDSI Value',
titleTextStyle: {italic: false, bold: true},
},
vAxis:
{title: 'Count', titleTextStyle: {italic: false, bold: true}},
colors: ['cf513e']
});
print(chart_NDSI);
var chart_NDWI = ui.Chart.image.histogram({image: NDWI, scale: 10, maxPixels: 1e10})
.setSeriesNames(['NDWI'])
.setOptions({
title: 'NDWI - full satellite image size',
hAxis: {
title: 'NDWI Value',
titleTextStyle: {italic: false, bold: true},
},
vAxis:
{title: 'Count', titleTextStyle: {italic: false, bold: true}},
colors: ['cf513e']
});
print(chart_NDWI);
var chart_NDMI = ui.Chart.image.histogram({image: NDMI, scale: 10, maxPixels: 1e10}) // scale 10 because of resampling
.setSeriesNames(['NDMI'])
.setOptions({
title: 'NDMI - full satellite image size',
hAxis: {
title: 'NDMI Value',
titleTextStyle: {italic: false, bold: true},
},
vAxis:
{title: 'Count', titleTextStyle: {italic: false, bold: true}},
colors: ['cf513e']
});
print(chart_NDMI);
var chart_NDGI = ui.Chart.image.histogram({image: NDGI, scale: 10, maxPixels: 1e10})
.setSeriesNames(['NDGI'])
.setOptions({
title: 'NDGI - full satellite image size',
hAxis: {
title: 'NDGI Value',
titleTextStyle: {italic: false, bold: true},
},
vAxis:
{title: 'Count', titleTextStyle: {italic: false, bold: true}},
colors: ['cf513e']
});
print(chart_NDGI);
// RE1, NIR, nNIR and SWIR2 (for false-colors)
var chart_RE1 = ui.Chart.image.histogram({image: RE1, scale: 20, maxPixels: 1e10}) // scale 20 because RE1 has 20m
.setSeriesNames(['RE1'])
.setOptions({
title: 'RE1 - full satellite image size',
hAxis: {
title: 'RE1 Value',
titleTextStyle: {italic: false, bold: true},
},
vAxis:
{title: 'Count', titleTextStyle: {italic: false, bold: true}},
colors: ['cf513e']
});
print(chart_RE1);
var chart_NIR = ui.Chart.image.histogram({image: NIR, scale: 10, maxPixels: 1e10})
.setSeriesNames(['NIR'])
.setOptions({
title: 'NIR - full satellite image size',
hAxis: {
title: 'NIR Value',
titleTextStyle: {italic: false, bold: true},
},
vAxis:
{title: 'Count', titleTextStyle: {italic: false, bold: true}},
colors: ['cf513e']
});
print(chart_NIR);
var chart_nNIR = ui.Chart.image.histogram({image: nNIR, scale: 20, maxPixels: 1e10}) // scale 20 because nNIR has 20m
.setSeriesNames(['nNIR'])
.setOptions({
title: 'nNIR - full satellite image size',
hAxis: {
title: 'nNIR Value',
titleTextStyle: {italic: false, bold: true},
},
vAxis:
{title: 'Count', titleTextStyle: {italic: false, bold: true}},
colors: ['cf513e']
});
print(chart_nNIR);
var chart_SWIR2 = ui.Chart.image.histogram({image: SWIR2, scale: 20, maxPixels: 1e10}) // scale 20 because SWIR2 has 20m
.setSeriesNames(['SWIR2'])
.setOptions({
title: 'SWIR2 - full satellite image size',
hAxis: {
title: 'SWIR2 Value',
titleTextStyle: {italic: false, bold: true},
},
vAxis:
{title: 'Count', titleTextStyle: {italic: false, bold: true}},
colors: ['cf513e']
});
print(chart_SWIR2);
// make histograms for rectangle size (dark yellow color; scale: native scale = resolution; maxPixels: bigger than number of pixels in the rectangle)
// RGB (in 3 separate histograms for smallest min and greatest max)
var chart_REDrec = ui.Chart.image.histogram({image: REDrec, scale: 10, maxPixels: 1e10})
.setSeriesNames(['REDrec'])
.setOptions({
title: 'RED - rectangle size',
hAxis: {
title: 'REDrec Value',
titleTextStyle: {italic: false, bold: true},
},
vAxis:
{title: 'Count', titleTextStyle: {italic: false, bold: true}},
colors: ['f0af07']
});
print(chart_REDrec);
var chart_GREENrec = ui.Chart.image.histogram({image: GREENrec, scale: 10, maxPixels: 1e10})
.setSeriesNames(['GREENrec'])
.setOptions({
title: 'GREEN - rectangle size',
hAxis: {
title: 'GREENrec Value',
titleTextStyle: {italic: false, bold: true},
},
vAxis:
{title: 'Count', titleTextStyle: {italic: false, bold: true}},
colors: ['f0af07']
});
print(chart_GREENrec);
var chart_BLUErec = ui.Chart.image.histogram({image: BLUErec, scale: 10, maxPixels: 1e10})
.setSeriesNames(['BLUErec'])
.setOptions({
title: 'BLUE - rectangle size',
hAxis: {
title: 'BLUErec Value',
titleTextStyle: {italic: false, bold: true},
},
vAxis:
{title: 'Count', titleTextStyle: {italic: false, bold: true}},
colors: ['f0af07']
});
print(chart_BLUErec);
// 5 indexes
var chart_NDVIrec = ui.Chart.image.histogram({image: NDVIrec, scale: 10, maxPixels: 1e10})
.setSeriesNames(['NDVIrec'])
.setOptions({
title: 'NDVI - rectangle size',
hAxis: {
title: 'NDVIrec Value',
titleTextStyle: {italic: false, bold: true},
},
vAxis:
{title: 'Count', titleTextStyle: {italic: false, bold: true}},
colors: ['f0af07']
});
print(chart_NDVIrec);
var chart_NDSIrec = ui.Chart.image.histogram({image: NDSIrec, scale: 10, maxPixels: 1e10}) // scale 10 because of resampling
.setSeriesNames(['NDSIrec'])
.setOptions({
title: 'NDSI - rectangle size',
hAxis: {
title: 'NDSIrec Value',
titleTextStyle: {italic: false, bold: true},
},
vAxis:
{title: 'Count', titleTextStyle: {italic: false, bold: true}},
colors: ['f0af07']
});
print(chart_NDSIrec);
var chart_NDWIrec = ui.Chart.image.histogram({image: NDWIrec, scale: 10, maxPixels: 1e10})
.setSeriesNames(['NDWIrec'])
.setOptions({
title: 'NDWI - rectangle size',
hAxis: {
title: 'NDWIrec Value',
titleTextStyle: {italic: false, bold: true},
},
vAxis:
{title: 'Count', titleTextStyle: {italic: false, bold: true}},
colors: ['f0af07']
});
print(chart_NDWIrec);
var chart_NDMIrec = ui.Chart.image.histogram({image: NDMIrec, scale: 10, maxPixels: 1e10}) // scale 10 because of resampling
.setSeriesNames(['NDMIrec'])
.setOptions({
title: 'NDMI - rectangle size',
hAxis: {
title: 'NDMIrec Value',
titleTextStyle: {italic: false, bold: true},
},
vAxis:
{title: 'Count', titleTextStyle: {italic: false, bold: true}},
colors: ['f0af07']
});
print(chart_NDMIrec);
var chart_NDGIrec = ui.Chart.image.histogram({image: NDGIrec, scale: 10, maxPixels: 1e10})
.setSeriesNames(['NDGIrec'])
.setOptions({
title: 'NDGI - rectangle size',
hAxis: {
title: 'NDGIrec Value',
titleTextStyle: {italic: false, bold: true},
},
vAxis:
{title: 'Count', titleTextStyle: {italic: false, bold: true}},
colors: ['f0af07']
});
print(chart_NDGIrec);
// RE1, NIR, nNIR and SWIR2 (for false-colors)
var chart_RE1rec = ui.Chart.image.histogram({image: RE1rec, scale: 20, maxPixels: 1e10}) // scale 20 because RE1 has 20m
.setSeriesNames(['RE1rec'])
.setOptions({
title: 'RE1 - rectangle size',
hAxis: {
title: 'RE1rec Value',
titleTextStyle: {italic: false, bold: true},
},
vAxis:
{title: 'Count', titleTextStyle: {italic: false, bold: true}},
colors: ['f0af07']
});
print(chart_RE1rec);
var chart_NIRrec = ui.Chart.image.histogram({image: NIRrec, scale: 10, maxPixels: 1e10})
.setSeriesNames(['NIRrec'])
.setOptions({
title: 'NIR - rectangle size',
hAxis: {
title: 'NIRrec Value',
titleTextStyle: {italic: false, bold: true},
},
vAxis:
{title: 'Count', titleTextStyle: {italic: false, bold: true}},
colors: ['f0af07']
});
print(chart_NIRrec);
var chart_nNIRrec = ui.Chart.image.histogram({image: nNIRrec, scale: 20, maxPixels: 1e10}) // scale 20 because nNIR has 20m
.setSeriesNames(['nNIRrec'])
.setOptions({
title: 'nNIR - rectangle size',
hAxis: {
title: 'nNIRrec Value',
titleTextStyle: {italic: false, bold: true},
},
vAxis:
{title: 'Count', titleTextStyle: {italic: false, bold: true}},
colors: ['f0af07']
});
print(chart_nNIRrec);
var chart_SWIR2rec = ui.Chart.image.histogram({image: SWIR2rec, scale: 20, maxPixels: 1e10})// scale 20 because SWIR2 has 20m
.setSeriesNames(['SWIR2rec'])
.setOptions({
title: 'SWIR2 - rectangle size',
hAxis: {
title: 'SWIR2rec Value',
titleTextStyle: {italic: false, bold: true},
},
vAxis:
{title: 'Count', titleTextStyle: {italic: false, bold: true}},
colors: ['f0af07']
});
print(chart_SWIR2rec);
// show layers in GEE
// center around given location
Map.centerObject(point, 14);
// IF WE KNOW THE MIN-MAX, WE CAN INSERT THEM MANUALLY
// ---------------------------------------------------
// // show RGB and RGB (clipped with RGI)
// var RGBparams = {min: 0, max: 8000};
// Map.addLayer(imageRGB, RGBparams, 'RGB');
// Map.addLayer(imageRGI, RGBparams, 'RGB (Randolph)');
// // show 5 indexes
// var NDVIparams = {min: -0.15, max: 0.375, palette: ['red', 'yellow', 'green']};
// Map.addLayer(NDVI, NDVIparams, 'NDVI');
// var NDSIparams = {min: -0.125, max: 0.825, palette: ['yellow', 'green', 'blue']};
// Map.addLayer(NDSI, NDSIparams, 'NDSI - K1');
// var NDWIparams = {min: -0.35, max: 0.225, palette: ['green', 'white', 'blue']};
// Map.addLayer(NDWI, NDWIparams, 'NDWI - K3/NDSII');
// var NDMIparams = {min: 0.05, max: 0.8, palette: ['red', 'yellow', 'blue']};
// Map.addLayer(NDMI, NDMIparams, 'NDMI');
// var NDGIparams = {min: -0.025, max: 0.09, palette: ['blue', 'white', 'pink']};
// Map.addLayer(NDGI, NDGIparams, 'NDGI - K2');
// // show 2 false-colors
// var F1params = {min: 1000, max: 6000};
// Map.addLayer(imageF1, F1params, 'false-color NIR-R-G');
// var F2params = {min: 450, max: 6000};
// Map.addLayer(imageF2, F2params, 'false-color SWIR2-nNIR-RE1');
// IF WE WANT MIN-MAX TO BE TAKEN FROM THE DATA AUTOMATICALLY, WE HAVE TO EVALUATE THEM
// ------------------------------------------------------------------------------------
// show RGB and RGB (clipped with RGI) (maxPixels: bigger than number of pixels in the image)
var MMRED = RED.reduceRegion({
reducer: ee.Reducer.minMax(),
geometry: RED.geometry(),
bestEffort: true,
maxPixels: 1e10
});
var minmaxRED = MMRED.rename(MMRED.keys(), ['max','min']); print('min/max RED image', minmaxRED);
var MMGREEN = GREEN.reduceRegion({
reducer: ee.Reducer.minMax(),
geometry: GREEN.geometry(),
bestEffort: true,
maxPixels: 1e10
});
var minmaxGREEN = MMGREEN.rename(MMGREEN.keys(), ['max','min']); print('min/max GREEN image', minmaxGREEN);
var MMBLUE = BLUE.reduceRegion({
reducer: ee.Reducer.minMax(),
geometry: BLUE.geometry(),
bestEffort: true,
maxPixels: 1e10
});
var minmaxBLUE = MMBLUE.rename(MMBLUE.keys(), ['max','min']); print('min/max BLUE image', minmaxBLUE);
var minRGB = mymin(minmaxRED.get('min'), mymin(minmaxGREEN.get('min'), minmaxBLUE.get('min'))); print('min RGB image', minRGB);
var maxRGB = mymax(minmaxRED.get('max'), mymax(minmaxGREEN.get('max'), minmaxBLUE.get('max'))); print('max RGB image', maxRGB);
var minmaxRGB = ee.Dictionary({'max': maxRGB, 'min': minRGB});
minmaxRGB.evaluate(function(val){
var RGBparams = {
min: val.min,
max: val.max,
gamma: 2
};
Map.addLayer(imageRGB, RGBparams, 'RGB');
Map.addLayer(imageRGI, RGBparams, 'RGB (Randolph)');
});
// show 5 indexes
var MMNDVI = NDVI.reduceRegion({
reducer: ee.Reducer.minMax(),
geometry: NDVI.geometry(),
bestEffort: true,
maxPixels: 1e10
});
var minmaxNDVI = MMNDVI.rename(MMNDVI.keys(), ['max','min']); print('min/max NDVI image', minmaxNDVI);
var NDVIparams = {min: minmaxNDVI['min'], max: minmaxNDVI['max'], palette: ['red', 'yellow', 'green']};
Map.addLayer(NDVI, NDVIparams, 'index NDVI');
var MMNDSI = NDSI.reduceRegion({
reducer: ee.Reducer.minMax(),
geometry: NDSI.geometry(),
bestEffort: true,
maxPixels: 1e10
});
var minmaxNDSI = MMNDSI.rename(MMNDSI.keys(), ['max','min']); print('min/max NDSI image', minmaxNDSI);
var NDSIparams = {min: minmaxNDSI['min'], max: minmaxNDSI['max'], palette: ['yellow', 'green', 'blue']};
Map.addLayer(NDSI, NDSIparams, 'index NDSI - K1'); // Keshri Index 1
var MMNDWI = NDWI.reduceRegion({
reducer: ee.Reducer.minMax(),
geometry: NDWI.geometry(),
bestEffort: true,
maxPixels: 1e10
});
var minmaxNDWI = MMNDWI.rename(MMNDWI.keys(), ['max','min']); print('min/max NDWI image', minmaxNDWI);
var NDWIparams = {min: minmaxNDWI['min'], max: minmaxNDWI['max'], palette: ['green', 'white', 'blue']};
Map.addLayer(NDWI, NDWIparams, 'index NDWI - K3/NDSII'); // Keshri Index 3 (= NDSII)
var MMNDMI = NDMI.reduceRegion({
reducer: ee.Reducer.minMax(),
geometry: NDMI.geometry(),
bestEffort: true,
maxPixels: 1e10
});
var minmaxNDMI = MMNDMI.rename(MMNDMI.keys(), ['max','min']); print('min/max NDMI image', minmaxNDMI);
var NDMIparams = {min: minmaxNDMI['min'], max: minmaxNDMI['max'], palette: ['red', 'yellow', 'blue']};
Map.addLayer(NDMI, NDMIparams, 'index NDMI');
var MMNDGI = NDGI.reduceRegion({
reducer: ee.Reducer.minMax(),
geometry: NDGI.geometry(),
bestEffort: true,
maxPixels: 1e10
});
var minmaxNDGI = MMNDGI.rename(MMNDGI.keys(), ['max','min']); print('min/max NDGI image', minmaxNDGI);
var NDGIparams = {min: minmaxNDGI['min'], max: minmaxNDGI['max'], palette: ['blue', 'white', 'pink']};
Map.addLayer(NDGI, NDGIparams, 'index NDGI - K2'); // Keshri Index 2
// show 2 false-colors
var MMRE1 = RE1.reduceRegion({
reducer: ee.Reducer.minMax(),
geometry: RE1.geometry(),
bestEffort: true,
maxPixels: 1e10
});
var minmaxRE1 = MMRE1.rename(MMRE1.keys(), ['max','min']); print('min/max RE1 image', minmaxRE1);
var MMNIR = NIR.reduceRegion({
reducer: ee.Reducer.minMax(),
geometry: NIR.geometry(),
bestEffort: true,
maxPixels: 1e10
});
var minmaxNIR = MMNIR.rename(MMNIR.keys(), ['max','min']); print('min/max NIR image', minmaxNIR);
var MMnNIR = nNIR.reduceRegion({
reducer: ee.Reducer.minMax(),
geometry: nNIR.geometry(),
bestEffort: true,
maxPixels: 1e10
});
var minmaxnNIR = MMnNIR.rename(MMnNIR.keys(), ['max','min']); print('min/max nNIR image', minmaxnNIR);
var MMSWIR2 = SWIR2.reduceRegion({
reducer: ee.Reducer.minMax(),
geometry: SWIR2.geometry(),
bestEffort: true,
maxPixels: 1e10
});
var minmaxSWIR2 = MMSWIR2.rename(MMSWIR2.keys(), ['max','min']); print('min/max SWIR2 image', minmaxSWIR2);
var minF1 = mymin(minmaxNIR.get('min'), mymin(minmaxRED.get('min'), minmaxGREEN.get('min'))); print('min F1 image', minF1);
var maxF1 = mymax(minmaxNIR.get('max'), mymax(minmaxRED.get('max'), minmaxGREEN.get('max'))); print('max F1 image', maxF1);
var minmaxF1 = ee.Dictionary({'max': maxF1, 'min': minF1});
minmaxF1.evaluate(function(val){
var F1params = {
min: val.min,
max: val.max
};
Map.addLayer(imageF1, F1params, 'false-color (1) NIR-R-G');
});
var minF2 = mymin(minmaxSWIR2.get('min'), mymin(minmaxnNIR.get('min'), minmaxRE1.get('min'))); print('min F2 image', minF2);
var maxF2 = mymax(minmaxSWIR2.get('max'), mymax(minmaxnNIR.get('max'), minmaxRE1.get('max'))); print('max F2 image', maxF2);
var minmaxF2 = ee.Dictionary({'max': maxF2, 'min': minF2});
minmaxF2.evaluate(function(val){
var F2params = {
min: val.min,
max: val.max
};
Map.addLayer(imageF2, F2params, 'false-color (2) SWIR2-nNIR-RE1');
});
// show point
Map.addLayer(point, {'color': 'red'}, '(*) ROI point');
Map.addLayer({
'eeObject': ee.FeatureCollection(rectangle).style({
color: 'red',
fillColor: 'ff000000'
}),
'visParams': {},
'name': '(*) ROI rectangle',
'shown': true,
'opacity': 1.0
});
// exports (crs and transform of best resolution imposed on all exports; cf. get projection)
// RGB
Export.image.toDrive({
image: imageRGBrec,
folder: 'EarthEngine',
description: STR_EXP + '_RGB',
crs: projection.crs,
crsTransform: projection.transform,
region: rectangle // not necessary, already a rectangle!
});
// RGB (clipped with RGI)
Export.image.toDrive({
image: imageRGIrec,
folder: 'EarthEngine',
description: STR_EXP + '_Randolph',
crs: projection.crs,
crsTransform: projection.transform,
region: rectangle // not necessary, already a rectangle!
});
// 5 indexes
Export.image.toDrive({
image: NDVIrec,
folder: 'EarthEngine',
description: STR_EXP + '_NDVI',
crs: projection.crs,
crsTransform: projection.transform,
region: rectangle // not necessary, already a rectangle!
});
Export.image.toDrive({
image: NDSIrec,
folder: 'EarthEngine',
description: STR_EXP + '_NDSI',
crs: projection.crs,
crsTransform: projection.transform,
region: rectangle // not necessary, already a rectangle!
});
Export.image.toDrive({
image: NDWIrec,
folder: 'EarthEngine',
description: STR_EXP + '_NDWI',
crs: projection.crs,
crsTransform: projection.transform,
region: rectangle // not necessary, already a rectangle!
});
Export.image.toDrive({
image: NDMIrec,
folder: 'EarthEngine',
description: STR_EXP + '_NDMI',
crs: projection.crs,
crsTransform: projection.transform,
region: rectangle // not necessary, already a rectangle!
});
Export.image.toDrive({
image: NDGIrec,
folder: 'EarthEngine',
description: STR_EXP + '_NDGI',
crs: projection.crs,
crsTransform: projection.transform,
region: rectangle // not necessary, already a rectangle!
});
// 2 false-colors
Export.image.toDrive({
image: imageF1rec,
folder: 'EarthEngine',
description: STR_EXP + '_F1',
crs: projection.crs,
crsTransform: projection.transform,
region: rectangle // not necessary, already a rectangle!
});
Export.image.toDrive({
image: imageF2rec,
folder: 'EarthEngine',
description: STR_EXP + '_F2',
crs: projection.crs,
crsTransform: projection.transform,
region: rectangle // not necessary, already a rectangle!
});
// exports (crs and transform evaluated for each pack; cf. make multi-band layers)
Export.image.toDrive({
image: packRES10rec,
folder: 'EarthEngine',
description: STR_EXP + '_allRES10m',
crs: projection10.crs,
crsTransform: projection10.transform,
region: rectangle // not necessary, already a rectangle!
});
Export.image.toDrive({
image: packRES20rec,
folder: 'EarthEngine',
description: STR_EXP + '_allRES20m',
crs: projection20.crs,
crsTransform: projection20.transform,
region: rectangle // not necessary, already a rectangle!
});
Export.image.toDrive({
image: packRES60rec,
folder: 'EarthEngine',
description: STR_EXP + '_allRES60m',
crs: projection60.crs,
crsTransform: projection60.transform,
region: rectangle // not necessary, already a rectangle!
});
// end of code结果


 1243
1243

 被折叠的 条评论
为什么被折叠?
被折叠的 条评论
为什么被折叠?
 到【灌水乐园】发言


