


LBA-ECO CD-02 C and N Isotopes in Leaves and Atmospheric CO2, Amazonas, Brazil
简介
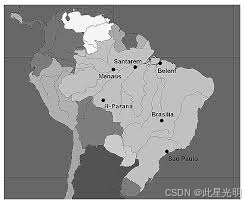
本数据集报告了巴西亚马逊州马瑙斯附近亚马逊国家科学研究所 (INPA) ZF2 保护区 (34 公里) 原始森林叶片组织和大气二氧化碳 (CO2) 的 13C/12C 变化结果、叶片组织的 15N/14N 比值以及沿地形梯度的叶片碳氮浓度。2004 年和 2006 年旱季,研究人员在冠层不同高度采集了叶片样本,并在该梯度沿线三个位置的不同高度采集了大气空气瓶样本。此外,数据集还包含来自高原 KM34 塔的同步气象、大气 CO2 和 CO2 通量测量数据。本数据集包含 3 个逗号分隔的数据文件。
摘要
Data are presented in three comma-delimited ASCII files:
File #1: CD02_Gas_Samples_13C_2004_2006.csv
File #2: CD02_Foliar_13C_15N_2004_2006.csv
File #3: CD02_Met_and_flux_data_2004_2006.csv
File #1: CD02_Gas_Samples_13C_2004_2006.csv
| Column | Heading | Units/format | Description |
|---|---|---|---|
| 1 | Year | YYYY | Year in which samples were collected: 2004 or 2006 |
| 2 | Month | Month in which samples were collected: August = 8 or October = 10 | |
| 3 | Day | Day of the month in which samples were collected | |
| 4 | Time | HH:MM | Start of sample collection in local time. Local time is GMT -4 |
| 5 | Flask | Flask identification number for laboratory purposes | |
| 6 | Position | Location within the landscape: Valley, Slope, Plateau, and Campinarana | |
| 7 | Sample_type | Samples were collected in flasks and are either Atmospheric gas samples or Soil respiration samples collected from a 40 L chamber placed on the soil surface | |
| 8 | Height | m | Height in meters above the ground at which the sample was collected for the atmospheric samples |
| 9 | conc_CO2 | ppm | Concentration of carbon dioxide in the flask samples in parts per million (ppm) |
| 10 | inv_conc_CO2 | ppm-1 | Inverse concentration of carbon dioxide in the sample calculated as 1/column 9 |
| 11 | delta_13C_R1 | parts per mil | Isotopic ratio of 13C/12C in carbon dioxide referenced to PDB, measured on a continuous flow isotope-ratio mass spectrometer (Finigan Delta Plus) at CENA |
| 12 | delta_13C_R2 | parts per mil | 13C/12C ratio measured in second aliquot from the same sample where available |
| 13 | delta_13C_R3 | parts per mil | 13C/12C ratio measured in third aliquot from the same sample where available |
| 14 | delta_13C_Avg | parts per mil | Mean isotopic ratio of 13C/12C in carbon dioxide based on 1, 2, or 3 measurements |
| Missing data are represented as -9999 | |||
File #2: CD02_Foliar_13C_15N_2004_2006.csv
| Column | Heading | Units/format | Description |
|---|---|---|---|
| 1 | Year | YYYY | Year in which samples were collected: 2004 or 2006 |
| 2 | Month | Month in which samples were collected: August = 8 or October = 10 | |
| 3 | Day | Day of the month in which samples were collected | |
| 4 | Location | Topographic location of sampling point: Valley, Slope, Plateau, and Campinarana or not reported. In 2006 Campinarana was added to the list as a forest type that only occurs at lower slope and valley locations. | |
| 5 | Height | m | Height of sampling location in meters above ground level or not recorded |
| 6 | Sample_id | Internal sample id | |
| 7 | Sample_type | Type of material sampled: leaves with mature and young leaves distinguished in 2006 or litter | |
| 8 | Canopy_position | Location within the canopy based on sample height: Canopy, Understory, Soil, or not identified | |
| 9 | Species | Species identification where noted: In 2004 species were identified only with local name where possible in 2006 species were identified with scientific names | |
| 10 | Description | Notations from original field notebooks | |
| 11 | delta_15N | per mil | Isotopic ratio of 15N/14N in the leaf sample relative to atmospheric N, measured on a continuous flow isotope-ratio mass spectrometer (Finigan Delta Plus) at CENA |
| 12 | delta_13C | per mil | Isotopic ratio of 13C/12C in the leaf or litter sample referenced to PDB, measured on a continuous flow isotope-ratio mass spectrometer (Finigan Delta Plus) at CENA |
| 13 | conc_C | percent | Concentration of carbon in the leaf or litter sample measured by dry combustion and reported in percent by dry weight |
| 14 | conc_N | percent | Concentration of nitrogen in the leaf or litter sample measured by dry combustion and reported in percent by dry weight |
| 15 | C_to_N | Mass based ratio of carbon to nitrogen in the leaf or litter sample calculated by dividing column 13 by column 14 | |
| 16 | Notes | Comments from the field notebooks; no comment or missing comment = none | |
| Missing data are represented as -9999 | |||
File #3: CD02_Met_and_flux_data_2004_2006.csv
| Column | Heading | Units/format | Description |
|---|---|---|---|
| 1 | Year | YYYY | Year in which data were collected: 2004 or 2006 |
| 2 | DOY | Day of the year (DOY) on which data were collected. For 2004, data were collected from day 195 = July 13 thru day 218= August 5. For 2006, data were collected from day 260=September 17 thru day 290=October 17 | |
| 3 | Time | Sampling time in decimal hours. Time given is the end of the 30 minute sampling period | |
| 4 | Temp_Air | degrees C | Air temperature in degrees Celsius |
| 5 | RH | percent | Relative humidity in percent |
| 6 | E_act | kPa | Actual water vapor pressure reported in kilopascals |
| 7 | E_sat | kPa | Saturated water vapor pressure in kilopascals |
| 8 | VPD | kPa | Vapor pressure deficit reported in kilopascals |
| 9 | F_CO2 | umol/m2/s | Carbon dioxide flux measured at 53 m height |
| 10 | CO2_conc | ppm | Atmospheric carbon dioxide concentration measured at 53 meters above ground level |
| 11 | u_star | m/s | Friction velocity measured at 53 meters above ground level in meters per second |
| Missing data are represented by -9999 | |||
| All data were measured at the top of the KM34 tower at 53 meters above ground level. The tower is located on the plateau. | |||
| All data are averages from a 30 minute sampling period: For the meteorological data each sampling period included 60 measurements (scan time interval 30 seconds); for the flux data each sampling period includes 18,000 samples (scan time interval 0.1 seconds) | |||
Site boundaries: (All latitude and longitude given in decimal degrees)
| Site (Region) | Westernmost Longitude | Easternmost Longitude | Northernmost Latitude | Southernmost Latitude | Geodetic Datum |
|---|---|---|---|---|---|
| Amazonas (Manaus) - ZF2 km 34 (Amazonas (Manaus)) | -60.20910 | -60.0000 | -2.50000 | -2.60900 | South-American Datum, 1969 (SAD-69) |
代码
!pip install leafmap
!pip install pandas
!pip install folium
!pip install matplotlib
!pip install mapclassify

import pandas as pd
import leafmap

url = "https://github.com/opengeos/NASA-Earth-Data"
df = pd.read_csv(url, sep="\t")
df

leafmap.nasa_data_login()


results, gdf = leafmap.nasa_data_search(
    short_name="CD02_C_N_Isotopes_1097",
    cloud_hosted=True,
    bounding_box=(-60.21, -2.61, -60.0, -2.5),
    temporal=("2004-08-02", "2006-10-21"),
    count=-1,  # use -1 to return all datasets
    return_gdf=True,
)


gdf.explore()

#leafmap.nasa_data_download(results[:5], out_dir="data")
引用
de Araujo, A.C., J.P.H.B. Ometto, A.J. Dolman, B. Kruijt, M.J. Waterloo and J.R. Ehleringer. 2012. LBA-ECO CD-02 C and N Isotopes in Leaves and Atmospheric CO2, Amazonas, Brazil. Data set. Available on-line [http://daac.ornl.gov ] from Oak Ridge National Laboratory Distributed Active Archive Center, Oak Ridge, Tennessee, U.S.A.
网址推荐
知识星球
知识星球 | 深度连接铁杆粉丝,运营高品质社群,知识变现的工具 (zsxq.com)![]() https://wx.zsxq.com/group/48888525452428
https://wx.zsxq.com/group/48888525452428


 4939
4939

 被折叠的 条评论
为什么被折叠?
被折叠的 条评论
为什么被折叠?
 到【灌水乐园】发言


