


LBA-ECO CD-09 Soil and Vegetation Characteristics, Tapajos National Forest, Brazil
简介
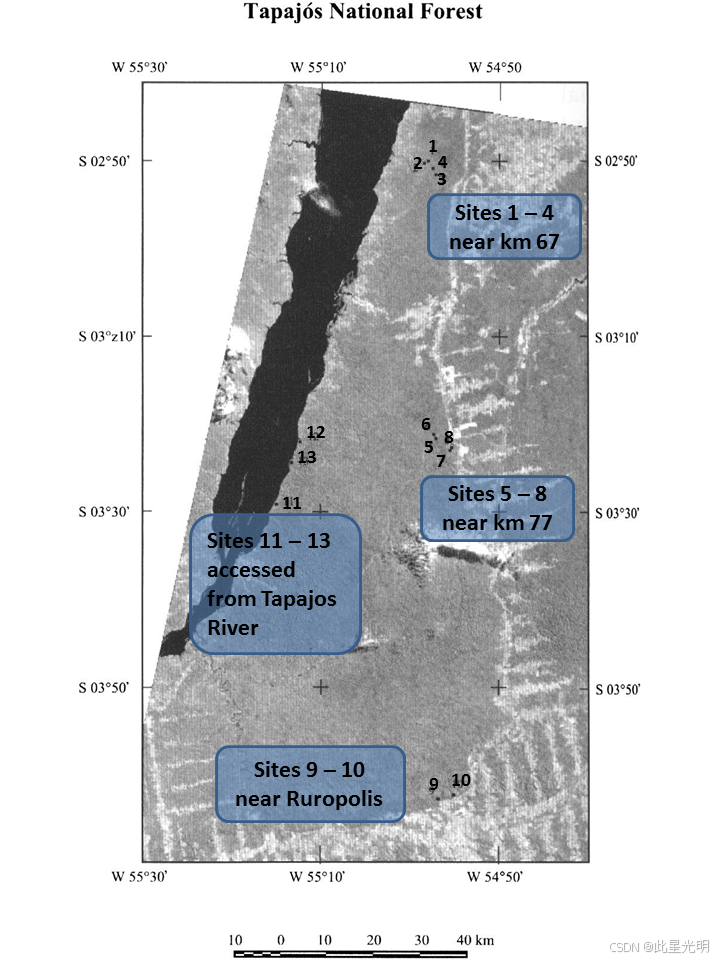
该数据集报告了 1999 年 11 月在巴西帕拉州圣塔伦以南 50 至 100 公里的塔帕若斯国家森林 (TNF) 内四个不同区域进行的土壤和植被调查的结果。在四个区域的 13 个独立站点(均位于原始森林中),收集了深度为 10、30 和 50 厘米的核心土壤样本,并分析了干质量、容重、质地、碳百分比 (C)、有机质百分比和氮百分比 (N)。在这 13 个站点,植被沿着 250 米长、10 米宽的横断面进行描述。通过物种的异速生长关系、测量的高度、冠层尺寸和直径,估算了所有 DBH 超过 10 厘米树干的生物量。使用 LICOR LAI-2000 沿横断面在 26 个点测量了 LAI。黎明时分用猎枪收集冠层叶子样本,并用压力室测定叶水势。对树叶、木材、树皮、细根和凋落物样本进行了%N、%C、δ13C 和δ15N 的分析。此数据集包含五个以逗号分隔的 ASCII 数据文件。
摘要
File 1: CD09_Soil_texture_C_and_N_TNF.csv
| Column | Heading | Units/format | Description |
|---|---|---|---|
| 1 | Plot_ID | Sampling plot identification number: sampling plots 10 meters wide and 250 meters long were established at each location | |
| 2 | Subplot_ID | Subplot identification number: each plot was divided into 5 subplots | |
| 3 | Depth | cm | Sample depth |
| 4 | Wt_wet | g | Fresh weight of first soil sample in grams |
| 5 | Wt_dry | g | Weight in grams of soil sample after being dried in an oven at 105 degrees C |
| 6 | Bulk_density | g per cm3 | Soil bulk density in grams per cubic centimeter |
| 7 | GWC | percent | Gravimetric water content in percent of wet weight |
| 8 | C_conc | percent | Soil carbon concentration in percent by weight analyzed at EMBRAPA in Belem |
| 9 | SOM_conc | percent | Soil organic matter concentration in percent by weight analyzed at EMBRAPA in Belem |
| 10 | N_conc | percent | Soil nitrogen concentration in percent by weight analyzed at EMBRAPA in Belem |
| 11 | CN_ratio | Mass based soil carbon to nitrogen ratio | |
| 12 | Coarse_sand | percent | Percent of soil particles classified as coarse sand |
| 13 | Fine_sand | percent | Percent of soil particles classified as fine sand |
| 14 | Silt | percent | Percent of soil particles classified as silt |
| 15 | Clay | percent | Percent of soil particles classified as clay |
File 2: CD09_Biomass_inventory_TNF.csv
| Column | Heading | Units/format | Description |
|---|---|---|---|
| 1 | Sample_date | yyyymmdd | Sampling date (yyyymmdd) |
| 2 | Sample_year | yyyy | Sample year |
| 3 | Sample_month | mm | Sample month |
| 4 | Sample_day | dd | Sample day |
| 5 | Site | At each site (1-13), a sampling plot was established along a transect 250 m long and 10 m wide | |
| 6 | Subplot | Subplot identification number (1-5): each sampling plot was divided into 5 subplots 50 m long | |
| 7 | L/R | Left (L) or right (R) of the transect line | |
| 8 | Tree_no | Tree identification number | |
| 9 | Species | Identification of species with the local name | |
| 10 | dbh | cm | Diameter at breast height measured in centimeters (cm) |
| 11 | Height | m | Tree height estimated in meters |
| 12 | X | m | Distance along main plot axis in meters. Measurement is reset to zero at the boundary of each subplot |
| 13 | Y | m | Distance to left or right (see column 3) of the main axis |
| 14 | Canopy_x | m | Canopy dimension along the direction of the plot main axis |
| 15 | Canopy_y | m | Canopy dimension perpendicular to the direction of the plot main axis |
| 16 | Notes | Notations from the field notebooks | |
| 17 | Basal_area | cm2 | Basal area of stem calculated in centimeters squared |
| 18 | Biomass_INPE | kg | Biomass of the stem in kilograms calculated using the INPE allometric equations |
| 19 | Biomass_Laurance | kg | Biomass of the stem in kilograms calculated using the Laurance allometric equations |
| Missing values are indicated as -9999 | |||
File 3: CD09_LAI_TNF.csv
| Column | Heading | Units/format | Description |
|---|---|---|---|
| 1 | Sample_year | yyyy | Sample year (yyyy) |
| 2 | Sample_month | mm | Sample month (mm) |
| 3 | Plot_ID | Sampling plot identification number: sampling plots 10 meters wide and 250 meters long were established at each location | |
| 4 | Subplot_ID | Subplot identification number: each plot was divided into 5 subplots | |
| 5 | Distance | m | Distance along the plot main axis where measurement was taken |
| 6 | LAI | Leaf area index measured at dawn or dusk using paired LAI-2000 instruments |
File 4: CD09_Leaf_Water_Potential_TNF.csv
| Column | Heading | Units/format | Description |
|---|---|---|---|
| 1 | Sample_date | yyyymmdd | Sampling date (yyyymmdd) |
| 2 | Sample_year | yyyy | Sample year |
| 3 | Sample_month | mm | Sample month |
| 4 | Sample_day | dd | Sample day |
| 5 | Plot_ID | Sampling plot identification number: sampling plots 10 meters wide and 250 meters long were established at each location | |
| 6 | Time | hh:mm | Time of measurement in local time (GMT-5) |
| 7 | Height | m | Estimated height from which leaves were collected |
| 8 | LWP | MPa | Leaf water potential in Mega Pascals measured with a PMS-600 pressure bomb |
| 9 | Gravity_corr_LWP | MPa | Gravity corrected leaf water potential |
| 10 | Local_name | Local name for tree species | |
| 11 | Notes | Notes from the field notebook |
代码
!pip install leafmap
!pip install pandas
!pip install folium
!pip install matplotlib
!pip install mapclassify

import pandas as pd
import leafmap

url = "https://github.com/opengeos/NASA-Earth-Data/raw"
df = pd.read_csv(url, sep="\t")
df

leafmap.nasa_data_login()


results, gdf = leafmap.nasa_data_search(
    short_name="CD09_Soils_Veg_Tapajos_1104",
    cloud_hosted=True,
    bounding_box=(-55.21, -4.05, -54.91, -2.84),
    temporal=("1999-11-01", "1999-11-29"),
    count=-1,  # use -1 to return all datasets
    return_gdf=True,
)


gdf.explore()

#leafmap.nasa_data_download(results[:5], out_dir="data")
网址推荐
个人主页
https://sites.google.com/view/xingguang/main
知识星球
知识星球 | 深度连接铁杆粉丝,运营高品质社群,知识变现的工具 (zsxq.com)![]() https://wx.zsxq.com/group/48888525452428
https://wx.zsxq.com/group/48888525452428


 被折叠的 条评论
为什么被折叠?
被折叠的 条评论
为什么被折叠?
 到【灌水乐园】发言


