


import os
import matplotlib.pyplot as plt
from nuscenes.nuscenes import NuScenes
from nuscenes.utils.data_classes import LidarPointCloud
import open3d as o3d


nusc = NuScenes(version='v1.0-mini', dataroot='/home/xxxx/Downloads/nuScene_data', verbose=True)
my_scene = nusc.scene[0]

first_sample_token = my_scene['first_sample_token']
sample = nusc.get('sample', first_sample_token)

my_annotation_token = sample['anns'][18]
my_annotation_metadata = nusc.get('sample_annotation', my_annotation_token)
nusc.render_annotation(my_annotation_token)

plt.show()


top_lidar_token = sample['data']['LIDAR_TOP']
top_lidar_data = nusc.get('sample_data', top_lidar_token)

pcd_bin_file = os.path.join(nusc.dataroot, top_lidar_data['filename'])

# Load the .pcd.bin file.
pc = LidarPointCloud.from_file(pcd_bin_file)
pcd = pc.points.T
pcd = pcd.reshape((-1, 4))[:, 0:3]

point_cloud = o3d.geometry.PointCloud()
point_cloud.points = o3d.utility.Vector3dVector(pcd)

# 可视化点云
o3d.visualization.draw_geometries([point_cloud])

print("done")
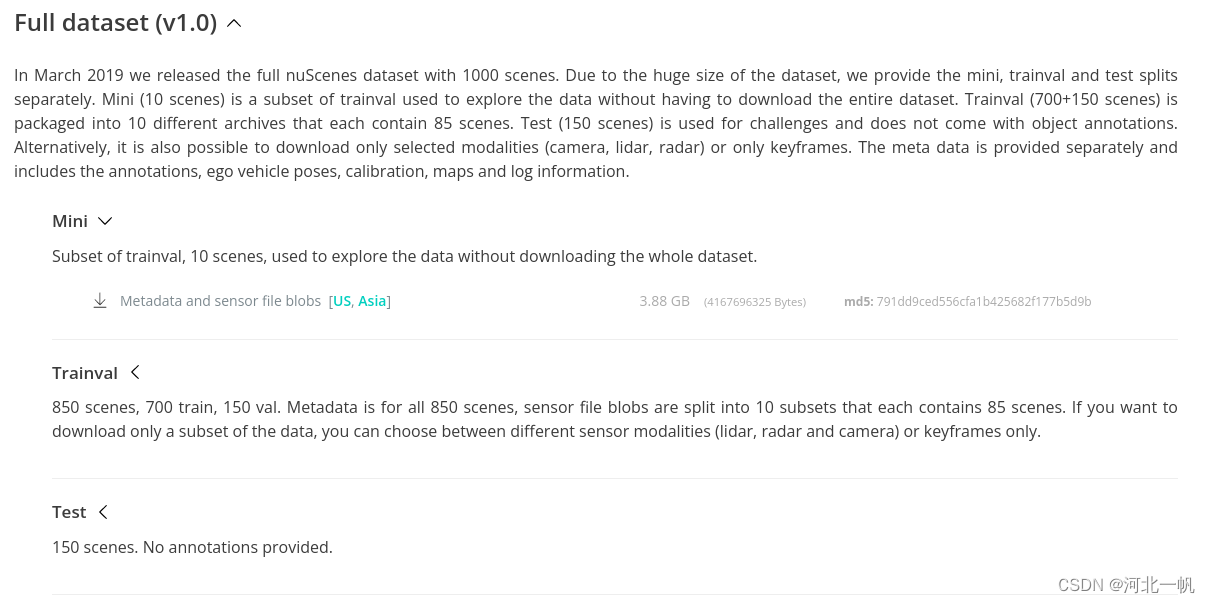
在官网下载并解压缩
首先获取一个场景
nusc = NuScenes(version='v1.0-mini', dataroot='/home/xxxx/Downloads/nuScene_data', verbose=True)
my_scene = nusc.scene[0]
从场景中获取第一个样本,也就是一帧
first_sample_token = my_scene['first_sample_token']
sample = nusc.get('sample', first_sample_token)
如果想找下一个样本,每一个样本中储存着下一个样本的token,一个一个往下找
获取标注
my_annotation_token = sample['anns'][18]
my_annotation_metadata = nusc.get('sample_annotation', my_annotation_token)
nusc.render_annotation(my_annotation_token)

plt.show()
18表示的是,这个样本中被标注的第18个物体
可视化雷达点云
top_lidar_token = sample['data']['LIDAR_TOP']
top_lidar_data = nusc.get('sample_data', top_lidar_token)

pcd_bin_file = os.path.join(nusc.dataroot, top_lidar_data['filename'])

# Load the .pcd.bin file.
pc = LidarPointCloud.from_file(pcd_bin_file)
pcd = pc.points.T
pcd = pcd.reshape((-1, 4))[:, 0:3]

point_cloud = o3d.geometry.PointCloud()
point_cloud.points = o3d.utility.Vector3dVector(pcd)

# 可视化点云
o3d.visualization.draw_geometries([point_cloud])
import time
from nuscenes.nuscenes import NuScenes
import matplotlib.pyplot as plt
from nuscenes.utils.data_classes import LidarPointCloud
import open3d as o3d
import os
import cv2
import numpy as np
from nuscenes.utils.geometry_utils import transform_matrix
from pyquaternion import Quaternion
from bev_projection import plot_bev, map_color
from rangeview_projection import *
import rospy
from sensor_msgs.msg import PointCloud2
from sensor_msgs import point_cloud2
def rv_project(points, fov_up=10*np.pi/180, fov_down=-10*np.pi/180, H=33, W=1024):
fov = abs(fov_down) + abs(fov_up) # get field of view total in rad
# get depth of all points
depth = np.linalg.norm(points, 2, axis=1)
scan_x = points[:, 0]
scan_y = points[:, 1]
scan_z = points[:, 2]
intensity = points[:, 3]
labels = points[:, 4]
yaw = -np.arctan2(scan_y, scan_x)
pitch = np.arcsin(scan_z / depth)
r = np.linalg.norm(points[:, :3], axis=1)
yaw = (yaw + np.pi) / (2 * np.pi)
pitch = (fov_up - pitch) / fov
yaw *= W
pitch *= H
yaw = np.floor(yaw).astype(int)
pitch = np.floor(pitch).astype(int)
pitch[pitch > 32] = 32
canvas = np.zeros((H, W))
canvas[pitch, yaw] = labels
# canvas[pitch, yaw] = r
canvas_ = canvas.copy()
canvas[canvas == 24] = 2
canvas[(canvas_ != 24) & (canvas_ != 0)] = 1
proj = np.zeros([H, W, 3])
proj[pitch, yaw] = points[:, :3]
canvas = canvas[:, 384:641]
proj = proj[:, 384:641]
# plt.imshow(canvas)
# plt.show()
# 计算每一列的均值
# 计算每个二维数组的均值
mean_values = np.mean(proj, axis=(0, 1))
std_dev_values = np.std(proj, axis=(0, 1))
mean_std = [mean_values[0], mean_values[1], mean_values[2],
std_dev_values[0], std_dev_values[1], std_dev_values[2]]
return proj, canvas, mean_std
root_path = "/home/robotics/Downloads/nuscenes"
nusc = NuScenes(version='v1.0-mini', dataroot=root_path, verbose=True)
nusc.list_lidarseg_categories(sort_by='count')
scenes_num = len(nusc.scene)
ms_list = []
for i in range(scenes_num):
my_scene = nusc.scene[i]
first_sample_token = my_scene['first_sample_token']
sample = nusc.get('sample', first_sample_token)
while True:
chan = 'LIDAR_TOP'
top_lidar_token = sample['data']['LIDAR_TOP']
top_lidar_data = nusc.get('sample_data', top_lidar_token)
pcd_bin_file = os.path.join(nusc.dataroot, top_lidar_data['filename'])
# Load the .pcd.bin file.
pc = LidarPointCloud.from_file(pcd_bin_file)
pcd = pc.points.T
intensity = pcd[:, 3]
intensity = intensity[:, np.newaxis]
pcd = pcd[:, :3]
theta = -90 * np.pi/180
R = np.array([[np.cos(theta), -1*np.sin(theta), 0],
[np.sin(theta), np.cos(theta), 0],
[0, 0, 1]])
pcd = R @ pcd.T
pcd = pcd.T
gt_from = 'lidarseg'
lidarseg_labels_filename = os.path.join(nusc.dataroot,
nusc.get(gt_from, sample["data"][chan])['filename'])
points_label = np.fromfile(lidarseg_labels_filename, dtype=np.uint8)
points_label = points_label[:, np.newaxis]
pcd = np.hstack([pcd, intensity, points_label])
proj, canvas, mean_std = rv_project(pcd)
ms_list.append(mean_std)
traindata_name = "extracted_data/train/" + top_lidar_token + ".bin"
label_name = "extracted_data/label/" + top_lidar_token + '.bin'
proj = proj.astype(np.float32)
proj.tofile(traindata_name) # dtype=float32
canvas = canvas.astype(int)
canvas.tofile(label_name) # dtype=int64
try:
sample = nusc.get('sample', sample["next"])
print(sample["next"])
except:
cv2.destroyAllWindows()
break
ms_list = np.array(ms_list)
# 计算每一列的均值
mean_values = np.mean(ms_list, axis=0)
print(mean_values)
# x y z 均值与方差 [ 6.40343786 -0.49902275 0.27761135 12.76431105 6.43923693 1.69093752]
from nuscenes.nuscenes import NuScenes
import matplotlib.pyplot as plt
from nuscenes.utils.data_classes import LidarPointCloud
import open3d as o3d
import os
import cv2
import numpy as np
from nuscenes.utils.geometry_utils import transform_matrix
from pyquaternion import Quaternion


root_path = "/home/robotics/Downloads/nuscenes"
nusc = NuScenes(version='v1.0-mini', dataroot=root_path, verbose=True)

my_scene = nusc.scene[0]
first_sample_token = my_scene['first_sample_token']
sample = nusc.get('sample', first_sample_token)

_, axs = plt.subplots(3, 3, figsize=(9, 9))

all_pc_worldcoord = np.zeros((1, 3))

while True:
	# CAM_FRONT  CAM_FRONT_RIGHT  CAM_FRONT_LEFT  CAM_BACK  CAM_BACK_RIGHT  CAM_BACK_LEFT
	cam_data_token1 = sample['data']['CAM_FRONT_LEFT']
	cam_data_token2 = sample['data']['CAM_FRONT']
	cam_data_token3 = sample['data']['CAM_FRONT_RIGHT']
	cam_data_token4 = sample['data']['CAM_BACK_LEFT']
	cam_data_token5 = sample['data']['CAM_BACK']
	cam_data_token6 = sample['data']['CAM_BACK_RIGHT']
	cam_data1 = nusc.get("sample_data", cam_data_token1)
	cam_data2 = nusc.get("sample_data", cam_data_token2)
	cam_data3 = nusc.get("sample_data", cam_data_token3)
	cam_data4 = nusc.get("sample_data", cam_data_token4)
	cam_data5 = nusc.get("sample_data", cam_data_token5)
	cam_data6 = nusc.get("sample_data", cam_data_token6)

	image1 = cv2.cvtColor(cv2.imread(os.path.join(root_path, cam_data1["filename"])), cv2.COLOR_BGR2RGB)
	image2 = cv2.cvtColor(cv2.imread(os.path.join(root_path, cam_data2["filename"])), cv2.COLOR_BGR2RGB)
	image3 = cv2.cvtColor(cv2.imread(os.path.join(root_path, cam_data3["filename"])), cv2.COLOR_BGR2RGB)
	image4 = cv2.cvtColor(cv2.imread(os.path.join(root_path, cam_data4["filename"])), cv2.COLOR_BGR2RGB)
	image5 = cv2.cvtColor(cv2.imread(os.path.join(root_path, cam_data5["filename"])), cv2.COLOR_BGR2RGB)
	image6 = cv2.cvtColor(cv2.imread(os.path.join(root_path, cam_data6["filename"])), cv2.COLOR_BGR2RGB)
	# axs[0, 0].imshow(image1)
	# axs[0, 1].imshow(image2)
	# axs[0, 2].imshow(image3)
	# axs[1, 0].imshow(image4)
	# axs[1, 1].imshow(image5)
	# axs[1, 2].imshow(image6)

	chan = 'LIDAR_TOP'
	top_lidar_token = sample['data']['LIDAR_TOP']
	top_lidar_data = nusc.get('sample_data', top_lidar_token)

	pcd_bin_file = os.path.join(nusc.dataroot, top_lidar_data['filename'])

	# Load the .pcd.bin file.
	pc = LidarPointCloud.from_file(pcd_bin_file)
	pcd = pc.points.T
	pcd = pcd[:, :3]

	gt_from = 'lidarseg'
	lidarseg_labels_filename = os.path.join(nusc.dataroot,
                                            nusc.get(gt_from, sample["data"][chan])['filename'])
	points_label = np.fromfile(lidarseg_labels_filename, dtype=np.uint8)[:, np.newaxis]

	# pc_drivable = pcd[pcd[:, 3] == 24][:, :3]

	ego_pose = nusc.get('ego_pose', top_lidar_data['ego_pose_token'])
	cal_sensor = nusc.get('calibrated_sensor', top_lidar_data['calibrated_sensor_token'])

	car_from_senor = transform_matrix(cal_sensor['translation'], Quaternion(cal_sensor['rotation']), inverse=False)
	global_from_car = transform_matrix(ego_pose['translation'], Quaternion(ego_pose['rotation']), inverse=False)
	global_from_sensor = np.dot(global_from_car, car_from_senor)

	ones_column = np.ones((pcd.shape[0], 1))
	pc_one = np.hstack((pcd, ones_column))
	pc_worldcoord = global_from_sensor @ pc_one.T
	pc_worldcoord = (pc_worldcoord.T)[:, :3]

	if all_pc_worldcoord.shape[0] == 1:
		all_pc_worldcoord = np.vstack((all_pc_worldcoord, pc_worldcoord))
		all_pc_worldcoord = all_pc_worldcoord[1:]
	else:
		all_pc_worldcoord = np.vstack((all_pc_worldcoord, pc_worldcoord))

	try:
		sample = nusc.get('sample', sample["next"])
		print(sample["next"])
	except:
		break


# 可视化点云
point_cloud = o3d.geometry.PointCloud()
point_cloud.points = o3d.utility.Vector3dVector(all_pc_worldcoord)
o3d.visualization.draw_geometries([point_cloud])
		pc = point_cloud2.read_points(msg, field_names=('x', 'y', 'z'), skip_nans=True)
		pc_array = np.array(list(pc))

		# 设置鸟瞰图范围 创建图像数组
		side_range = (-15, 15)  # 左右距离
		fwd_range = (-5, 25)  # 后前距离
		res = 0.05  # 分辨率
		x_max = 1 + int((side_range[1] - side_range[0]) / res)
		y_max = 1 + int((fwd_range[1] - fwd_range[0]) / res)
		im = np.zeros([y_max, x_max], dtype=np.uint8)

		im = plot_bev(pc_array, side_range, fwd_range, res, im, color_num=1)


def plot_bev(pointcloud, side_range, fwd_range, res, im, im_label):
    # 筛选出一定高度范围的点
    pointcloud = pointcloud[(pointcloud[:, 2] > -5) & (pointcloud[:, 2] < 0.5)]
    x_points = pointcloud[:, 0]
    y_points = pointcloud[:, 1]
    z_points = pointcloud[:, 2]
    label = pointcloud[:, 3]

    # 获得区域内的点
    f_filt = np.logical_and(x_points > fwd_range[0], x_points < fwd_range[1])
    s_filt = np.logical_and(y_points > side_range[0], y_points < side_range[1])
    filter = np.logical_and(f_filt, s_filt)
    indices = np.argwhere(filter).flatten()
    x_points = x_points[indices]
    y_points = y_points[indices]
    z_points = z_points[indices]
    label_points = label[indices]

    # 计算均值
    mean_std = np.array([[np.mean(x_points), np.var(x_points)],
                [np.mean(y_points), np.var(y_points)],
                [np.mean(z_points), np.var(z_points)]])
    print("mean and std:", mean_std)

    x_img = (-y_points / res).astype(np.int32)
    y_img = (-x_points / res).astype(np.int32)
    # 调整坐标原点
    x_img -= int(np.floor(side_range[0]) / res)
    y_img += int(np.floor(fwd_range[1]) / res)

    im[y_img, x_img, 0] = x_points
    im[y_img, x_img, 1] = y_points
    im[y_img, x_img, 2] = z_points

    im_label[y_img, x_img] = label_points

    return im, im_label


 961
961


 被折叠的 条评论
为什么被折叠?
被折叠的 条评论
为什么被折叠?
 到【灌水乐园】发言


