


1.环境和目的
目的:实现对刻度尺的图形尺寸识别
环境:python+vscode,导入包如下:
import cv2

import numpy as np

from scipy.signal import convolve2d

from sklearn.linear_model import LinearRegression

from sklearn.linear_model import RANSACRegressor
2.实现过程
2.1读取图像和灰度转换
# Usage remains the same
image_path = r"D:\study\pyhon\opencv\Hessian\12.png"
# Read image and convert to grayscale
image = cv2.imread(image_path)
# 将图像转换为灰度图像
gray_image = cv2.cvtColor(image, cv2.COLOR_BGR2GRAY)
edge_image = detect_edges_hessian(gray_image)
2.2 hessian边缘处理,代码如下,通过调节condition值可以对边缘图像进行调整,可自行尝试;
def detect_edges_hessian(image, threshold=1e-3, blur_ksize=3):
    """Detect edges using the Hessian matrix method with improvements."""

    if image is None:
        print(f"Error: Could not read the image at {image_path}. Please check the path.")
        return

    # Image preprocessing: Gaussian blur
    blurred_image = cv2.GaussianBlur(image, (blur_ksize, blur_ksize), 0)

    # Compute derivatives
    Ixx, Ixy, Iyy = compute_derivative_images(blurred_image)

    # Compute eigenvalues
    trace = Ixx + Iyy
    det = Ixx * Iyy - Ixy**2
    lambda1 = 0.5 * (trace + np.sqrt(trace**2 - 4*det))
    lambda2 = 0.5 * (trace - np.sqrt(trace**2 - 4*det))

    # Edge detection
    edge_map = np.zeros_like(blurred_image, dtype=np.float64)
    condition = (lambda2 < threshold)&(lambda1 > lambda2 * 10)  # Adjust threshold strategy
    edge_map[condition] = lambda2[condition]  # Use λ2 for edge strength

    # Normalize and scale
    edge_map = normalize_and_scale(edge_map)
    return edge_map
上述代码中引用了几个子函数,函数代码如下:
def gaussian_derivative_kernel(size, sigma):
    """Generate Gaussian derivative kernels."""
    ax = np.linspace(-(size//2), size//2, size)
    xx, yy = np.meshgrid(ax, ax)
    kernel = np.exp(-(xx**2 + yy**2) / (2*sigma**2))
    kernel_x = -xx * kernel / (sigma**2)
    kernel_y = -yy * kernel / (sigma**2)
    return kernel_x, kernel_y

def compute_derivative_images(image, sigma=1):
    """Compute image derivatives using Gaussian derivative kernels."""
    kernel_x, kernel_y = gaussian_derivative_kernel(3, sigma)
    Ix = convolve2d(image, kernel_x, mode='same', boundary='symm')
    Iy = convolve2d(image, kernel_y, mode='same', boundary='symm')
    Ixx = convolve2d(Ix, kernel_x, mode='same', boundary='symm')
    Ixy = convolve2d(Ix, kernel_y, mode='same', boundary='symm')
    Iyy = convolve2d(Iy, kernel_y, mode='same', boundary='symm')
    return Ixx, Ixy, Iyy

def normalize_and_scale(image):
    """Normalize and scale the image to 0-255."""
    return np.uint8(255 * (image - np.min(image)) / (np.max(image) - np.min(image)))
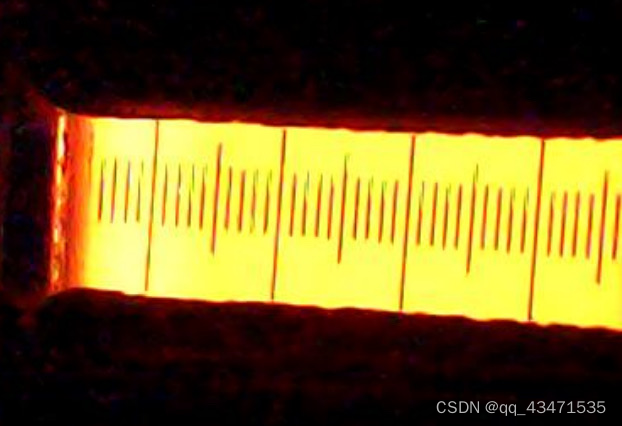
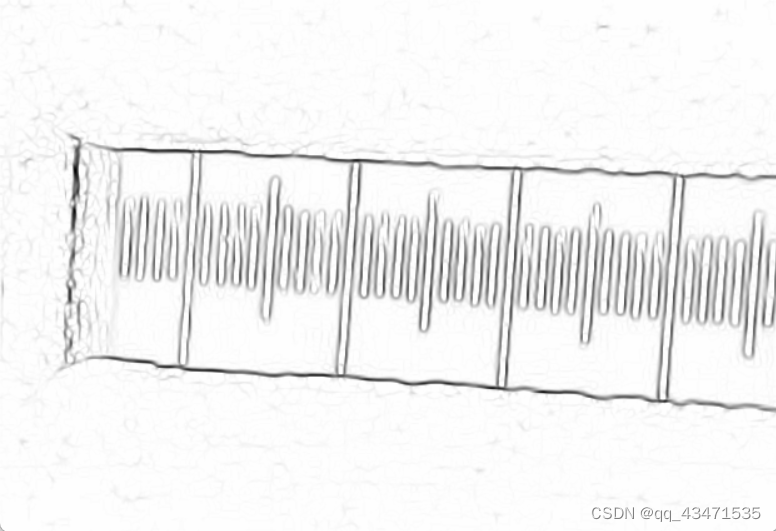
效果图如下
原图:
提取后图像:
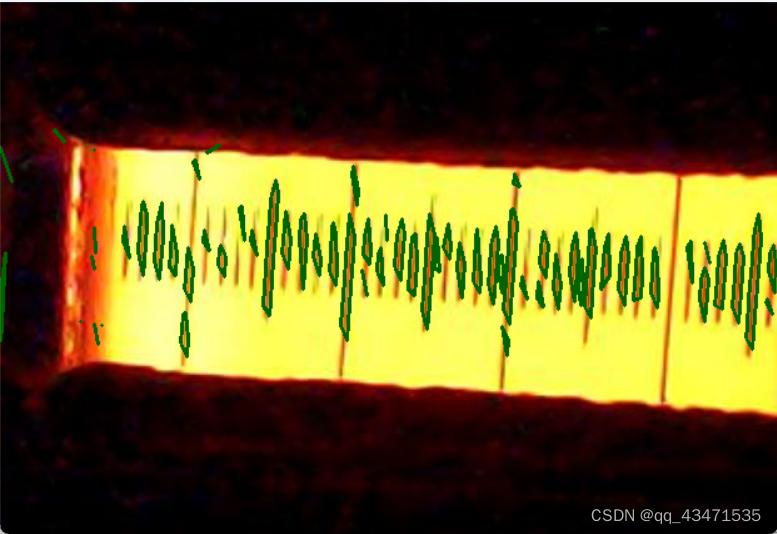
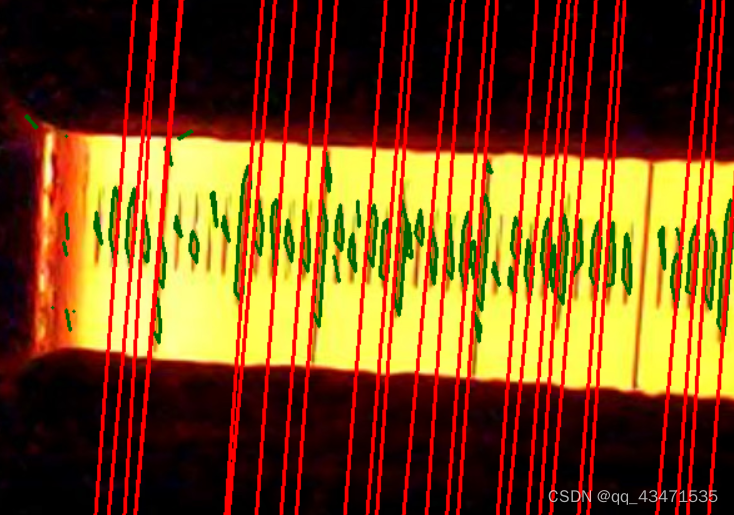
2.4 边框提取,筛选,根据筛选数据进行直线拟合,得到线条,将得到的线条数据进行筛选合并和过滤,得到符合要求的线条,将筛选后的线条进行绘画显示
# 修改提取边缘点的函数以收集所有拟合的直线,并在最后进行合并
def extract_edge_points_and_merge_lines(edge_map,image):
    """从边缘图中提取边缘点坐标"""

    edge_map=255-edge_map
    all_lines = []
    edge_points = extract_edge_points(edge_map,image)
    for contour in edge_points:

        coef, intercept= fit_line_with_ransac(contour,image)
        if coef:
            all_lines.append((coef, intercept))

    # 合并相似的直线
    merged_lines = merge_and_filter_lines(all_lines)

    # 在图像上绘制合并后的直线
    for slope, intercept in merged_lines:
        draw_line_on_image(image, slope, intercept)

    cv2.imshow("Edges with Merged Lines Fitted", image)


def draw_line_on_image(image, coef, intercept):
    """在图像上绘制拟合的直线"""
    print(coef,intercept)
    height, width = image.shape[:2]
    print(height, width)
    # 选择合适的范围来显示直线,这里简单地使用图像的宽度范围
    x = np.linspace(0, width, num=width)
    y = coef * x + intercept
    # 确保y值在图像范围内
    y = np.clip(y, 0, height-1).astype(int)
    x = x.astype(int)
    # 在图像上绘制直线
    for i in range(len(x)-1):
        cv2.line(image, (x[i], y[i]), (x[i+1], y[i+1]), (0, 0, 255), 2)
上述代码中引用了几个子函数,函数代码如下:
def extract_edge_points(edge_map, image):

    # 将边缘图二值化处理
    _, thresh = cv2.threshold(edge_map, 8, 250, cv2.THRESH_BINARY)
    # 寻找轮廓
    contours, _ = cv2.findContours(thresh, cv2.RETR_TREE, cv2.CHAIN_APPROX_SIMPLE)


    height,width=image.shape[:2]
    min_area=width*height*0.00035
    max_area=width*height*0.003
    #print(min_area,max_area)
    contours1=[]

    #print("**************")
    for contour in contours:
        # 计算轮廓面积
        area = cv2.contourArea(contour)

        # 检查面积是否在设定范围内
        if min_area < area < max_area:
            contours1.append(contour)
    print(len(contours1))

    return contours1

def fit_line_with_ransac(points,image, max_iterations=2000, stop_probability=0.99, residual_threshold=5):
    points = remove_short_edges(points, 8,image)
    if len(points) > 4:

        # 确保points是NumPy数组
        points = np.array(points)

        # 初始化RANSAC回归器,调整参数以提高拟合质量
        ransac = RANSACRegressor(
            LinearRegression(),
            min_samples=2,
            max_trials=max_iterations,
            stop_probability=stop_probability,
            residual_threshold=residual_threshold
        )

        # 拟合数据
        ransac.fit(points[:, 0].reshape(-1, 1), points[:, 1])

        # 获取最优模型的系数和截距
        coef = ransac.estimator_.coef_[0]
        intercept = ransac.estimator_.intercept_
    else:
        coef = None
        intercept = None

    return coef, intercept


def remove_short_edges(contour, min_length,image):
    # Ensure contour is a numpy array and squeeze it to handle both single and multi-dimensional inputs
    contour = np.squeeze(contour)

    if contour.ndim != 2 or contour.shape[1] != 2:
        raise ValueError("Contour should be a 2D array with each row representing a point (x, y).")

    new_contour = [contour[0]]
    for i in range(1, len(contour)):
        p1 = contour[i-1]
        p2 = contour[i]
        if edge_length(p1, p2) >= min_length:
            new_contour.append(p2)
    new_contour = np.array(new_contour, dtype=np.int32)

    # Check if the contour has points to draw
    if new_contour.size > 0:
        cv2.drawContours(image, [new_contour], -1, (0, 100, 0), 2)
    else:
        print("No points left to draw after removing short edges.")

    cv2.imshow("Edges Detected by Improved Hessian11", image)
    # Convert new_contour back to a proper 2D numpy array without extra dimensions

    return np.array(new_contour, dtype=np.int32)
def merge_and_filter_lines(lines, slope_threshold_merge=1.5, intercept_threshold=10, slope_threshold_filter=8):
    """
    合并斜率和截距相近的直线,然后进一步筛选出斜率非常接近的直线。
    """
    # 合并斜率和截距相近的直线
    merged_lines = []
    for line in lines:
        slope, intercept = line
        found_similar = False
        for i, (merged_slope, merged_intercept) in enumerate(merged_lines):
            if abs(slope - merged_slope) < slope_threshold_merge and abs(intercept - merged_intercept) < intercept_threshold:
                new_slope = (merged_slope + slope) / 2
                new_intercept = (merged_intercept + intercept) / 2
                merged_lines[i] = (new_slope, new_intercept)
                found_similar = True
                break
        if not found_similar:
            merged_lines.append(line)

    # 筛选斜率非常接近的直线
    filtered_lines = []
    for line in merged_lines:
        slope, _ = line
        if not any(abs(slope - other_slope) > slope_threshold_filter for other_slope, _ in filtered_lines):
            filtered_lines.append(line)
    """
    k_set=0
    b_set=0
    for y in filtered_lines:
        k,b=y
        k_set +=k/len(filtered_lines)
        b_set +=b/len(filtered_lines)
    filtered_line22=[]
    filtered_lines22=[]
    for _,b1 in filtered_lines:
        #if abs(b1-b_set)<600:
        k2=k_set
        b2=b1
        filtered_line22=(k2,b2)
        filtered_lines22.append(filtered_line22)
        print(k2,b2)

    """

    return filtered_lines
效果如下:
加入过滤后的couters图形:
拟合合并过滤后的直线图形:
总结:
距离计算部分需结合指定长度进行各个直线部分的相似匹配,得到均值斜率,基于此进行截距的计算,得到直线间的间隔。
缺陷:目前的图像在得到直线方面不足,无法对所有需要的轮廓进行识别,thinking中。


 1638
1638


 被折叠的 条评论
为什么被折叠?
被折叠的 条评论
为什么被折叠?
 到【灌水乐园】发言


