


附件中提供了 1950~2021 年全世界各个国家的人口数据,同时包括了不同年龄段的人口数据。请你们团队使用附件中的相关数据,进行数据统计与分析,回答下列问题:
问题一:请绘制全球 1950~2021 年总人口随时间变化的趋势折线图,分析整体人口的变化趋势,然后分别统计所有国家 2011~2021 的人口增长率和增长人数。 给出人口增长率最大的前 10 个国家和最小的后 10 个国家名单,人口增长数最多的前 10 个国家和最少的后 10 个国家名单。
问题二:请比较 2021 年不同国家的总人口数,绘制不同国家总人口数的柱状图,并给出总人口最多的前 10 个国家和最少的后 10 个国家名单。
问题三:请任选三个国家,分别绘制不同年龄段人口的直方图,对比分析年龄分布的异同点,并结合这三个国家的国情分析不同年龄段人口的分布原因。
问题四:请建立人口预测的数学模型,然后分别预测到 2100 年底中国、印度和全球的总人口数,并分析人口的变化趋势。
下面正式开始。
1.数据探索(EDA)
先读取文件并初步了解数据集。
注意这个数据集当中包含了"World", "Less developed regions", "Asia (UN)"等非国家对象,需要排除掉。这个点非常坑,直到我打印人口增长数排名前10的“国家”时才发现...之前根本发现不了...无语
import os import pandas as pd from tabulate import tabulate desktop_path = '/Users/XXX/Desktop' # 将XXX替换为用户名(Mac) os.chdir(desktop_path) # 将工作目录改为桌面 df_train = pd.read_csv('population.csv') # 导入训练集 regions_columns = ['Less developed regions', 'Less developed regions, excluding least developed countries', 'Less developed regions, excluding China', 'More developed regions', 'Least developed countries'] continent_columns = ['World', 'Asia (UN)', 'Africa (UN)', 'Latin America and the Caribbean (UN)', 'Northern America (UN)', 'Europe (UN)'] income_columns = ['Low-income countries', 'Upper-middle-income countries', 'Lower-middle-income countries', 'High-income countries'] group_columns = ['Land-locked developing countries (LLDC)', 'Small island developing states (SIDS)'] delete_columns = regions_columns + continent_columns + income_columns + group_columns df_train = df_train[~df_train['Country name'].isin(delete_columns)] # "~"作为取反运算符用于反转布尔值。如果 'Country name' 值在 delete_columns 中,原本返回"Yes",但这里反转后变为"No",即删除这些行 print("Train:",len(df_train)) # 打印训练集的数据量 print(tabulate(df_train.head(), headers='keys', tablefmt='pretty')) # 生成表格,如果是jupyter notebook可以直接用df_train.head()
得到的结果:
Train: 16848 +---+--------------+------+------------+-------------------------------------------+-------------------------------------------+--------------------------------------------+--------------------------------+--------------------------------+--------------------------------+--------------------------------+---------------------+------------------------------+------------------------------+--------------------------------+--------------------------------+--------------------------------+--------------------------------+--------------------------------+--------------------------------+--------------------------------+--------------------------------+--------------------------------+--------------------------------+---------------------------------+ | | Country name | Year | Population | Population of children under the age of 1 | Population of children under the age of 5 | Population of children under the age of 15 | Population under the age of 25 | Population aged 15 to 64 years | Population older than 15 years | Population older than 18 years | Population at age 1 | Population aged 1 to 4 years | Population aged 5 to 9 years | Population aged 10 to 14 years | Population aged 15 to 19 years | Population aged 20 to 29 years | Population aged 30 to 39 years | Population aged 40 to 49 years | Population aged 50 to 59 years | Population aged 60 to 69 years | Population aged 70 to 79 years | Population aged 80 to 89 years | Population aged 90 to 99 years | Population older than 100 years | +---+--------------+------+------------+-------------------------------------------+-------------------------------------------+--------------------------------------------+--------------------------------+--------------------------------+--------------------------------+--------------------------------+---------------------+------------------------------+------------------------------+--------------------------------+--------------------------------+--------------------------------+--------------------------------+--------------------------------+--------------------------------+--------------------------------+--------------------------------+--------------------------------+--------------------------------+---------------------------------+ | 0 | Afghanistan | 1950 | 7480464 | 301735.0 | 1248282 | 3068855 | 4494349 | 4198587 | 4411609 | 3946595 | 258652.02 | 946547.0 | 966210 | 854363 | 757113 | 1241348 | 909953 | 661807 | 467170 | 271905 | 92691 | 9499 | 123 | 0.0 | | 1 | Afghanistan | 1951 | 7571542 | 299368.0 | 1246857 | 3105444 | 4552138 | 4250002 | 4466098 | 3993640 | 254304.0 | 947489.0 | 991791 | 866796 | 768616 | 1260904 | 922765 | 667015 | 468881 | 273286 | 94358 | 10155 | 118 | 0.0 | | 2 | Afghanistan | 1952 | 7667534 | 305393.0 | 1248220 | 3145070 | 4613604 | 4303436 | 4522464 | 4041439 | 252906.0 | 942827.0 | 1017993 | 878857 | 781411 | 1280288 | 935638 | 672491 | 470898 | 274852 | 96026 | 10721 | 139 | 0.0 | | 3 | Afghanistan | 1953 | 7764549 | 311574.0 | 1254725 | 3186382 | 4676232 | 4356242 | 4578167 | 4088379 | 258717.02 | 943151.0 | 1039950 | 891707 | 794308 | 1298803 | 948321 | 678064 | 472969 | 276577 | 97705 | 11254 | 166 | 0.0 | | 4 | Afghanistan | 1954 | 7864289 | 317584.0 | 1267817 | 3231060 | 4741371 | 4408474 | 4633229 | 4136116 | 264765.0 | 950233.0 | 1055592 | 907651 | 806216 | 1316768 | 961484 | 684153 | 475117 | 278210 | 99298 | 11793 | 190 | 0.0 | +---+--------------+------+------------+-------------------------------------------+-------------------------------------------+--------------------------------------------+--------------------------------+--------------------------------+--------------------------------+--------------------------------+---------------------+------------------------------+------------------------------+--------------------------------+--------------------------------+--------------------------------+--------------------------------+--------------------------------+--------------------------------+--------------------------------+--------------------------------+--------------------------------+--------------------------------+---------------------------------+
再看一下数据值是否有缺失与数值类型:
print(df_train.info())
得到的结果:<class 'pandas.core.frame.DataFrame'> Index: 16848 entries, 0 to 18071 Data columns (total 24 columns): # Column Non-Null Count Dtype --- ------ -------------- ----- 0 Country name 16848 non-null object 1 Year 16848 non-null int64 2 Population 16848 non-null int64 3 Population of children under the age of 1 16848 non-null float64 4 Population of children under the age of 5 16848 non-null int64 5 Population of children under the age of 15 16848 non-null int64 6 Population under the age of 25 16848 non-null int64 7 Population aged 15 to 64 years 16848 non-null int64 8 Population older than 15 years 16848 non-null int64 9 Population older than 18 years 16848 non-null int64 10 Population at age 1 16848 non-null float64 11 Population aged 1 to 4 years 16848 non-null float64 12 Population aged 5 to 9 years 16848 non-null int64 13 Population aged 10 to 14 years 16848 non-null int64 14 Population aged 15 to 19 years 16848 non-null int64 15 Population aged 20 to 29 years 16848 non-null int64 16 Population aged 30 to 39 years 16848 non-null int64 17 Population aged 40 to 49 years 16848 non-null int64 18 Population aged 50 to 59 years 16848 non-null int64 19 Population aged 60 to 69 years 16848 non-null int64 20 Population aged 70 to 79 years 16848 non-null int64 21 Population aged 80 to 89 years 16848 non-null int64 22 Population aged 90 to 99 years 16848 non-null int64 23 Population older than 100 years 16848 non-null float64 dtypes: float64(4), int64(19), object(1) memory usage: 3.2+ MB None
由于国家间差异极大,因此直接分析数据分布情况没有意义。我们直接给每个国家加一个index标签方便区分:num_countries = df_train['Country name'].nunique() # 打印数据集中'Country name'列的唯一值的数量 print(f"Number of unique countries: {num_countries}") unique_vals = df_train['Country name'].unique().tolist() # 将数据集中'Country name'列的唯一值收集起来并转化为列表 def CountryIndex(df): df['index'] = df['Country name'].apply(lambda x: unique_vals.index(x) + 1) # 使用lambda匿名函数根据'Country name'添加index列。这里可以在最后加上'if x in unique_vals else None' return df df_train = CountryIndex(df_train) print(tabulate(df_train.head(), headers='keys', tablefmt='pretty'))
得到的结果:Number of unique countries: 234 +---+--------------+------+------------+-------------------------------------------+-------------------------------------------+--------------------------------------------+--------------------------------+--------------------------------+--------------------------------+--------------------------------+---------------------+------------------------------+------------------------------+--------------------------------+--------------------------------+--------------------------------+--------------------------------+--------------------------------+--------------------------------+--------------------------------+--------------------------------+--------------------------------+--------------------------------+---------------------------------+-------+ | | Country name | Year | Population | Population of children under the age of 1 | Population of children under the age of 5 | Population of children under the age of 15 | Population under the age of 25 | Population aged 15 to 64 years | Population older than 15 years | Population older than 18 years | Population at age 1 | Population aged 1 to 4 years | Population aged 5 to 9 years | Population aged 10 to 14 years | Population aged 15 to 19 years | Population aged 20 to 29 years | Population aged 30 to 39 years | Population aged 40 to 49 years | Population aged 50 to 59 years | Population aged 60 to 69 years | Population aged 70 to 79 years | Population aged 80 to 89 years | Population aged 90 to 99 years | Population older than 100 years | index | +---+--------------+------+------------+-------------------------------------------+-------------------------------------------+--------------------------------------------+--------------------------------+--------------------------------+--------------------------------+--------------------------------+---------------------+------------------------------+------------------------------+--------------------------------+--------------------------------+--------------------------------+--------------------------------+--------------------------------+--------------------------------+--------------------------------+--------------------------------+--------------------------------+--------------------------------+---------------------------------+-------+ | 0 | Afghanistan | 1950 | 7480464 | 301735.0 | 1248282 | 3068855 | 4494349 | 4198587 | 4411609 | 3946595 | 258652.02 | 946547.0 | 966210 | 854363 | 757113 | 1241348 | 909953 | 661807 | 467170 | 271905 | 92691 | 9499 | 123 | 0.0 | 1 | | 1 | Afghanistan | 1951 | 7571542 | 299368.0 | 1246857 | 3105444 | 4552138 | 4250002 | 4466098 | 3993640 | 254304.0 | 947489.0 | 991791 | 866796 | 768616 | 1260904 | 922765 | 667015 | 468881 | 273286 | 94358 | 10155 | 118 | 0.0 | 1 | | 2 | Afghanistan | 1952 | 7667534 | 305393.0 | 1248220 | 3145070 | 4613604 | 4303436 | 4522464 | 4041439 | 252906.0 | 942827.0 | 1017993 | 878857 | 781411 | 1280288 | 935638 | 672491 | 470898 | 274852 | 96026 | 10721 | 139 | 0.0 | 1 | | 3 | Afghanistan | 1953 | 7764549 | 311574.0 | 1254725 | 3186382 | 4676232 | 4356242 | 4578167 | 4088379 | 258717.02 | 943151.0 | 1039950 | 891707 | 794308 | 1298803 | 948321 | 678064 | 472969 | 276577 | 97705 | 11254 | 166 | 0.0 | 1 | | 4 | Afghanistan | 1954 | 7864289 | 317584.0 | 1267817 | 3231060 | 4741371 | 4408474 | 4633229 | 4136116 | 264765.0 | 950233.0 | 1055592 | 907651 | 806216 | 1316768 | 961484 | 684153 | 475117 | 278210 | 99298 | 11793 | 190 | 0.0 | 1 | +---+--------------+------+------------+-------------------------------------------+-------------------------------------------+--------------------------------------------+--------------------------------+--------------------------------+--------------------------------+--------------------------------+---------------------+------------------------------+------------------------------+--------------------------------+--------------------------------+--------------------------------+--------------------------------+--------------------------------+--------------------------------+--------------------------------+--------------------------------+--------------------------------+--------------------------------+---------------------------------+-------+
可以发现index列已经被正确添加了,这样我们在后续统计以及绘图时就不再需要遍历'Country name'列了。
2.问题解决
2.1 问题一
绘制全球 1950~2021 年总人口随时间变化的趋势折线图:import matplotlib.pyplot as plt import seaborn as sns plt.figure(figsize=(14, 8)) sns.lineplot(data=df_train, x='Year', y='Population', hue='Country name', palette='tab10', linewidth=2.5, legend=True) # 关键在于设置data、x、y这三个变量的值。这里因为图例过长,可以将legend调整为False以隐藏图例 # 设置图像标题和标签 plt.title('Population Change Over Years by Country Index') plt.xlabel('Year') plt.ylabel('Population') # 这里显示图例 plt.legend(title='Country Index', loc='upper left', bbox_to_anchor=(1, 1)) plt.show()
得到的结果:
总人口随时间变化的趋势折线图
要求统计所有国家 2011~2021 的人口增长率和增长人数:
# 找到统计数据中 Year 的起始值与最终值 year_start = df_train['Year'].min() year_end = df_train['Year'].max() # 找到每个 index 在年份的起始值与最终值时的 Population population_start = df_train[df_train['Year'] == year_start] population_end = df_train[df_train['Year'] == year_end] population_start = population_start[['index', 'Country name', 'Population']] # 合并起始值与最终值的数据 df_increase = pd.merge(population_start, population_end, on='index', suffixes=('_start', '_end')) # on='index'表示将两个DataFrame是根据它们的index进行合并。suffixes=('_start', '_end')用于指定在合并过程中,如果有重叠的列名时如何重命名这些列。 # 计算人口增长 df_increase['Population_change'] = df_increase['Population_end'] - df_increase['Population_start'] # 计算人口增长率 df_increase['Growth_rate(%)'] = round((df_increase['Population_change'] / df_increase['Population_start']) * 100, 2) # 使用round()函数对计算结果进行四舍五入到小数点后两位 # 筛选需要的列并打印数据 df_increase = df_increase[['index', 'Country name_start', 'Population_start', 'Population_end', 'Population_change', 'Growth_rate(%)']] print(tabulate(df_increase.head(), headers='keys', tablefmt='pretty'))
得到的结果:
+---+-------+--------------------+------------------+----------------+-------------------+----------------+ | | index | Country name_start | Population_start | Population_end | Population_change | Growth_rate(%) | +---+-------+--------------------+------------------+----------------+-------------------+----------------+ | 0 | 1 | Afghanistan | 7480464 | 40099460 | 32618996 | 436.06 | | 1 | 2 | Albania | 1252587 | 2854710 | 1602123 | 127.91 | | 2 | 3 | Algeria | 9019866 | 44177964 | 35158098 | 389.79 | | 3 | 4 | American Samoa | 19057 | 45056 | 25999 | 136.43 | | 4 | 5 | Andorra | 6028 | 79057 | 73029 | 1211.5 | +---+-------+--------------------+------------------+----------------+-------------------+----------------+
编写绘图函数:
def plot_numerics(data): numeric_columns = data.columns # 存储行数 for column in numeric_columns: # 方便绘制预测值的分布 _, ax = plt.subplots(1, 2, figsize=(16, 5)) # 将子图的轴对象赋值给变量 ax ,方便设置属性(一般不关心返回的第一个对象,即图表对象) ax = ax.flatten() # 将 ax 变量展平为一维数组,方便访问 # 绘制直方图 sns.histplot(data[column], bins=50, kde=True, color='#3498db', ax=ax[0]) # data[column]指定统计对象为FloodProbability;bins=50指定了直方图的箱数为50;kde=True表示绘制核密度估计(KDE)曲线,以显示数据的分布;ax=ax[0]指定了绘制直方图的坐标轴 ax[0].set_title(f'Histogram of {column}', fontsize=15, fontweight='bold') # f'Histogram of {column}'使用了f-string语法,其中{column}将被替换为当前迭代的列名;fontsize=15和fontweight='bold'分别设置了标题的字体大小和加粗 ax[0].set_xlabel(column, fontsize=12) ax[0].set_ylabel('Frequency', fontsize=12) # 绘制箱线图 sns.boxplot(x=data[column], color='lightgreen', ax=ax[1]) ax[1].set_title(f'Box plot of {column}', fontsize=15, fontweight='bold') ax[1].set_xlabel(column, fontsize=12) file_path = os.path.join(desktop_path, f'{column}.jpg') plt.savefig(file_path, dpi=500) plt.tight_layout() # 自动调整子图参数 plt.show()
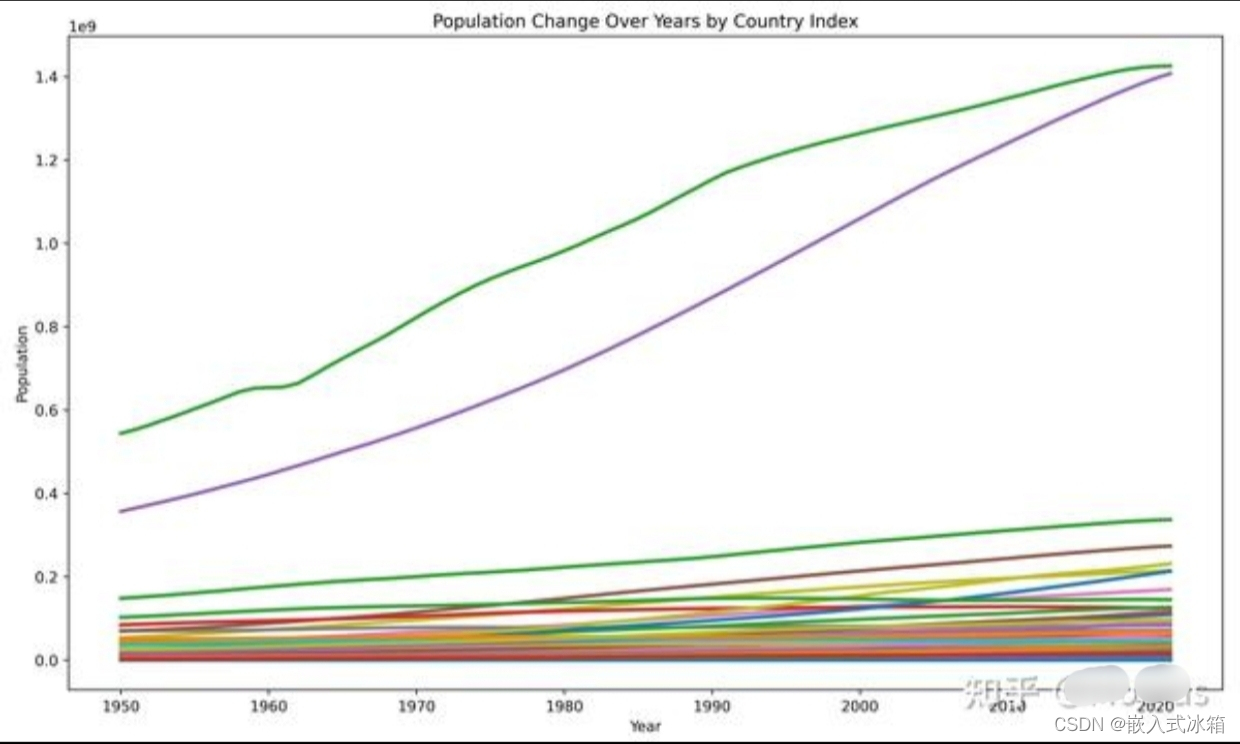
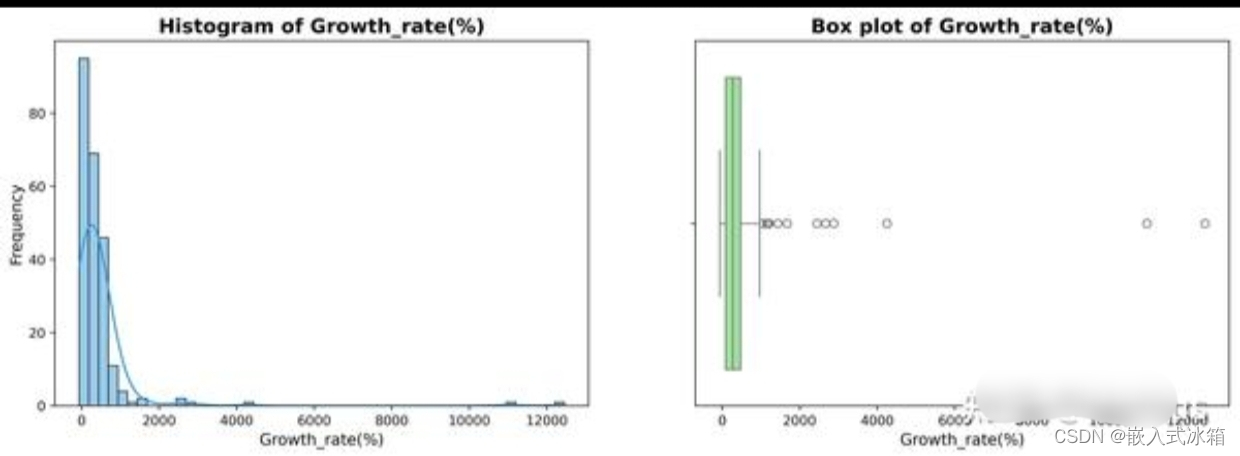
分别绘制人口增长率与人口增长数的统计直方图与箱线图:
plot_numerics(df_increase[['Growth_rate(%)', 'Population_change']])
 人口增长率
人口增长率
给出人口增长率最大的前 10 个国家和最小的后 10 个国家名单,人口增长数最多的前 10 个国家和最少的后 10 个国家名单:
# 编写函数,分别使用df.nlargest与df.nsmallest提取前10名和后10名行 def get_top_bottom_changes(df, column, top_n=10, bottom_n=10): top = df.nlargest(top_n, column) bottom = df.nsmallest(bottom_n, column) return top, bottom top10_population_change, bottom10_population_change = get_top_bottom_changes(df_increase, 'Population_change') top10_growth_rate, bottom10_growth_rate = get_top_bottom_changes(df_increase, 'Growth_rate(%)') # 创建字典 data = { 'Top 10 Population Change': top10_population_change['Country name_start'].tolist(), 'Bottom 10 Population Change': bottom10_population_change['Country name_start'].tolist(), 'Top 10 Growth Rate': top10_growth_rate['Country name_start'].tolist(), 'Bottom 10 Growth Rate': bottom10_growth_rate['Country name_start'].tolist() } # 转化为DataFrame df_result = pd.DataFrame(data) print(tabulate(df_result, headers='keys', tablefmt='pretty'))
得到的结果:
+---+--------------------------+-----------------------------+---------------------------+-----------------------+ | | Top 10 Population Change | Bottom 10 Population Change | Top 10 Growth Rate | Bottom 10 Growth Rate | +---+--------------------------+-----------------------------+---------------------------+-----------------------+ | 0 | India | Bulgaria | United Arab Emirates | Montserrat | | 1 | China | Latvia | Qatar | Niue | | 2 | Indonesia | Montserrat | Western Sahara | Bulgaria | | 3 | Pakistan | Niue | Sint Maarten (Dutch part) | Latvia | | 4 | United States | Saint Helena | Kuwait | Saint Kitts and Nevis | | 5 | Nigeria | Tokelau | Jordan | Saint Helena | | 6 | Brazil | Saint Kitts and Nevis | Djibouti | Hungary | | 7 | Bangladesh | Saint Pierre and Miquelon | Mayotte | Croatia | | 8 | Ethiopia | Falkland Islands | Andorra | Georgia | | 9 | Mexico | Cook Islands | French Guiana | Lithuania | +---+--------------------------+-----------------------------+---------------------------+-----------------------+
2.2 问题二
比较 2021 年不同国家的总人口数,绘制不同国家总人口数的柱状图:
plot_numerics(population_end['Population'])
得到的结果:
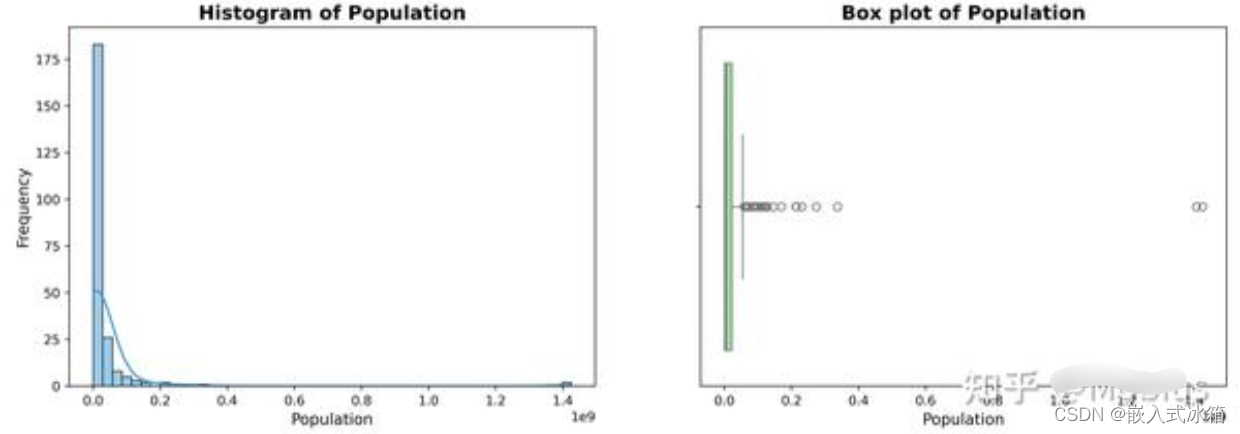
2021年各国人口数
给出总人口最多的前 10 个国家和最少的后 10 个国家名单,顺便绘制一下人口数量前十的国家的人口柱状图:
top10_population, bottom10_population = get_top_bottom_changes(population_end, 'Population') data2 = { 'Top 10 Countries by Population': top10_population['Country name'].tolist(), 'Bottom 10 Countries by Population': bottom10_population['Country name'].tolist(), 'Top 10 Population': top10_population['Population'].tolist(), 'Bottom 10 Population': bottom10_population['Population'].tolist(), } df_result2 = pd.DataFrame(data2) print(tabulate(df_result2, headers='keys', tablefmt='pretty')) # 绘制柱状图 plt.figure(figsize=(10, 6)) plt.bar(df_result2['Top 10 Countries by Population'], df_result2['Top 10 Population'], color='#3498db') plt.xlabel('Country') plt.ylabel('Population') plt.title('Top 10 Countries by Population') plt.xticks(rotation=45) plt.show()
得到的结果:+---+--------------------------------+-----------------------------------+-------------------+----------------------+ | | Top 10 Countries by Population | Bottom 10 Countries by Population | Top 10 Population | Bottom 10 Population | +---+--------------------------------+-----------------------------------+-------------------+----------------------+ | 0 | China | Tokelau | 1425893500 | 1869 | | 1 | India | Niue | 1407563900 | 1957 | | 2 | United States | Falkland Islands | 336997630 | 3786 | | 3 | Indonesia | Montserrat | 273753180 | 4438 | | 4 | Pakistan | Saint Helena | 231402110 | 5428 | | 5 | Brazil | Saint Pierre and Miquelon | 214326220 | 5905 | | 6 | Nigeria | Saint Barthelemy | 213401330 | 10888 | | 7 | Bangladesh | Tuvalu | 169356240 | 11229 | | 8 | Russia | Wallis and Futuna | 145102750 | 11654 | | 9 | Mexico | Nauru | 126705140 | 12533 | +---+--------------------------------+-----------------------------------+-------------------+----------------------+
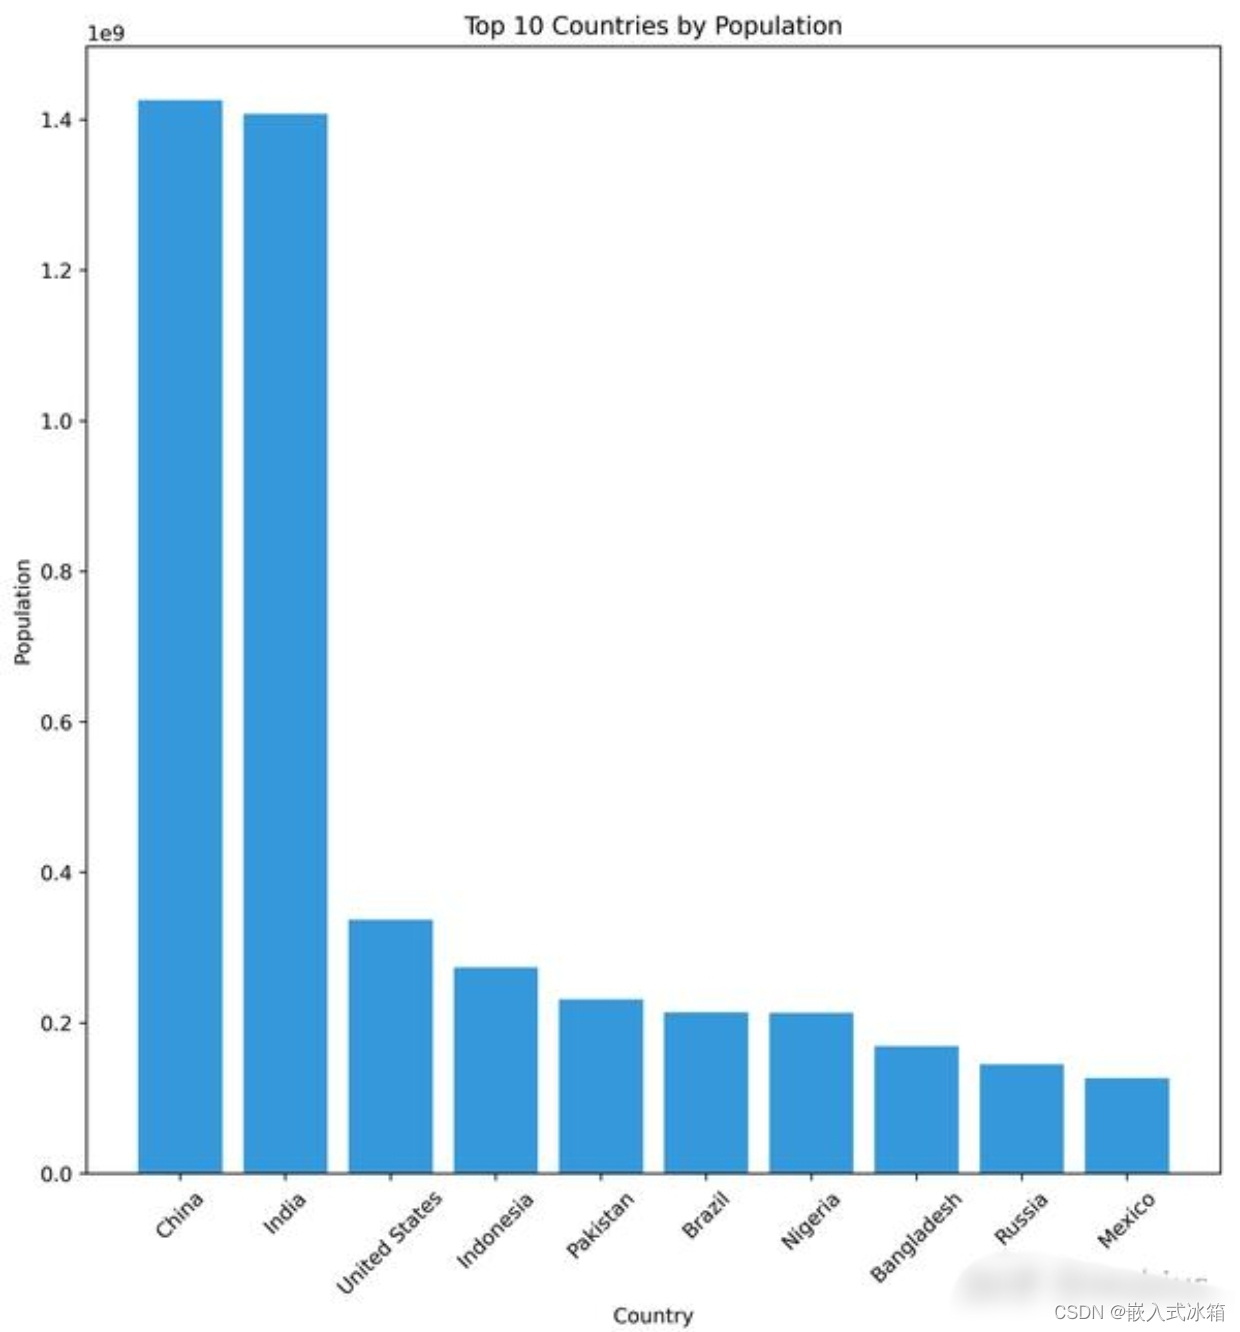 人口数量前十的国家的人口柱状图
2.3 问题三
任选三个国家,分别绘制不同年龄段人口的直方图。这里没有说是哪一年,因此默认2021年。先提取三个国家,这里以中国、日本与印度为例:select_country = ['China', 'Japan', 'India'] population_structure = population_end.copy() population_structure = population_structure[population_structure['Country name'].isin(select_country)] # 注意这里不需要取反运算符 print(tabulate(population_structure.head(), headers='keys', tablefmt='pretty'))
得到的结果:+------+--------------+------+------------+-------------------------------------------+-------------------------------------------+--------------------------------------------+--------------------------------+--------------------------------+--------------------------------+--------------------------------+---------------------+------------------------------+------------------------------+--------------------------------+--------------------------------+--------------------------------+--------------------------------+--------------------------------+--------------------------------+--------------------------------+--------------------------------+--------------------------------+--------------------------------+---------------------------------+-------+ | | Country name | Year | Population | Population of children under the age of 1 | Population of children under the age of 5 | Population of children under the age of 15 | Population under the age of 25 | Population aged 15 to 64 years | Population older than 15 years | Population older than 18 years | Population at age 1 | Population aged 1 to 4 years | Population aged 5 to 9 years | Population aged 10 to 14 years | Population aged 15 to 19 years | Population aged 20 to 29 years | Population aged 30 to 39 years | Population aged 40 to 49 years | Population aged 50 to 59 years | Population aged 60 to 69 years | Population aged 70 to 79 years | Population aged 80 to 89 years | Population aged 90 to 99 years | Population older than 100 years | index | +------+--------------+------+------------+-------------------------------------------+-------------------------------------------+--------------------------------------------+--------------------------------+--------------------------------+--------------------------------+--------------------------------+---------------------+------------------------------+------------------------------+--------------------------------+--------------------------------+--------------------------------+--------------------------------+--------------------------------+--------------------------------+--------------------------------+--------------------------------+--------------------------------+--------------------------------+---------------------------------+-------+ | 3239 | China | 2021 | 1425893500 | 11501936.0 | 74789700 | 251927890 | 412677800 | 986464100 | 1173924600 | 1125760900 | 13346962.0 | 63287764.0 | 90508240 | 86629944 | 79508270 | 174028860 | 229977170 | 204141890 | 228613400 | 144414740 | 80093240 | 29252108 | 3894913 | 40972.0 | 43 | | 7127 | India | 2021 | 1407563900 | 22600596.0 | 115307420 | 361569250 | 616154900 | 950245570 | 1045955200 | 969360640 | 22686848.0 | 92706830.0 | 120955410 | 125306400 | 128411740 | 246912060 | 218841600 | 174184980 | 131806584 | 89232770 | 41709948 | 13179305 | 1676180 | 39419.0 | 95 | | 7775 | Japan | 2021 | 124612530 | 823218.0 | 4286304 | 14671836 | 26309768 | 72822250 | 109808970 | 106518320 | 824993.0 | 3463086.0 | 5022209 | 5363323 | 5602191 | 12124980 | 13447597 | 17678772 | 16668259 | 15056484 | 16681042 | 9751401 | 2798243 | 131722.0 | 104 | +------+--------------+------+------------+-------------------------------------------+-------------------------------------------+--------------------------------------------+--------------------------------+--------------------------------+--------------------------------+--------------------------------+---------------------+------------------------------+------------------------------+--------------------------------+--------------------------------+--------------------------------+--------------------------------+--------------------------------+--------------------------------+--------------------------------+--------------------------------+--------------------------------+--------------------------------+---------------------------------+-------+
绘图:# 分别提取三个国家的数据 data1 = population_end[population_end['Country name'] == select_country[0]] data2 = population_end[population_end['Country name'] == select_country[1]] data3 = population_end[population_end['Country name'] == select_country[2]] color = ['red', 'green', 'blue'] # 准备柱状图横轴 age_groups = data1.columns[10:-1].tolist() # df.columns用于获取df这个DataFrame的列索引,这里转化为list是因为bar()方法只能获取两个列表(分别为String列表与int/float列表)作为输入。这里有效数据是第10列到倒数第二列 _ , axs = plt.subplots(3, 1, figsize=(10, 15)) for i, data in enumerate([data1, data2, data3]): ax = axs[i] ax.bar(age_groups, data.iloc[0,10:-1], color=color[i], alpha=0.5) # iloc方法使用整数的位置进行索引,而非列名或行索引。第一个数字0表示选择第一行;10:-1是一个切片,表示从第10列(不包括)到倒数第二列(包括)的所有列 ax.set_xlabel('Age Groups') ax.set_ylabel('Population') ax.set_title(f'{select_country[i]} Population Distribution by Age Groups') ax.set_xticks(range(len(age_groups))) if i == 2: # 只在最后一个子图中设置横轴标签的旋转角度 ax.set_xticklabels(age_groups, rotation=90) # # 调用每个子图轴对象 ax 的 set_xticklabels() 方法,刻度标签被设置为 age_groups 列表,rotation=90 参数将标签旋转90度 else: ax.set_xticklabels([]) # 其他子图不显示横轴标签 plt.tight_layout() plt.show()
得到的结果:
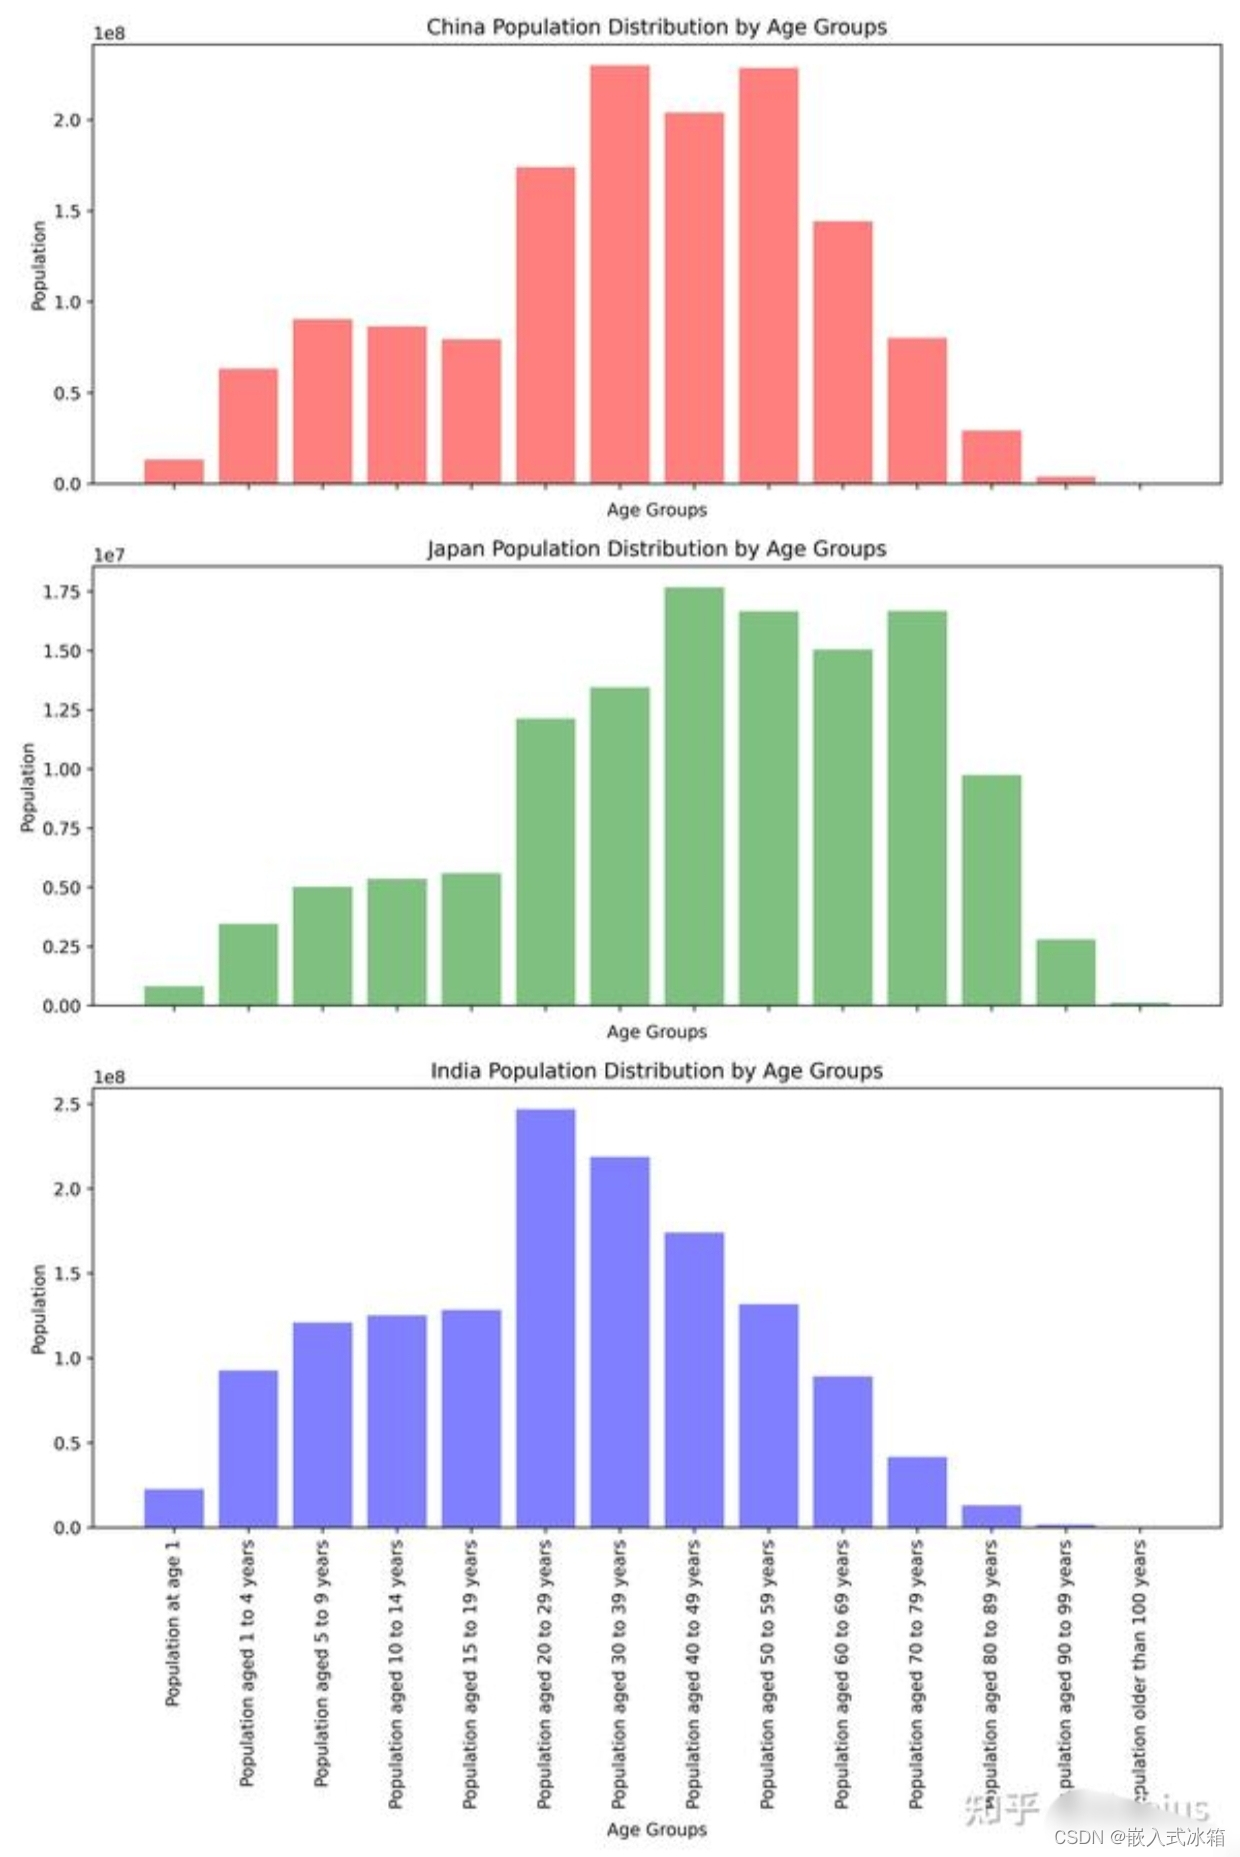
中国、日本与印度三国的人口结构
2024第三届全国大学生数据分析与统计大赛


 1284
1284

 被折叠的 条评论
为什么被折叠?
被折叠的 条评论
为什么被折叠?
 到【灌水乐园】发言


