


 博客介绍了动态和静态图表的写作模板,包括模板内容、记忆方法。还给出了多套真题演练,如不同年份的柱状图、表格图、饼状图等,分析了图表反映的现象,如员工工作满意度、学生兼职情况等,并探讨原因,预测趋势,强调政府和个人应合作改进。
目录
动态图表
模板一
What is clearly presented in the above 图表类型 is that dramatic changes have taken place in 主题词1 from 年份1 to 年份2.During the period, there was a marked jump from 数字1 to 数字2 in 事物1,while that of 事物2 declined significantly from 数字3 to 数字4.
The 图表类型 informs us of the phenomenon that people in mounting numbers 图表所示的内容(and I believe there are several fundamental factors to account for the above-mentioned changes).Primarily, with the rapid development of modern society which led by economy,快速发展的事物 has turned out to be a trend that anyone can not evade.Moreover, with the quickening pace of modern life and the fierce competition of society, people's values have changed gradually, more and more people chose to do something in order to do something.Finally, 快速发展的事物 is closely related to the reforming policy of our country.
Given all above arguments, it admits of no doubt that this tendency of 主题词2 will continue in the forthcoming years.The government and individuals should collaborate as much as possible to improve something and make the current social system more reasonable.Only with joint efforts, can these changes be made most use of.
译文:
上述图表类型清晰地反映出,从年份1到年份2这几年里,主题词1发生了显著地变化。在这一过程中,事物1从数字1迅速的增加到数字2,而事物2则从数字3迅速下降到数字4。
图表类型向我们揭示了这一现象:越来越多的人们图表所示的内容。(我认为有一些原因能够解释上述的变化。)首先,在以经济为主导的迅速发展的现代社会,快速发展的事物已经成为不可避免的趋势。并且,随着现代生活和社会的激烈竞争节奏的加快,人们的价值观也慢慢的发生了变化,越来越多的人选择___为了___。最后,快速发展的事物还与我们国家的改革政策有关系。
从以上我们的讨论来看,我们可以预测主题词2这一趋势在未来几年内仍将继续。政府和我们每个人都应该尽可能的合作来促进某事物,并且把当前的社会制度改进的更加合理。只有通过共同努力,我们才能最大限度地利用这些变化。
记忆方法一:先提炼记忆关键词和顺序,再扩写关键词
第一步:提炼关键词,结合记忆宫殿的记忆桩,可达到效果:按顺序默写出关键词。如下:
开始提炼关键字:
第一段:整体有变化,具体增加和下降。changes.jump,declined.
第二段:揭示现象,原因有经济、三观、政治。phenomenon.economy.value.policy.
第三段:预测继续,合作共赢。tendency.collaborate.system.joint.
接着有了关键字后,我们需要把它们记忆起来,而且还要按顺序记忆,这时候,我们就想到要用记忆宫殿,因为记忆宫殿的作用,就是利用物品本身和放置顺序,记忆内容,OKOK,那就开始啦,关键字是英文,换成中文后,变化,上升,下降,现象,经济,价值,政策改革,趋势,合作,制度,共同。到这里后,我们不妨换个角度,利用关键字的特点找记忆桩,寻找日常生活中,哪些场景具有上述关键字的特点,同时根据记忆桩/场景去调整关键字。
变化,上升,下降。 现象,经济,价值,政策改革。 趋势,合作,制度,共同。啥场景可以包裹住这几个玩意,
尝试例1:股票,一支股票,变化莫测,一上一下,这个现象,由当前经济的价值改变着,要适应这个趋势,我们需要合作,按制度共同努力。
第二步:围绕关键字,进行扩写
第一句:上述图表类型清晰地反映出,从年份1到年份2这几年里,主题词1发生了显著地变化。在这一过程中,事物1从数字1迅速的增加到数字2,而事物2则从数字3迅速下降到数字4。=几年之间,显著变化,她嫁到这,他下到那。
第二句: 图表类型向我们揭示了这一现象:越来越多的人们图表所示的内容。(我认为有一些原因能够解释上述的变化。)首先,在以经济为主导的迅速发展的现代社会,快速发展的事物已经成为不可避免的趋势。并且,随着现代生活和社会的激烈竞争节奏的加快,人们的价值观也慢慢的发生了变化,越来越多的人选择___为了___。最后,快速发展的事物还与我们国家的改革政策有关系。=揭示现象,经济为导,激烈竞争,ta价值变化。
第三句:从以上我们的讨论来看,我们可以预测主题词2这一趋势在未来几年内仍将继续。政府和我们每个人都应该尽可能的合作来促进某事物,并且把当前的社会制度改进的更加合理。只有通过共同努力,我们才能最大限度地利用这些变化。=预测继续,合作促进,制度合理,利用变化。
记忆方法二:每句的关键字进行影像化,再汇总成一个大影像。参照
总所周知,苏联解散于1991年,而苏联经济与石油挂钩很强,苏联解散的时候,也正是石油价格低谷的时候。苏联就是一个变化的集体,一开始上升,后面下降。一开始经济收到影响,后面人们信仰(价值观)崩,最后,进行了改革。对于我们要团结,变得合理。
模板二
①Remarkable changes concerning 主题词 have been witnessed in recent years. ②The above 图表类型 thoroughly revealed the (thorny/fascinating/marvelous/hateful/troublesome) issue.③One can see that in年份1,事物1 was only 数字1.④But within a short duration of X years,事物1 (bumped to/ascended toldropped to) 数字2 in 年份2.⑤(Apart from that/Contrary to that),事物2 has enjoyed a (slight/fast) (decline/growth) during the same years,(shrinking/rising) from 数字3 to 数字4.(⑥若有事物3:As for事物3, it remained stable at 数字5.或 What's more,事物3(ascended/descended)(enormously/sharplyldramatically/slowly/slightly) from 数字5 in 年份1 to 数字6 in 年份2.)
(总起句)①When it comes to specific reasons that account for the development of the phenomenon of 主题词, a careful and serious discussion should be encouraged.(经济)②First and foremost, the 主题词 comes into existence along with the vigorous development of China's economy.③Increasing numbers of(people/students) tend to pay more attention to the 主题词 with the cultural and financial prosperity brought upon themselves due to economic and social development.(科技)④Additionally, we are immersed in an information-sharing environment in which the rapiddevelopment of Internet technology has promoted the popularity of 主题词.(文化)⑤Furthermore, (peoplelstudents) from (various industries/different colleges) have been closely connected.⑥Thus, the phenomenon of 主题词 is likely to be spread among them, as a kind of popularculture.(政治)⑦Due to the highly-competitive social atmosphere in China, the existing social system fails to effectively control 主题词 phenomenon/the curent social system has effectively promoted the phenomenonof 主题词)
①Apparently,主题词 has played a quite significant role in (our life/social development) and yet it hasfavorable and adverse functions.l suggest that the government, the media and all the public should figure out specific ways to (solve/improve) the phenomenon of 主题词 through adopting the right approach and abandoning the dross.③lt's fairly convincing that the tendency of主题词 will (continue to develop/be reasonably regulated) inthe next few years.
翻译∶
①近些年,主题词的显著变化已被见证。②上述图表类型完全反映了这个(讽刺/有趣惊人令人讨厌/麻烦)的现象。③你可以看到,事物1在年份1仅为数字1。④但是在短短的X年里,在年份2,事物1就急剧(上升至下挫至)数字2。⑤(此外/相反的是),事物2在此段时间内经历了(缓慢/快速)的(下降/上升)期,从数字3变为数字4。(⑥若有事物3∶至于事物3,一直保持稳定在数字5。或:至于事物3,从年份1的数字5(急剧/缓慢x增长/下跌)到年份2的数字6。)
(总起句)①提及导致关键词现象发展的原因,必须开展一个认真而严肃的讨论。(经济)②首先,主题词现象是伴随着中国经济的蓬勃发展出现的。③随着经济社会发展带来的文化和财富的繁荣,越来越多的(人/学生)开始关注主题词问题。(科技)④此外,我们生活在一个信息共享的环境中,其快速发展的互联网技术大力推动了主题词现象的大范围流行。(文化)⑤此外,(各行业各个院校)的(人/学生)之间有着密切的联系。⑥所以,主题词现象的出现,就像一种流行文化,也很容易在他们之间传播。((政治⑦高度竞争的社会氛围,使得社会制度并不能有效约束主题词现象/目前的社会制度有效地推动了主颗词现象。)
①很明显,主题词现象的出现在(我们的生活/社会发展)中起到了非常重要的作用,并且其作用具有双面性。②我建议政府和媒体主导,全民参与,通过取其精华弃其糟粕的方式设法(解决/改进)主题词现象。③我坚信主题词的趋势在未来几年中会(继续发展/被合理得管制)。
2010年真题演练-column chart
目的:好用自然会更想记忆啦
第一步:找出关键信息
主题类型:动态图类
图表类型:column chart (柱状图)
主题词1:domestic car market share of different brands(不同品牌的国内汽车市场占有率)
主题词2:increasing sales of domestic cars(增加国产车销量)
第二步:套入模板中
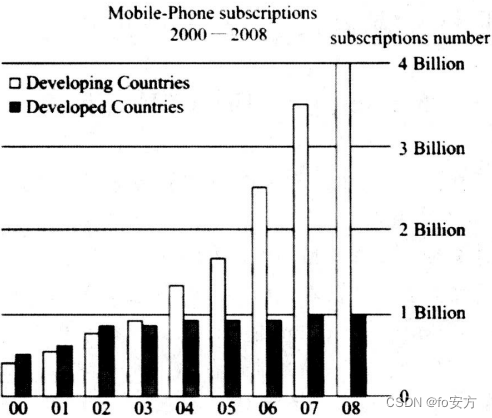
What is clearly presented in the above column chart is that dramatic changes have taken place in mobile-phone subscriptions in developing and developed countries from 2000 to 2008.During the period, there was a marked jump from less than 1 billion to 4 billion in developing countries,while that of mobile-phone subscriptions in developed countries climbed slightly from less than 1 billion to the maximum at 1 billion.
The column chart informs us of the phenomenon that people in mounting numbers subscribe mobile-phone in developing countries (and I believe there are several fundamental factors toaccount for the above-mentioned changes).Primarily,with the rapid development of modern society which led by economy,mobile-phone subscriptions have turned out to be a trend that anyone cannot evade. Moreover,with the quickening pace of modern life and the fierce competition of society, people's values have changed gradually, more and more people chose touse mobile-phone in order to keep up with the outside world. Finally, the widesoread subscriptions of mobile- phone is closely related to the reforming policy of our country.
Given all above arguments,it admits of no doubt that this tendency of increasing mobile-phone subscriptions in developing countries will continue in the forthcoming years. The government and individuals should collaborate as much as possible to improve this industry and make the current social system more reasonable.Only with joint efforts,can these changes bemade most use of.
译文;
上述柱状图清晰地反映出,从2000到2008这几年里,发达国家和发展中国家的手机购买量发生了显著地变化。在这一过程中,发展中国家的手机购买量从不到10亿迅速的增加到40亿,而发达国家的手机购买量则从不到10亿缓慢增长到最多的10亿。
柱状图向我们揭示了这一现象:越来越多的发展中国家的人们使用手机。(我认为有一些原因能够解释上述的变化。)首先,在以经济为主导的迅速发展的现代社会,使用手机已经成为不可避免的趋势。并且,随着现代生活和社会的激烈竞争节奏的加快,人们的价值观也慢慢的发生了变化,越来越多的人选择用手机来保持与外界的同步。最后,手机的广泛普及还与我们国家的改革政策有关系。
从以上我们的讨论来看,我们可以预测手机购买量不断增加这一趋势在未来几年内仍将继续。政府和我们每个人都应该尽可能的合作来促进这一产业,并且把当前的社会制度改进的更加合理。只有通过共同努力,我们才能最大限度地利用这些变化。
2011年真题演练-column chart
第一步:找出关键信息
主题类型:动态图类
图表类型:column chart (柱状图)
主题词1:domestic car market share of different brands(不同品牌的国内汽车市场占有率)
主题词2:increasing sales of domestic cars(增加国产车销量)
备注:文章中括号里的内容可要可不要,根据自己文章字数来确定。
第二步:套入模板中
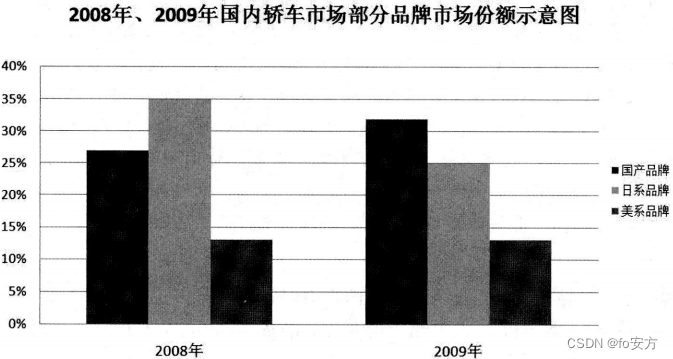
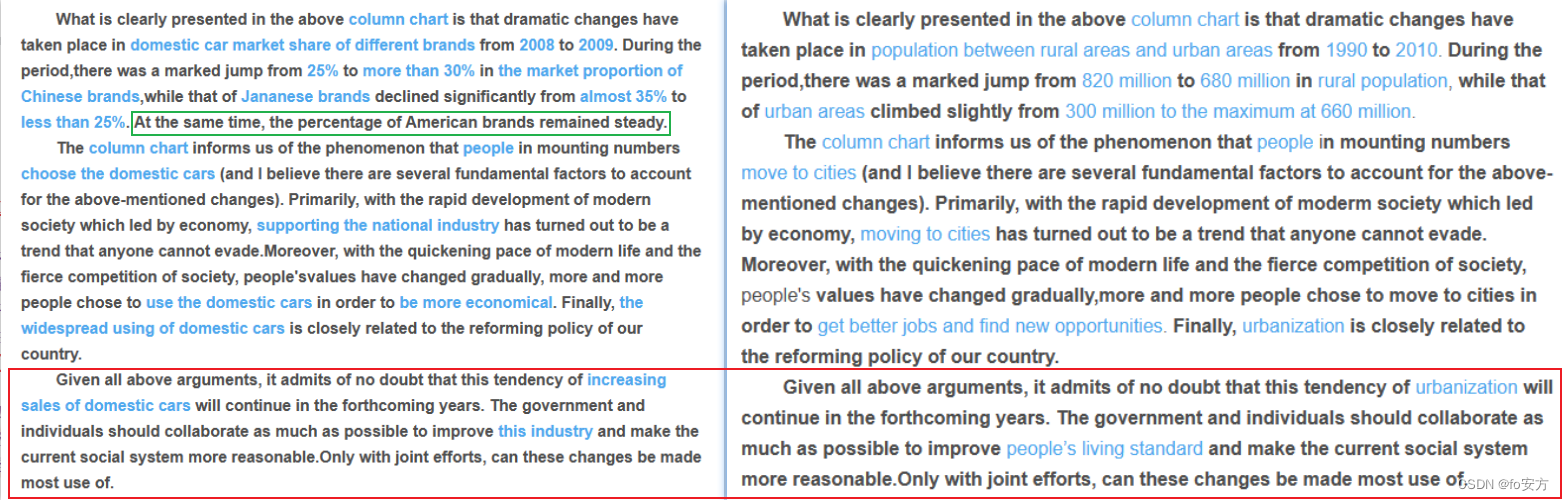
What is clearly presented in the above column chart is that dramatic changes have taken place in domestic car market share of different brands from 2008 to 2009. During the period,there was a marked jump from 25% to more than 30% in the market proportion of Chinese brands,while that of Jananese brands declined significantly from almost 35% to less than 25%. At the same time, the percentage of American brands remained steady.
The column chart informs us of the phenomenon that people in mounting numbers choose the domestic cars (and I believe there are several fundamental factors to account for the above-mentioned changes). Primarily, with the rapid development of modern society which led by economy, supporting the national industry has turned out to be a trend that anyone cannot evade.Moreover, with the quickening pace of modern life and the fierce competition of society, people'svalues have changed gradually, more and more people chose to use the domestic cars in order to be more economical. Finally, the widespread using of domestic cars is closely related to the reforming policy of our country.
Given all above arguments, it admits of no doubt that this tendency of increasing sales of domestic cars will continue in the forthcoming years. The government and individuals should collaborate as much as possible to improve this industry and make the current social system more reasonable.Only with joint efforts, can these changes be made most use of.
译文:
上述柱状图清晰地反映出,从2008到2009这几年里,国内轿车市场不同品牌的市场份额发生了显著地变化。在这一过程中, 国内品牌的份额从25%迅速的增加到超过30%,而日本品牌的份额则从将近35%迅速下降到不到25%。同时,美国品牌的份额几乎保持不变。
柱状图向我们揭示了这一现象:越来越多的人们选择国产轿车。(我认为有一些原因能够解释上述的变化。)首先,在以经济为主导的迅速发展的现代社会,支持民族工业已经成为不可避免的趋势。并且,随着现代生活和社会的激烈竞争节奏的加快,人们的价值观也慢慢的发生了变化,越来越多的人选择使用国产轿车为了更经济。最后,国产轿车的广泛普及还与我们国家的改革政策有关系。
从以上我们的讨论来看,我们可以预测国产轿车销售数量的不断增长这一趋势在未来几年内仍将继续。政府和我们每个人都应该尽可能的合作来促进这一产业,并且把当前的社会制度改进的更加合理。只有通过共同努力,我们才能最大限度地利用这些变化。
2014年真题演练-column chart
第一步:找出关键信息
模板一:
主题类型:动态图类
图表类型:column chart (柱状图)
主题词1:population between rural areas and urban areas(城乡人口)
主题词2:urbanization(城市化)
备注:文章中括号里的内容可要可不要,根据自己文章字数来确定。
模板二:
图表类型:column chart(柱状图)
主题词1:population in urban areas and rural areas(城市人口和农村人口)
主题词2:moving to cities(移民城市)(可替换为:immigrating to cities)
事物1:the urban population(城镇人口)
事物2:the rural population(乡村人口)
第二步:套入模板中
模板一:
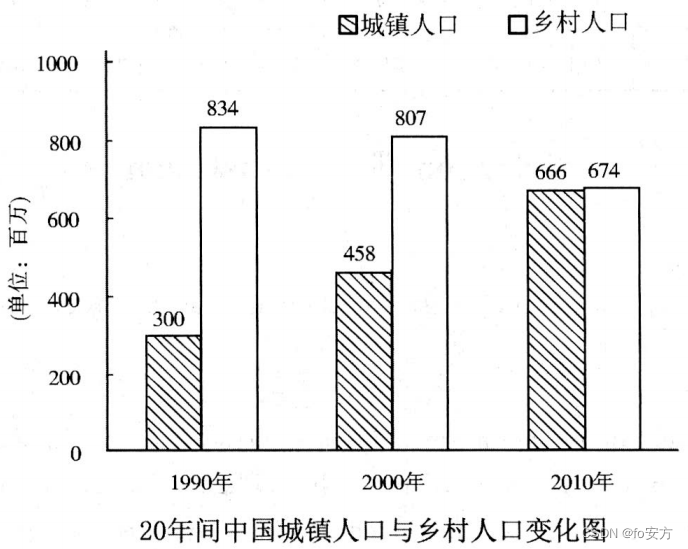
What is clearly presented in the above column chart is that dramatic changes have taken place in population between rural areas and urban areas from 1990 to 2010. During the period,there was a marked jump from 820 million to 680 million in rural population, while that of urban areas climbed slightly from 300 million to the maximum at 660 million.
The column chart informs us of the phenomenon that people in mounting numbers move to cities (and I believe there are several fundamental factors to account for the above-mentioned changes). Primarily, with the rapid development of moderm society which led by economy, moving to cities has turned out to be a trend that anyone cannot evade. Moreover, with the quickening pace of modern life and the fierce competition of society, people's values have changed gradually,more and more people chose to move to cities in order to get better jobs and find new opportunities. Finally, urbanization is closely related to the reforming policy of our country.
Given all above arguments, it admits of no doubt that this tendency of urbanization will
continue in the forthcoming years. The government and individuals should collaborate as much as possible to improve people’s living standard and make the current social system more reasonable.Only with joint efforts, can these changes be made most use of.
译文:
上述柱状图清晰地反映出,从1990到2010这几年里,农村和城市的人口发生了显著地变化。在这一过程中,农村人口从8.2亿迅速地减少到6.8亿,而城市人口则从3亿缓慢增长到最多的6.6亿。
柱状图向我们揭示了这一现象:越来越多的人们通向城市。(我认为有一些原因能够解释上述的变化。)首先,在以经济为主导的迅速发展的现代社会,到城市里去已经成为不可避免的趋势。并且,随着现代生活和社会的激烈竞争节奏的加快,在工作和生存双重压力下,人们的价值观也慢慢的发生了变化,越来越多的人选择到城市中来获得更好的工作和寻找新的机会。最后,城镇化还与我们国家的改革政策有关系。
从以上我们的讨论来看,我们可以预测城镇化这一趋势在未来几年内仍将继续。政府和我们每个人都应该尽可能的合作来促进人们的生活水平,并且把当前的社会制度改进的更加合理。只有通过共同努力,我们才能最大限度地利用这些变化。
静态图表
模板一(和动态图表只有第一段有区别)
What is clearly presented in the above 图表类型 is the statistics of 主题词1.The proportion of 事物1 accounts for 百分比1, ranking the first.The percentage of 事物2 ranks second among all, making up 百分比2.事物3 occupies 百分比3,ranking third.As for 事物4,we can find that it takes up 百分比4,lower than that of 比事物4占比大的任意事物.
The 图表类型 informs us of the phenomenon that people in mounting numbers 图表所示的内容(and I believe there are several fundamental factors to account for the above-mentioned changes).Primarily, with the rapid development of modern society which led by economy,快速发展的事物 has turned out to be a trend that anyone can not evade.Moreover, with the quickening pace of modern life and the fierce competition of society, people's values have changed gradually, more and more people chose to do something in order to do something.Finally, 快速发展的事物 is closely related to the reforming policy of our country.
Given all above arguments, it admits of no doubt that this tendency of 主题词2 will continue in the forthcoming years.The government and individuals should collaborate as much as possible to improve something and make the current social system more reasonable.Only with joint efforts, can these changes be made most use of.
译文:
从上述图表类型中我们能够清晰地得知有关主题词 1的数据。事物1的比例为百分之 1,为第一。事物 2 排第二,占比百分之 2。至于事物 4,我们发现它占了百分之 4,比其他事物占比小。
图表类型向我们揭示了这一现象:越来越多的人们图表所示的内容。(我认为有一些原因能够解释上述的变化。)首先,在以经济为主导的迅速发展的现代社会,快速发展的事物已经成为不可避免的趋势。并且,随着现代生活和社会的激烈竞争节奏的加快,人们的价值观也慢慢的发生了变化,越来越多的人选择___为了___。最后,快速发展的事物还与我们国家的改革政策有关系。
从以上我们的讨论来看,我们可以预测主题词 2这一趋势在未来几年内仍将继续。政府和我们每个人都应该尽可能的合作来促进某事物,并且把当前的社会制度改进的更加合理。只有通过共同努力,我们才能最大限度地利用这些变化。
2012年真题演练-table graph
第一步:找出关键信息
主题类型:静态图类
图表类型:table graph(表格)
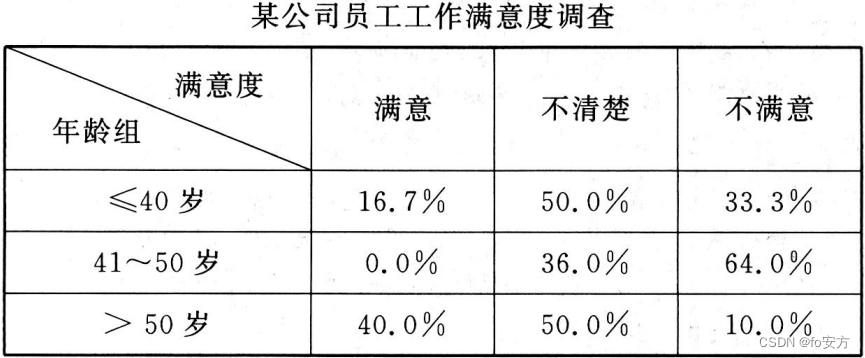
主题词1:staffs job satisfaction in a certain company.(某公司员工的工作满意度)
主题词2:the majority of staff between 40 and 50 are not satisfied with their work.(大多数40到50岁的员工对自己的工作不满意)
第二步:套入模板中
What is clearly presented in the above table graph is the statistics of staff's job satisfaction in a certain company. The proportion of people between 40 and 50 years old who are not content with their work accounts for 64%,ranking the first. The percentage of people less than 40 years old who are unsatisfied with their work ranks second among all, making up 33.3%. People over 50 years old who are not content with their work occupies 10%, ranking third.
The table graph informs us of the phenomenon that people in mounting numbers between 40 and 50 years old are not satisfied with their jobs (and I believe there are several fundamental factors to account for the above-mentioned changes). Primarily,with the rapid development of modern society which led by economy, working overtime has turned out to be a trend that anyone cannot evade. Moreover,with the quickening pace of modern life and the fierce competition ofsociety, people's values have changed gradually, more and more people between 40 and 50 have to be confronted with much stress. Finally, the phenomenon is closely related to the reforming policyof our country .
Given all above arguments, it admits of no doubt that this tendency of the majority of staff between 40 and 50 are not satisfied with their work will continue in the forthcoming years. The government and individuals should collaborate as much as possible to improve job satisfaction and make the current social system more reasonable.Only with joint efforts, can these changes be made most use of.
译文:
从上述表格中我们能够清晰地得知有关某公司不同年龄段员工满意度的数据。在40到50岁的员工中,对工作不满意的员工的比例为64%,为第一。在不到40岁的员工中,对工作不满意的员工比例排第二,占比33.3%。在超过50岁的员工中,对工作不满意的员工占了10%,排第三。
表格向我们揭示了这一现象:越来越多的中年人对工作不满意。(我认为有一些原因能够解释上述的变化。)首先,在以经济为主导的迅速发展的现代社会,中年人选择加班已经成为不可避免的趋势。并且,随着现代生活和社会的激烈竞争节奏的加快,人们的价值观也慢慢的发生了变化,越来越多的中年人面对的压力越来越大。最后,这一现象还与我们国家的改革政策有关系。
从以上我们的讨论来看,我们可以预测大多数中年人对工作不满意这一趋势在未来几年内仍将继续。政府和我们每个人都应该尽可能的合作来提高工作满意度,并且把当前的社会制度改进的更加合理。只有通过共同努力,我们才能最大限度地利用这些变化。
2013年真题演练-column chart
第一步:找出关键信息
主题类型:静态图类
图表类型:column chart(柱状图)
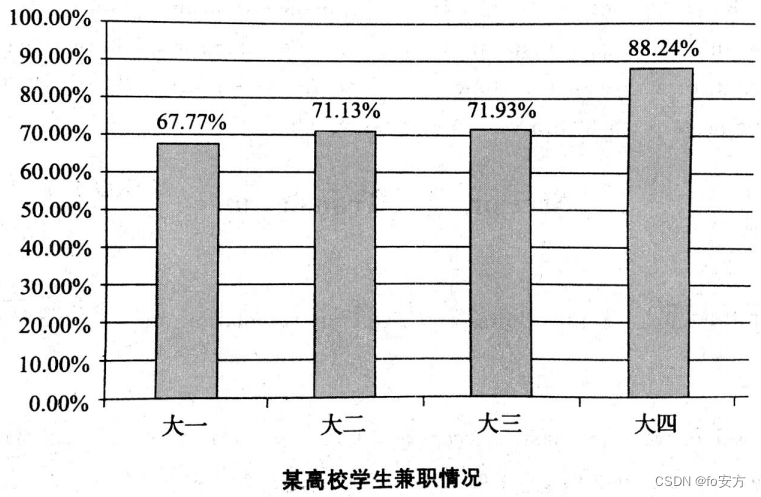
主题词1:students' taking part-time job from different grades(不同年级的学生从事兼职工作)
主题词2:the majority of senior students take part-time jobs(大多数高年级学生从事兼职工作)
第二步:套入模板中
What is clearly presented in the above column chart is the statistics of students’taking part-time job from different grades.The proportion of senior students taking part-time job saccounts for 88.24%,ranking the first.The percentage of junior students taking part-time jobs ranks second among all, making up 71.93%.Sophomore students taking part-time jobs occupies 71.73%, ranking third.As for freshmen, we can find that it takes up less than 70%,lower than that of the rest three grades students.
The column chart informs us of the phenomenon that students in mounting numbers take part-time jobs (and I believe there are several fundamental factors to account for theabove mentioned changes). Primarily, with the rapid development of modern society which led by economy,improving the ability to work has turned out to be a trend that anyone cannot evade.Moreover, with the quickening pace of modern life and the fierce competition of society, students'values have changed gradually, more and more students chose to take part-time jobs in order togain working_experience.Finally, this phenomenon is closely related to the reforming policy of our country.
Given all above arguments, it admits of no doubt that this tendency of the maiority of senior students take part-time jobs will continue in the forthcoming years.The government and individuals should collaborate as much as possible to improve students’ability to work and make the current social system more reasonable. Only with joint efforts, can these changes be made most use of.
译文:
从上述柱状图中我们能够清晰地得知有关不同年级学生做兼职的情况的数据。做兼职的大四学生的比例为88.24%,为第一。做兼职的大三学生排第二,占比71.93%。做兼职的大二学生占了71.13%,排第三。至于大一新生,我们发现它占了不到70%,比其他年级学生占比小。
柱状图向我们揭示了这一现象:越来越多的学生做兼职。(我认为有一些原因能够解释上述的变化。)首先,在以经济为主导的迅速发展的现代社会,提高工作能力已经成为不可避免的趋势。并且,随着现代生活和社会的激烈竞争节奏的加快,学生的价值观也慢慢的发生了变化,越来越多的学生选择做兼职来获得工作经验。最后,这一现象还与我们国家的改革政策有关系。
从以上我们的讨论来看,我们可以预测大多数高年级学生做兼职这一趋势在未来几年内仍将继续。政府和我们每个人都应该尽可能的合作来提高学生们的工作能力,并且把当前的社会制度改进的更加合理。只有通过共同努力,我们才能最大限度地利用这些变化。
2015年真题练习-pie chart
第一步:找出关键信息
主题类型:静态图类
图表类型:pie chart(饼状图)
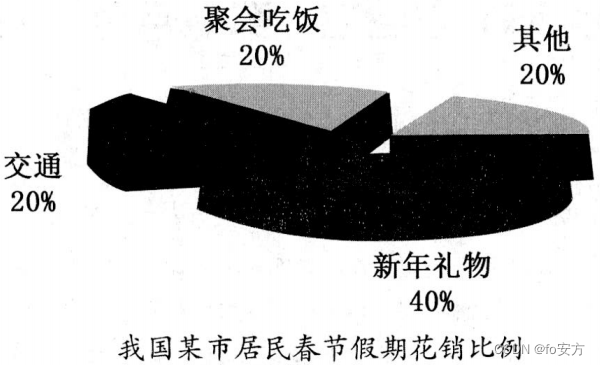
主题词1:consumptions during Spring Festival(春节花销)——直译标题
主题词2:presenting New Year Gifts(新年送礼)
事物1:expenditure for New Year Gifts(新年礼物花销)
事物2:expenditures for transportations and dinner parties(交通和聚餐的花销)
事物3:other expenditures(其他花销)
常用用到句式:
第二步:套入模板中
2016年真题练习-pie chart
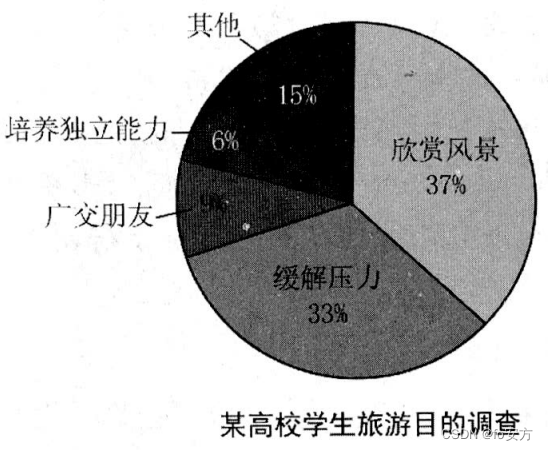
第一步:找出关键信息
主题类型:静态图类
图表类型:pie chart(饼状图)
主题词1:the purposes for traveling of the college students(高校学生旅游目的)——直译标题
主题词2:tour for the purpose of entertainment(以休闲娱乐为目的的旅游)
事物1:enjoy ing the scenery(欣赏风景)
事物2:relieving stress(缓解压力)
事物3:making friends and developing independent capabilities(广交朋友和培养独立能力)
第二步:套入模板中


 被折叠的 条评论
为什么被折叠?
被折叠的 条评论
为什么被折叠?
 到【灌水乐园】发言


