


According to Wikipedia, the activation function of a node defines the output of that node given an input or set of inputs in terms of an artificial neural network. A standard integrated circuit can be seen as a digital network of activation functions that can be “ON” (1) or “OFF” (0), depending on the input.
根据Wikipedia的介绍 ,节点的激活功能根据人工神经网络在给定一个输入或一组输入的情况下定义该节点的输出。 可以将标准集成电路视为激活功能的数字网络,根据输入的不同,激活功能可以为“ ON”(1)或“ OFF”(0)。
There are different types of activation functions
有不同类型的激活功能
· Binary Step · Linear · Sigmoid · Tanh · ReLU · Leaky ReLU · Parameterised ReLU· Exponential Linear Unit· Swish · Softmax
·二进制步骤·线性·Sigmoid·Tanh·ReLU·Leaky ReLU·参数化的ReLU·指数线性单位·摆动·Softmax
Today, we will discuss more on the common type of activation, sigmoid function.
今天,我们将讨论更多有关激活的常见类型,S型函数。
What is the Sigmoid Function?
什么是Sigmoid函数?
The sigmoid function is a mathematical function having a characteristic “S” — shaped curve, which transforms the values between the range 0 and 1. The sigmoid function also called the sigmoidal curve or logistic function. It is one of the most widely used non- linear activation function.
S形函数是具有特征“ S”形曲线的数学函数,该曲线在0到1范围内转换值。S形函数也称为S形曲线或逻辑函数。 它是使用最广泛的非线性激活函数之一。
The mathematical expression for sigmoid:
乙状结肠的数学表达式:

Graph
图形

In the above graph, if the value of x goes to positive infinity then the predicted value of y will become 1 and if it goes to negative infinity then the predicted value of y will become 0.
在上图中,如果x的值变为正无穷大,则y的预测值将变为1;如果x的值变为负无穷大,则y的预测值将变为0。
I assume you know the logistic regression, which is the common algorithm used for binary classification or when the value of the target variable is categorical in nature. Logit function or sigmoid is used to predict the probabilities of a binary outcome. For example, we use logistic regression for classification in spam detection, fraud detection etc.
我假设您知道逻辑回归,这是用于二进制分类或目标变量的值本质上是分类的常用算法。 Logit函数或S型曲线用于预测二进制结果的概率。 例如,我们在垃圾邮件检测,欺诈检测等中使用逻辑回归进行分类。
Let’s walk through one of the examples of implementing Logistic Regression in Python.
让我们来看一下在Python中实现Logistic回归的示例之一。
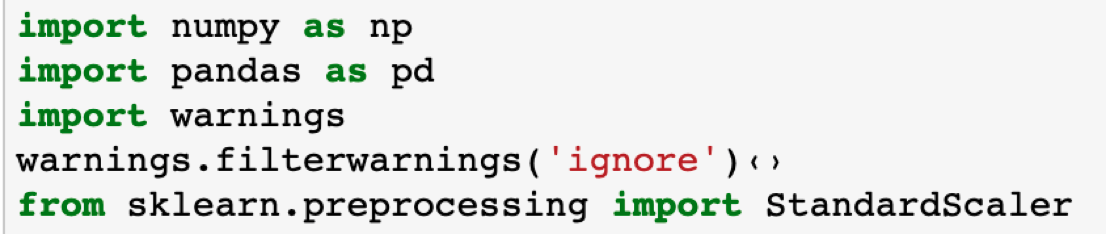
First, we have to import the required libraries.
首先,我们必须导入所需的库。
let’s load the dataset, today we are going to use with some doctors on heart attack patients. We copied the data from here to the excel sheet.
让我们加载数据集,今天我们将与一些医生一起对心脏病发作的患者使用。 我们将数据从此处复制到Excel工作表。
Our target is to predict whether the patient will have had a second heart attack within 1 year (yes = 1). We have two independent variables; one is whether the patient completed a treatment consisting of anger control practices (yes=1). The other IV is a score on a trait anxiety scale (a higher score means more anxious).
我们的目标是预测患者是否会在1年内再次心脏病发作(是= 1)。 我们有两个自变量; 一个是患者是否完成了由愤怒控制措施组成的治疗(是= 1)。 另一个IV是在特质焦虑量表上的得分(得分越高表示越焦虑)。

I assume you do have a basic understanding of training the datasets. Now, we will use the “train_test_split” function in Scikit-learn to split the data into training and testing sections.
我假设您确实对训练数据集有基本的了解。 现在,我们将使用Scikit-learn中的“ train_test_split”函数将数据分为训练和测试部分。
We have used the StandardScaler from Scikit-Learn to rescale the data which brings values that may have extremely different ranges or units.
我们使用了Scikit-Learn提供的StandardScaler来重新缩放数据,从而带来的值可能具有截然不同的范围或单位。

Now, we’ll import the logistic regression algorithm from sci-kit-learn and feed into the logistic regression and then create an instance of the classifier and fit it to the training data.
现在,我们将从sci-kit-learn中导入逻辑回归算法,并将其输入到逻辑回归中,然后创建分类器的实例并将其拟合到训练数据中。

Once we train and fit the data, we will be able to see the coefficient and intercept for the respective variable.
训练并拟合数据后,我们将能够看到相应变量的系数并进行拦截。


Below is the z (equation) in the sigmoid function with respective coefficient and intercept.
下面是S型函数中的z(等式),具有各自的系数和截距。

Calculation of z for the different variable for the test data using an equation from above.
使用上面的公式为测试数据的不同变量计算z。

Even, we can get the decision function or z, we calculated above with the decision function from the logistic_clf variable.
甚至我们可以通过上面的logistic_clf变量中的决策函数来获得决策函数或z。

We will define the sigmoid function as below.
我们将如下定义S形函数。

We already know that sigmoid function will convert real value between 0 and 1. We can test that scenario with this function with our calculated z or decision function. For example, we calculated z1 as -1.061 which is not between 0 and 1. Below we can see it was converted to 0.052.
我们已经知道sigmoid函数将在0到1之间转换实际值。我们可以使用计算出的z或决策函数使用此函数测试该场景。 例如,我们将z1计算为-1.061,它不在0到1之间。下面我们可以看到将其转换为0.052。

Else, we can use predict_prob class:
否则,我们可以使用predict_prob类:

Here, we use the sigmoid or logit function to map predicted values to probabilities. The functions will map any real value into another value which will be between 0 and 1 or in other word predictions to probabilities.
在这里,我们使用S形或logit函数将预测值映射到概率。 这些函数会将任何实数值映射到另一个介于0和1之间的值,或者换句话说,将其预测为概率。
Decision boundary
决策边界
What after the conversion to probabilities value, from our sigmoid function? To map the binary class, we will decide some threshold value, which varies on the use case, to classify the values into two different categories. The common threshold is 0.5.
从我们的S型函数转换为概率值后会怎样? 为了映射二进制类,我们将确定一些阈值,该阈值根据使用情况而有所不同,以将这些值分为两个不同的类别。 通用阈值为0.5。


Making Predictions
做出预测
Using our knowledge of sigmoid functions and decision boundaries, we can now write a prediction function. A prediction function in logistic regression returns the probability of our observation being positive, True, or “Yes”.
利用我们对S形函数和决策边界的了解,我们现在可以编写一个预测函数。 Logistic回归中的预测函数返回我们观察到的值为正,真或“是”的概率。
For example, if our threshold was .5 and our prediction function returned .7, we would classify the observation as a person will have a 2nd heart attack with a 70% chance. If our prediction was .2 we would classify the observation as a person will have a 2nd heart attack with a 20% chance. As the probability gets closer to 1, our model is more confident that the observation being positive.
例如,如果我们的阈值为0.5,而我们的预测函数返回了0.7,则我们会将观察结果归类为一个人发生第二次心脏病的机会为70%。 如果我们的预测值为.2,我们会将观察结果分类为一个人发生第二次心脏病的机会为20%。 当概率接近1时,我们的模型会更确信观察结果为正。
Now, you are able to understand how sigmoid function been used in logistic regression and also some math behind it. If you have some comment or feedback, please feel free to comment. Thank you for reading!
现在,您可以了解在逻辑回归中如何使用S型函数以及其背后的一些数学运算。 如果您有任何意见或反馈,请随时发表评论。 感谢您的阅读!


 8522
8522

 被折叠的 条评论
为什么被折叠?
被折叠的 条评论
为什么被折叠?
 到【灌水乐园】发言


