


 本文介绍了如何在Azure平台上训练一个简单的神经网络模型,详细步骤包括数据准备、模型构建及训练过程。
azure模型训练
Although neural networks are widely known for use in deep learning and modeling complex problems such as image recognition, they are easily adapted to regression problems. Any class of statistical models can be termed a neural network if they use adaptive weights and can approximate non-linear functions of their inputs. Thus neural network regression is suited to problems where a more traditional regression model cannot fit a solution.
尽管众所周知,神经网络可用于深度学习和建模复杂问题(例如图像识别),但它们很容易适应回归问题。 如果统计模型使用自适应权重并且可以近似其输入的非线性函数,则可以将其称为神经网络。 因此,神经网络回归适用于更传统的回归模型无法解决问题的问题。
Neural network regression is a supervised learning method, and therefore requires a tagged dataset, which includes a label column. Because a regression model predicts a numerical value, the label column must be a numerical data type.
神经网络回归是一种有监督的学习方法,因此需要标记的数据集,其中包括一个标签列。 由于回归模型可预测数值,因此标签列必须是数值数据类型。
We will be using a subset of NYC Taxi & Limousine Commission — green taxi trip records available from Azure Open Datasets. The data is enriched with holiday and weather data. Based on the enriched dataset, we will configure the prebuilt Neural Network Regression module to create a regression model using a customizable neural network algorithm. We will train the model by providing the model and the NYC taxi dataset as an input to Train Model. The trained model can then be used to predict NYC taxi fares. We will do all of this from the Azure Machine Learning designer without writing a single line of code.
我们将使用纽约市出租车和豪华轿车委员会的子集-可从Azure开放数据集获得的绿色出租车行车记录。 该数据富含假日和天气数据。 基于丰富的数据集,我们将配置预构建的神经网络回归模块,以使用可定制的神经网络算法创建回归模型。 我们将通过提供模型和NYC出租车数据集作为“训练模型”的输入来训练模型。 然后,可以将训练后的模型用于预测纽约市出租车费。 我们将由Azure机器学习设计器来完成所有这些工作,而无需编写任何代码。
上传数据集 (Upload Dataset)
In Azure portal, open the available machine learning workspace.
在Azure门户中 ,打开可用的机器学习工作区。
Select Launch now under the Try the new Azure Machine Learning studio message.
选择“ 尝试新的Azure机器学习工作室”消息下的“ 立即启动” 。
3. When you first launch the studio, you may need to set the directory and subscription.
3.首次启动Studio时,可能需要设置目录和订阅。
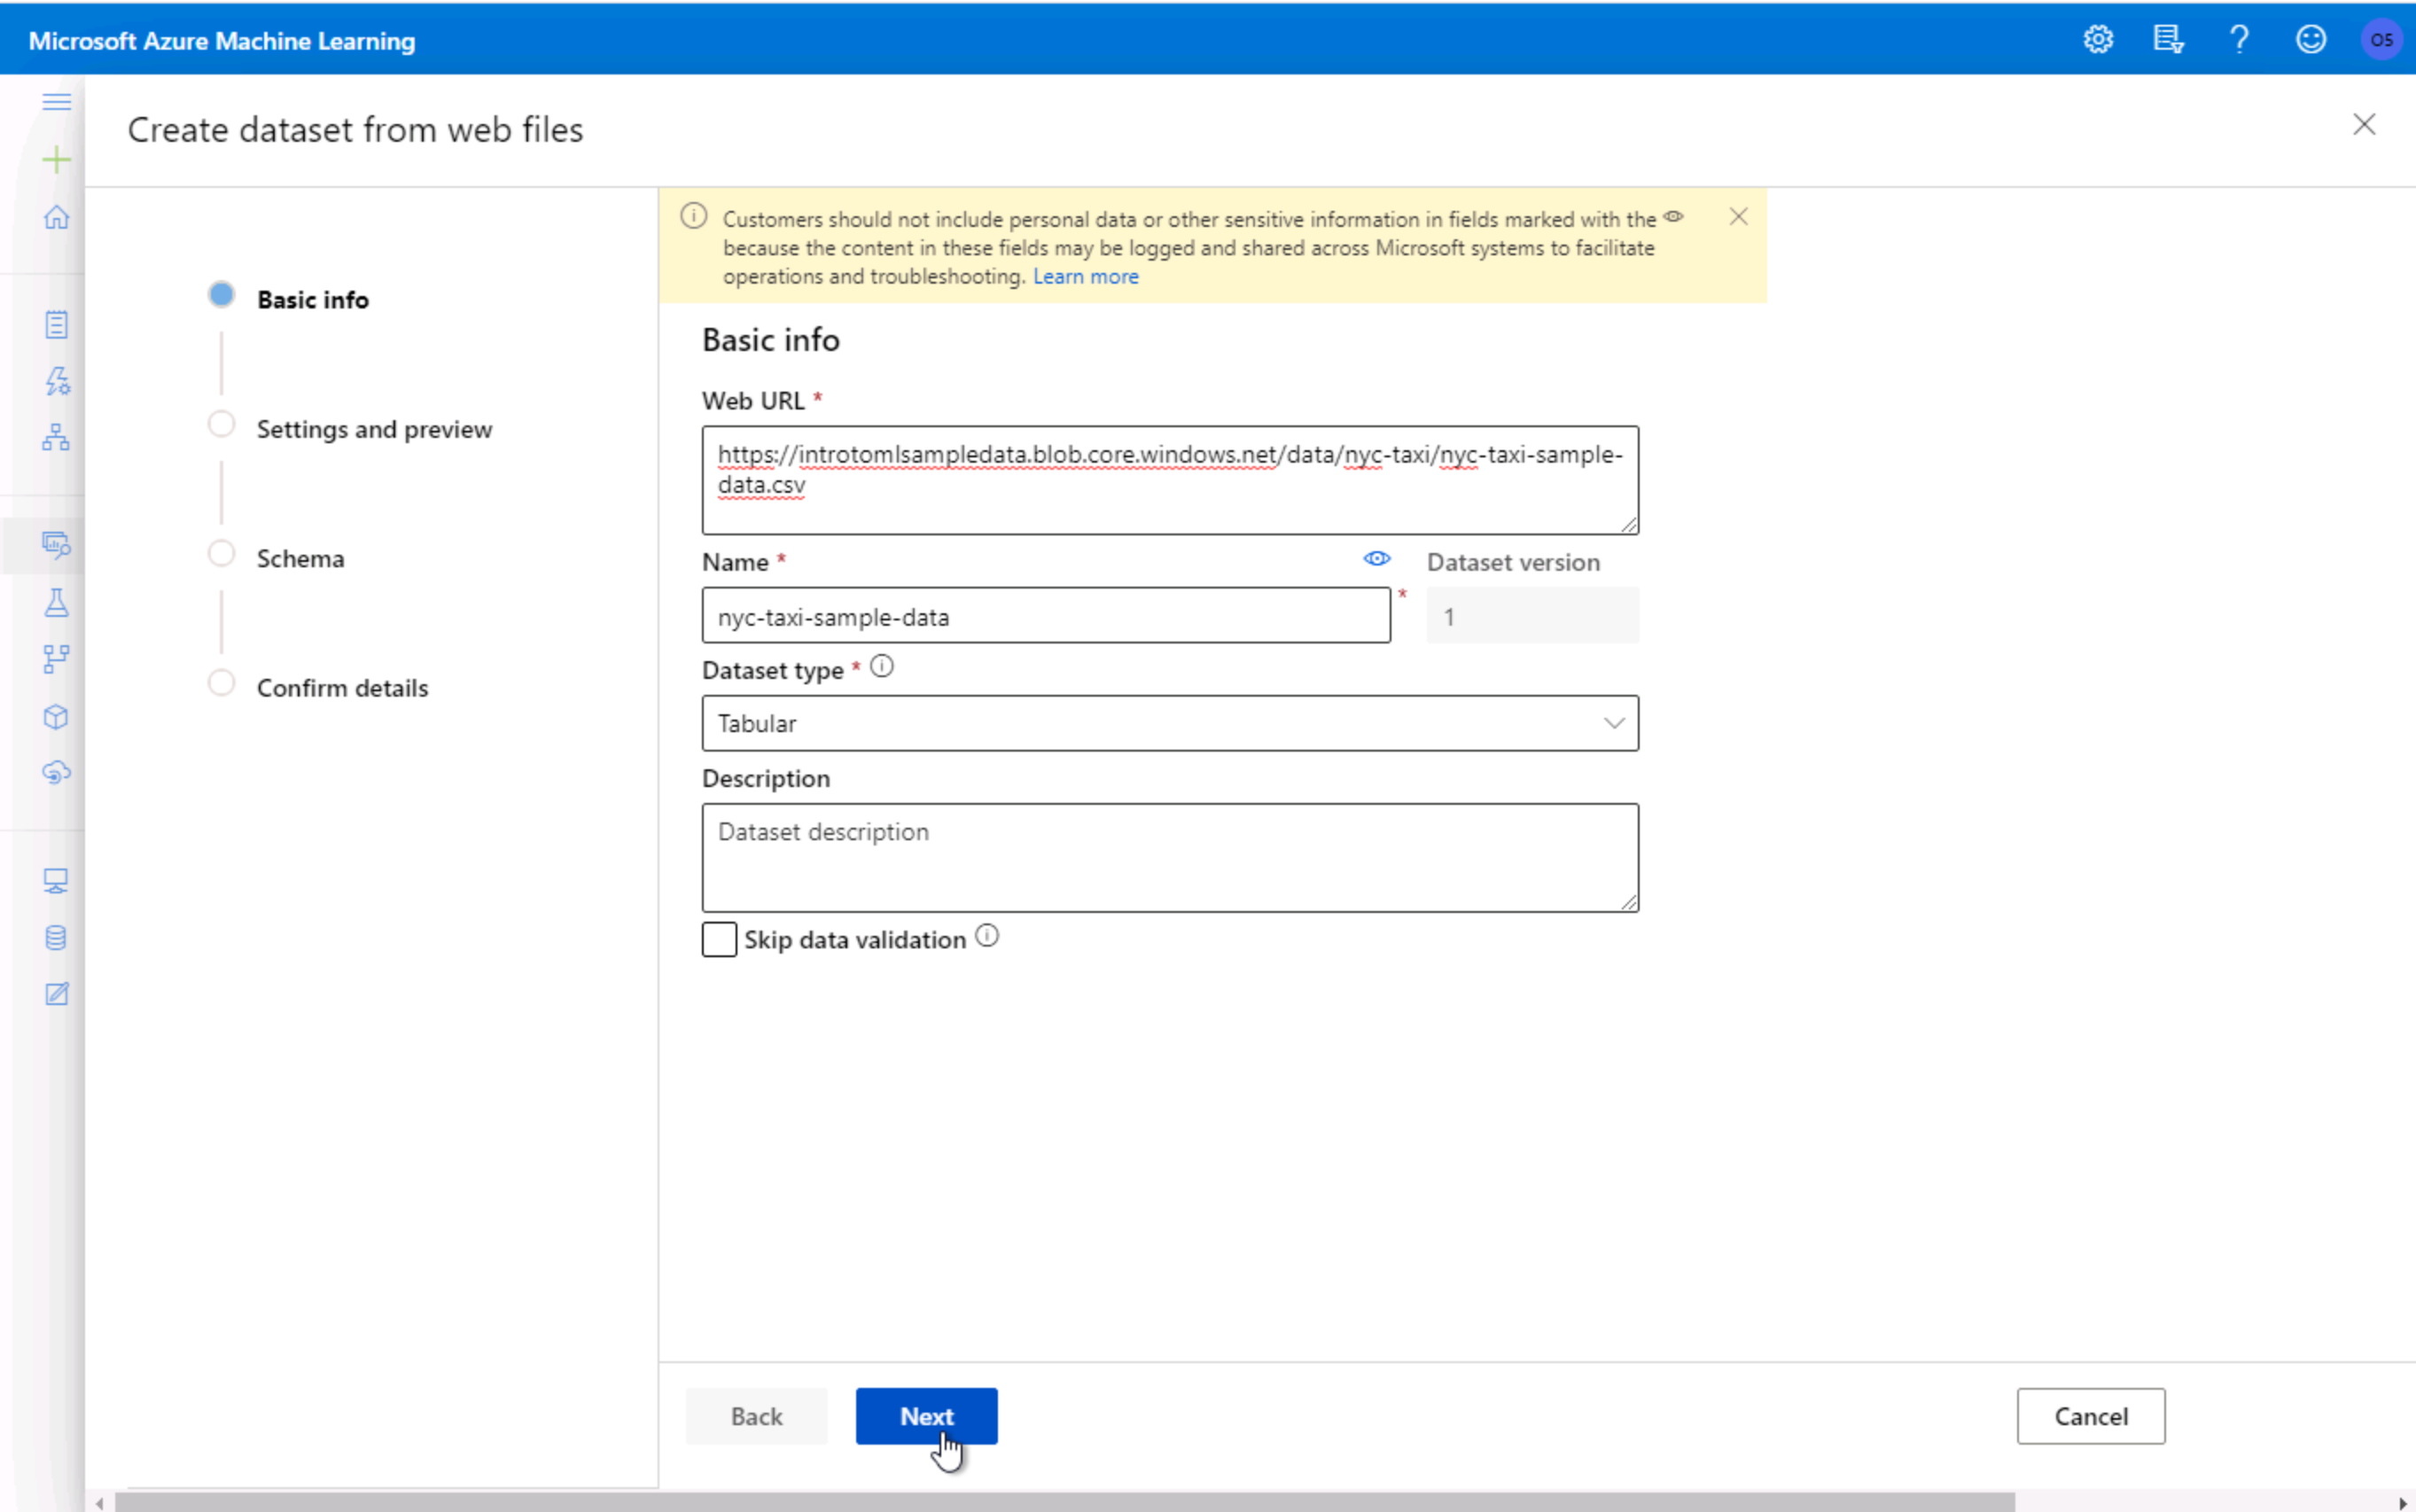
4. From the studio, select Datasets, + Create dataset, From web files. This will open the Create dataset from web files dialog on the right.
4.在工作室中,选择数据集,+创建数据集,从Web文件 。 这将打开右侧的“ Create dataset from web files对话框。

5. From the studio, select Datasets, + Create dataset, From web files. This will open the Create dataset from web files dialog on the right.
5.在工作室中, 依次选择数据集,+创建数据集,来自Web文件 。 这将打开右侧的“ Create dataset from web files对话框。
预览数据集 (Preview Dataset)
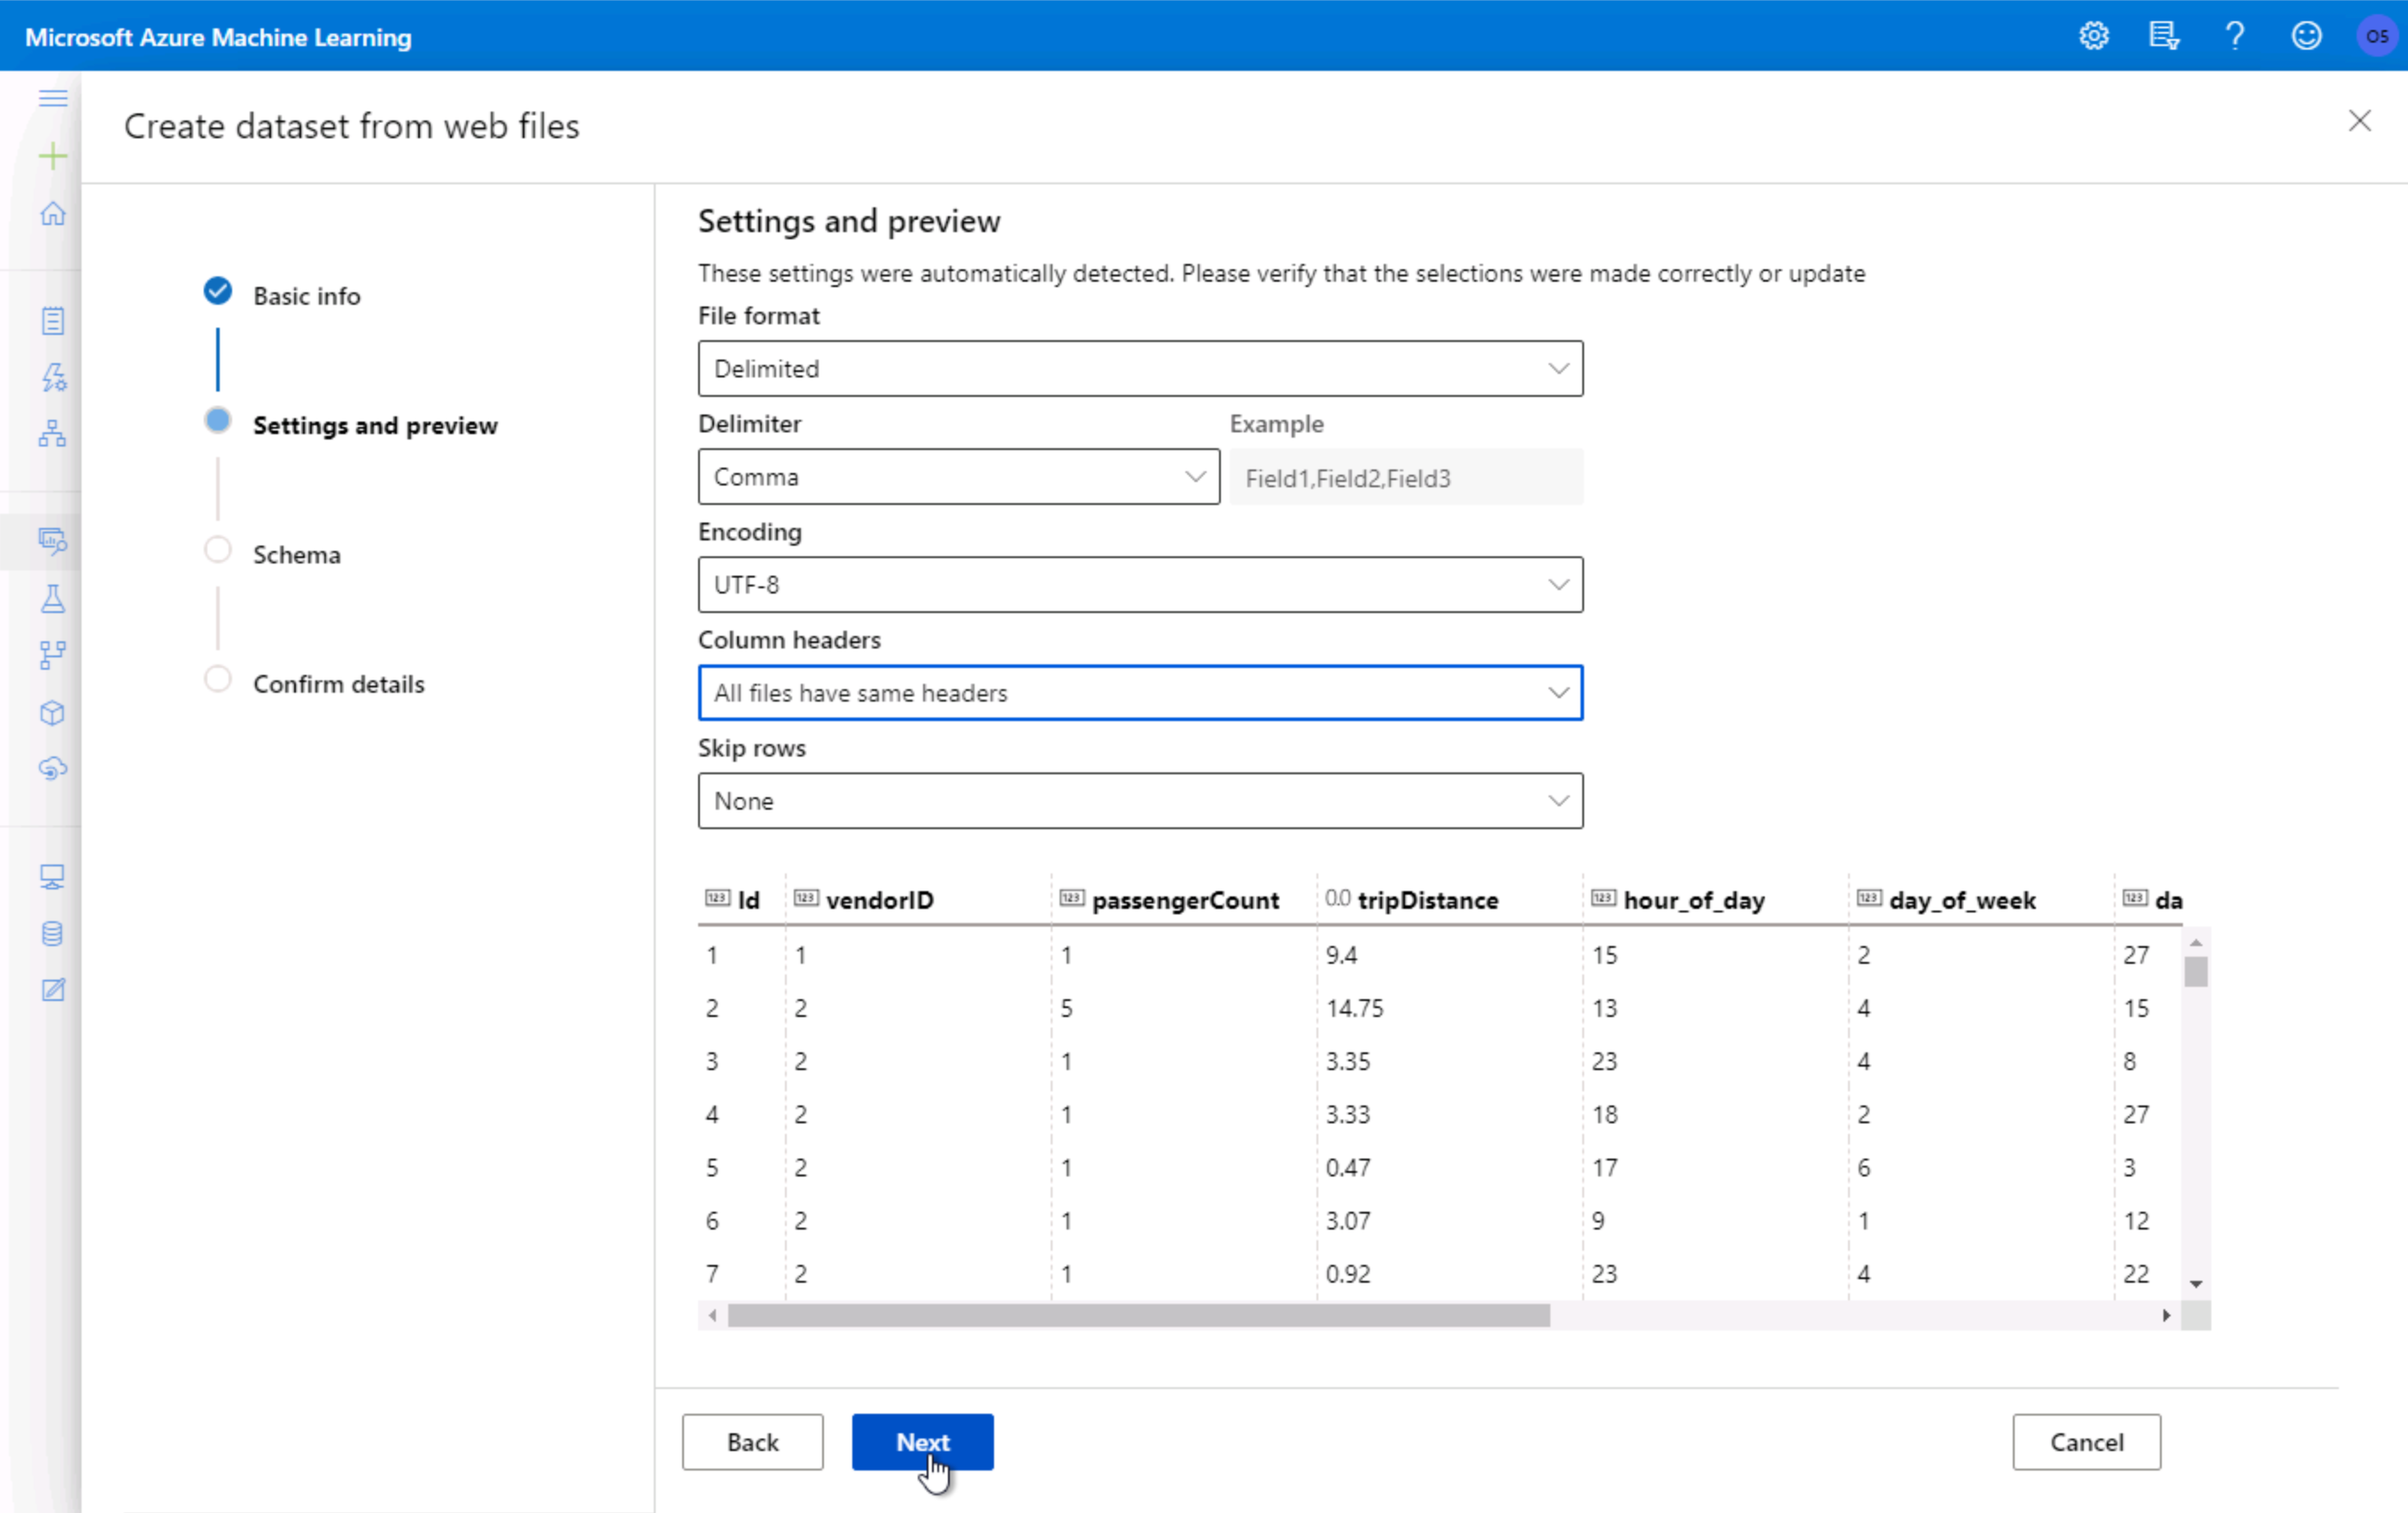
On the Settings and preview panel, set the column headers drop down to
All files have same headers.在“设置和预览”面板上,将列标题设置为
All files have same headers。Scroll the data preview to right to observe the target column:
totalAmount. After you are done reviewing the data, select Next向右滚动数据预览以观察目标列:
totalAmount。 查看完数据后,选择“ 下一步”。
3.Select columns from the dataset to include as part of your training data. Leave the default selections and select Next
3.从数据集中选择要包含在训练数据中的列。 保留默认选择,然后选择下一步
4. For Create Dataset weConfirm the dataset details and select Create
4.对于“创建数据集”,我们确认数据集详细信息,然后选择“ 创建”
创建一条新的培训管道 (Creating a New Training Pipeline)
From the studio, select Designer, +. This will open a
visual pipeline authoring editor.在工作室中,选择Designer,然后选择+ 。 这将打开一个
visual pipeline authoring editor。

设置计算目标 (Setup Compute Target)
In the settings panel on the right, select Select compute target.
在右侧的设置面板中,选择选择计算目标 。

In the
Set up compute targeteditor, select the available compute, and then select Save.在“
Set up compute target编辑器中,选择可用的计算,然后选择“ 保存” 。
Note: If you are facing difficulties in accessing pop-up windows or buttons in the user interface, please refer to the Help section in the lab environment.
注意:如果在访问用户界面中的弹出窗口或按钮时遇到困难,请参考实验室环境中的“帮助”部分。
添加数据集 (Add Dataset)
Select Datasets section in the left navigation. Next, select My Datasets, nyc-taxi-sample-data and drag and drop the selected dataset on to the canvas.
在左侧导航栏中选择“ 数据集”部分。 接下来,选择“ 我的数据集”,“ nyc-taxi-sample-data”并将所选数据集拖放到画布上。

分割数据集 (Split Dataset)
Select Data Transformation section in the left navigation. Follow the steps outlined below:
在左侧导航栏中选择“ 数据转换”部分。 请按照以下概述的步骤操作:
Select the Split Data prebuilt module
选择拆分数据预建模块
- Drag and drop the selected module on to the canvas 将所选模块拖放到画布上
Fraction of rows in the first output dataset: 0.7
第一个输出数据集中的行分数: 0.7
Connect the
Datasetto theSplit Datamodule将
Dataset连接到Split Data模块

Note that you can submit the pipeline at any point to peek at the outputs and activities. Running pipeline also generates metadata that is available for downstream activities such selecting column names from a list in selection dialogs.
请注意,您可以随时提交管道以查看输出和活动。 运行管道还会生成可用于下游活动的元数据,例如从选择对话框中的列表中选择列名称。
初始化回归模型 (Initialize Regression Model)
Select Machine Learning Algorithms section in the left navigation. Follow the steps outlined below:
在左侧导航栏中选择机器学习算法部分。 请按照以下概述的步骤操作:
Select the Neural Network Regression prebuilt module, in the Regression category.
在“回归”类别中,选择“ 神经网络回归”预建模块。
- Drag and drop the selected module on to the canvas 将所选模块拖放到画布上
Create trainer mode: Single Parameter. This option indicates how you want the model to be trained.
创建培训师模式: 单参数 。 此选项指示您希望如何训练模型。
Hidden layer specification: Fully connected case.
隐藏层规范: 完全连接的外壳 。
For Learning rate: 0.01.
学习率: 0.01 。

Note: Because the number of nodes in the input layer is determined by the number of features in the training data, in a regression model there can be only one node in the output layer.
注意:由于输入层中的节点数由训练数据中的要素数量决定,因此在回归模型中,输出层中只能有一个节点。
设置火车模型模块 (Setup Train Model Module)
Select Model Training section in the left navigation. Follow the steps outlined below:
在左侧导航栏中选择“ 模型训练”部分。 请按照以下概述的步骤操作:
Select the Train Model prebuilt module
选择火车模型预建模块
- Drag and drop the selected module on to the canvas 将所选模块拖放到画布上
Connect the
Neural Network Regressionmodule to the first input of theTrain Modelmodule将
Neural Network Regression模块连接到Train Model模块的第一个输入Connect the first output of the
Split Datamodule to the second input of theTrain Modelmodule将
Split Data模块的第一个输出连接到Train Model模块的第二个输入Select the Edit column link to open the
Label columneditor选择“ 编辑”列链接以打开“
Label column编辑器

The
Label columneditor allows you to specify yourLabel or Target column. Type in the label column name totalAmount and then select Save.Label column编辑器允许您指定Label or Target column。 输入标签列名称totalAmount ,然后选择Save 。

设置分数模型模块 (Setup Score Model Module)
Select Model Scoring & Evaluation section in the left navigation. Follow the steps outlined below:
在左侧导航栏中选择“ 模型评分和评估”部分。 请遵循以下概述的步骤:
Select the Score Model prebuilt module
选择分数模型预建模块
- Drag and drop the selected module on to the canvas 将所选模块拖放到画布上
Connect the
Train Modelmodule to the first input of theScore Modelmodule将
Train Model模块连接到Score Model模块的第一个输入Connect the second output of the
Split Datamodule to the second input of theScore Modelmodule将
Split Data模块的第二个输出连接到Score Model模块的第二个输入
Note that Split Data module will feed data for both model training and model scoring. The first output (0.7 fraction) will connect with the Train Model module and the second output (0.3 fraction) will connect with the Score Model module.
请注意,“ Split Data 模块将同时提供用于模型训练和模型评分的数据。 第一个输出(0.7分数)将与“ Train Model 模块 连接, 第二个输出(0.3分数)将与“ Score Model 模块 连接 。
设置评估模型模块 (Setup Evaluate Model Module)
Select Model Scoring & Evaluation section in the left navigation. Follow the steps outlined below:
在左侧导航栏中选择“ 模型评分和评估”部分。 请按照以下概述的步骤操作:
Select the Evaluate Model prebuilt module
选择评估模型预构建模块
- Drag and drop the selected module on to the canvas 将所选模块拖放到画布上
Connect the
Score Modelmodule to the first input of theEvaluate Modelmodule将
Score Model模块连接到Evaluate Model模块的第一个输入
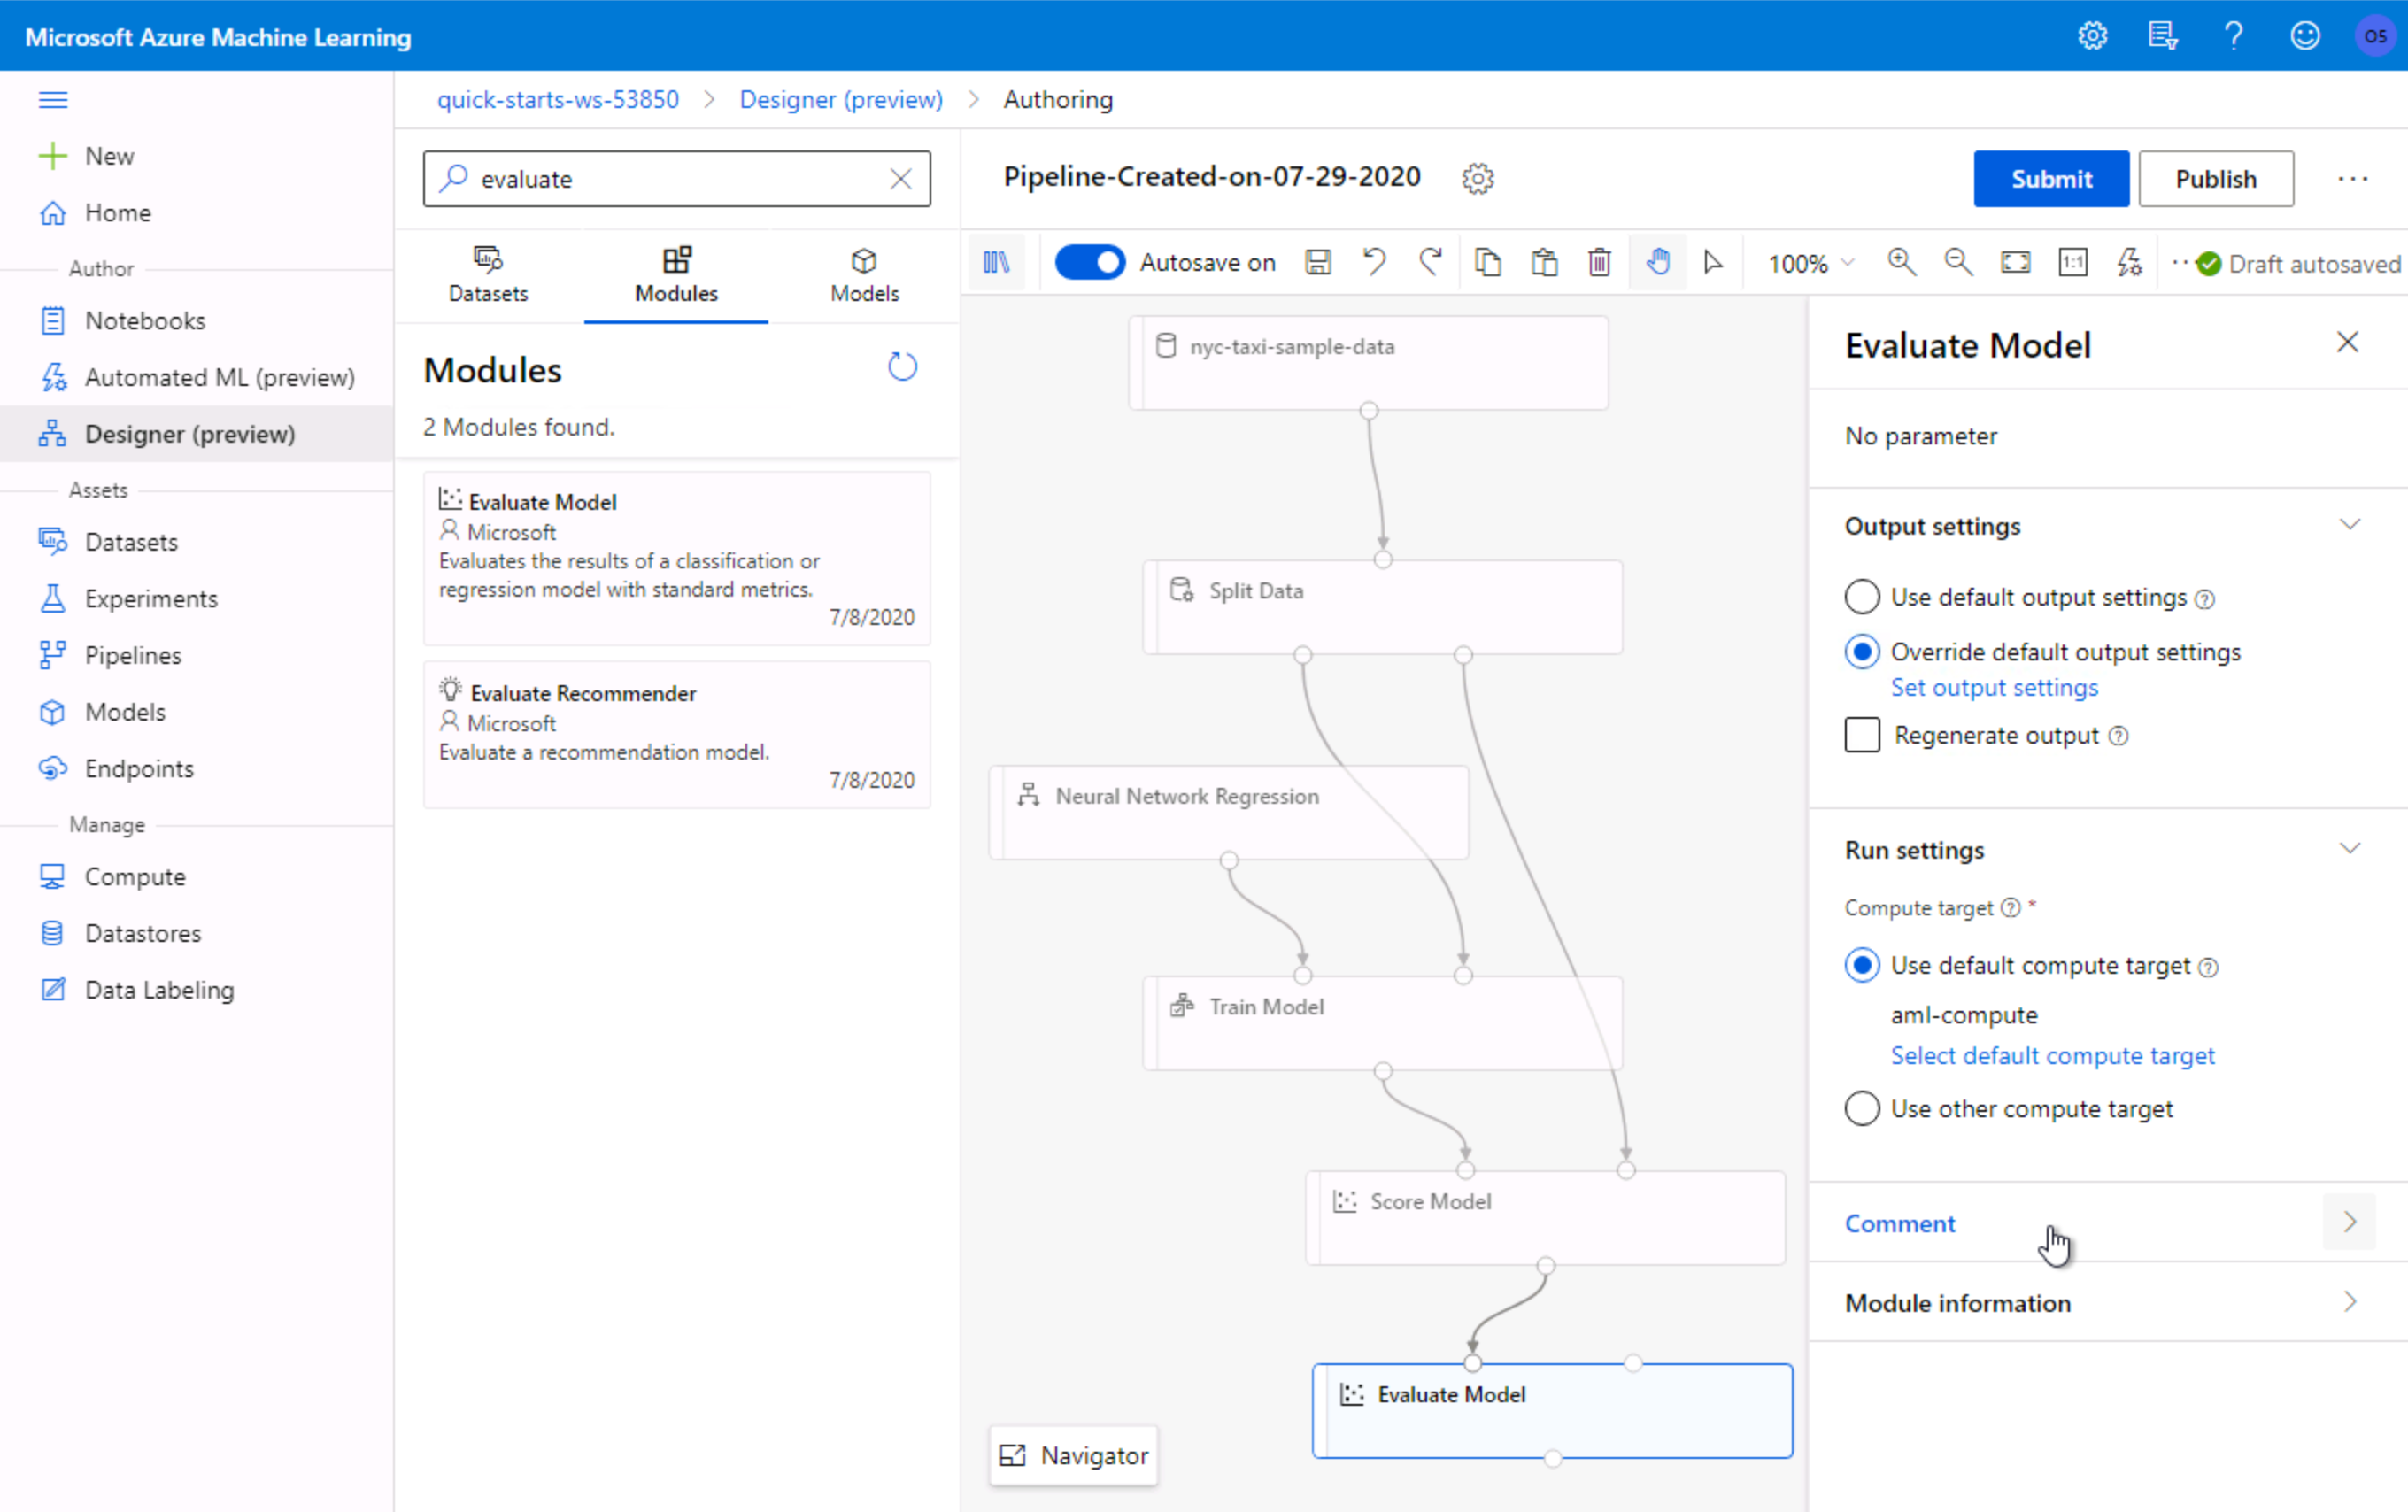
提交培训管道 (Submit Training Pipeline)
Select Submit to open the
Setup pipeline runeditor.选择提交以打开
Setup pipeline run编辑器。

In the Setup pipeline run editor, select Experiment, Create new and provide New experiment name: neural-network-regression, and then select Submit.
在“ Setup pipeline run editor ,选择“ 实验”,“新建”并提供New experiment name: Neuro-network-regression ,然后选择“ 提交” 。

Wait for pipeline run to complete. It will take around 8 minutes to complete the run.
等待管道运行完成。 大约需要8分钟才能完成运行。
While you wait for the model training to complete, you can learn more about the training algorithm used in this lab by selecting Neural Network Regression module.
在等待模型训练完成时,您可以通过选择神经网络回归模块来了解有关本实验中使用的训练算法的更多信息。
可视化模型预测 (Visualize the Model Predictions)
Select Score Model, Outputs, Visualize to open the
Score Model result visualizationdialog or just simply right-click theScore Modelmodule and select Visualize Scored Dataset.选择分数模型,输出,可视化以打开
Score Model result visualization对话框,或者只需右键单击Score Model模块并选择可视化分数数据集 。

Observe the predicted values under the column Scored Labels. You can compare the predicted values (Scored Labels) with actual values (totalAmount).
注意“计分标签 ”列下的预测值。 您可以将预测值(计分Scored Labels )与实际值( totalAmount )进行比较。

可视化评估结果 (Visualize the Evaluation Results)
Select Evaluate Model, Outputs, Visualize to open the
Evaluate Model result visualizationdialog or just simply right-click theEvaluate Modelmodule and select Visualize Evaluation Results.选择“ 评估模型,输出,可视化”以打开“
Evaluate Model result visualization对话框,或者只需右键单击“Evaluate Model模块,然后选择“ 可视化评估结果” 。

Evaluate the model performance by reviewing the various evaluation metrics, such as Mean Absolute Error, Root Mean Squared Error, etc.
通过查看各种评估指标来评估模型性能,例如平均绝对误差 , 均方根误差等。
下一步 (Next Steps)
Congratulations! You have trained a simple neural net model using the prebuilt Neural Network Regression module in the AML visual designer.
恭喜你! 您已经使用AML视觉设计器中的预构建神经网络回归模块训练了一个简单的神经网络模型。
翻译自: https://medium.com/@ruslanmv/train-a-simple-neural-net-model-with-azure-b3514ee291fb
azure模型训练


 2791
2791

 被折叠的 条评论
为什么被折叠?
被折叠的 条评论
为什么被折叠?
 到【灌水乐园】发言


