


In this story, we are going to do some basic portfolio returns analysis in python.
在这个故事中,我们将使用python做一些基本的投资组合收益分析。
When we analyze a stock, portfolio, or index’s performance, the first thing we look at is usually the returns, and understandably so, since it’s how much money we make from investing in the instrument. So let’s see what are some of the basic techniques involved in the analysis.
当我们分析股票,投资组合或指数的表现时,我们首先要看的是回报,这是可以理解的,因为这是我们从投资该工具中获利多少。 因此,让我们看一下分析中涉及的一些基本技术。
First we need a time series of prices. How do we go about getting that for testing? The easiest way to do it is using the geometric brown motion(GBM) to generate it:
首先,我们需要一个时间序列的价格。 我们如何进行测试? 最简单的方法是使用几何棕色运动(GBM)生成它:
import pandas as pd
import numpy as npdef brownian_prices(start, end):
    bdates = pd.bdate_range(start, end)
    size = len(bdates)
    np.random.seed(1)
    wt = np.random.standard_normal(size)
    mu = 0.0001
    sigma = 0.01
    s0 = 100.0
    st = s0 * np.cumprod(np.exp((mu - (sigma * sigma / 2.0))) + sigma * wt)
    return pd.DataFrame(data={'date': bdates, 'price': st}).set_index('date')prices = brownian_prices('20200101', '20200801')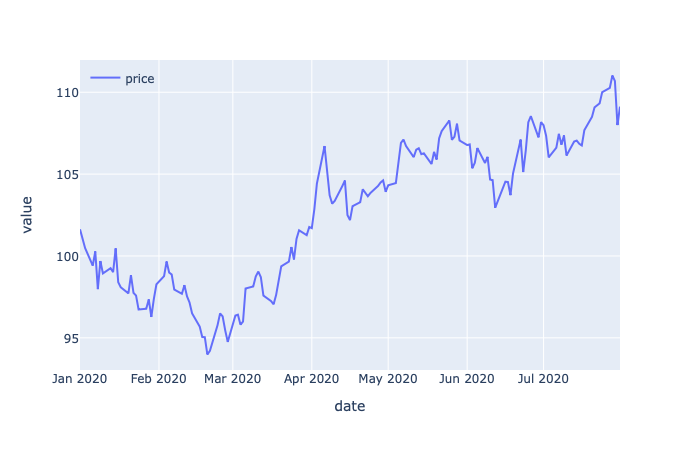
There are several advantages of using GBM random process:
使用GBM随机过程有几个优点:
- It’s always positive, which is what prices are supposed to be. There are exceptions obviously, like the oil futures recently… But for stocks it’s a good assumption. 价格始终是积极的,这应该是正确的。 显然也有例外,例如最近的石油期货……但是对于股票来说,这是一个很好的假设。
- The returns of the process is independent of the values of the process. For example, stocks can split, but it shouldn’t change how much money you make from the stock. 流程的回报与流程的价值无关。 例如,股票可以分割,但不应改变您从股票中赚多少钱。
- It has a very nice functional form and satisfies a differential equation that allows for the development of pricing formulas for derivative instruments like options. i.e. Black-Scholes formula. 它具有很好的功能形式,并且满足微分方程,可以开发诸如期权之类的衍生工具的定价公式。 即布莱克-斯科尔斯公式。
Once you have the prices, you can calculate the returns of the instrument:
获得价格后,您可以计算工具的回报:
def daily_returns(prices):
    res = (prices/prices.shift(1) - 1.0)[1:]
    res.columns = ['return']
    return resdret = daily_returns(prices)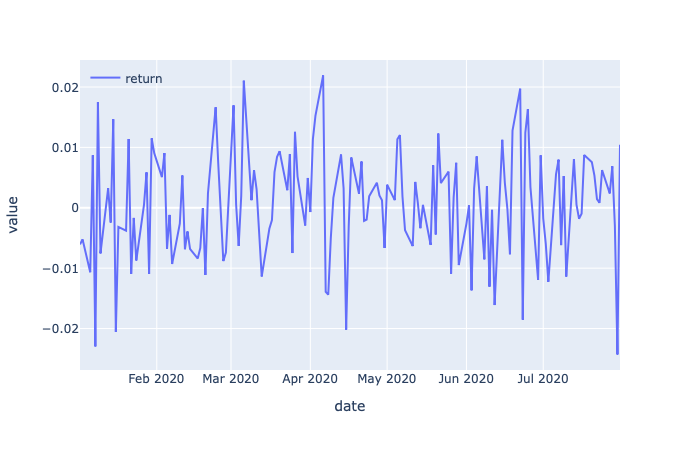
return
返回
= (current price -previous price) / previous price
=(当前价格-先前价格)/先前价格
= (current price / previous price) -1
=(当前价格/先前价格)-1
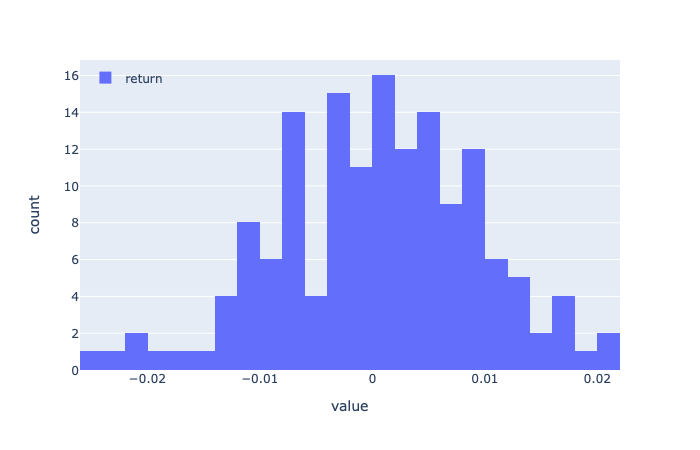
A histogram of the returns will give you a good idea of its distribution, in this case, you can see that the returns are roughly normal with mean around zero.
收益的直方图可以使您很好地了解收益的分布,在这种情况下,您可以看到收益大致为正态,均值约为零。
Once you have the returns, next step is calculating cumulative returns:
获得收益后,下一步就是计算累积收益:
def cumulative_returns(returns):
    res = (returns + 1.0).cumprod()
    res.columns = ['cumulative return']
    return rescret = cumulative_returns(dret)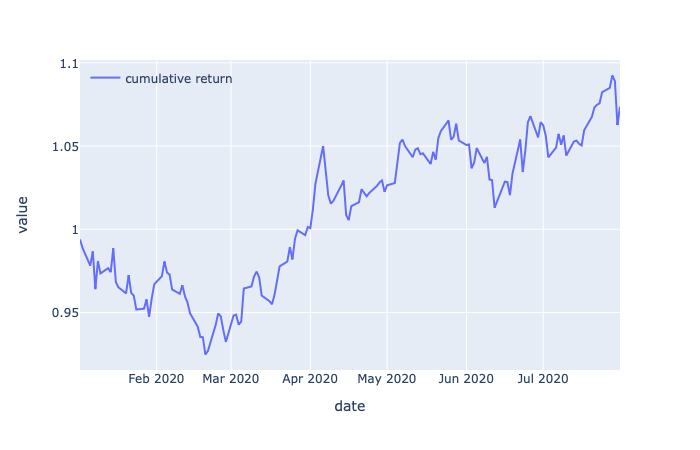
It’s very simple, and it’s essentially the prices rescaled by initial price.
这很简单,实质上是按初始价格重新调整价格。
Now with the cumulative returns, you can calculate the maximum drawdowns.
现在,有了累积收益,您就可以计算最大亏损。
What is the maximum drawdown? it’s basically how much you can possibly lose at any point in time if you invest in a portfolio. For example, if your stock prices are follows:
最大跌幅是多少? 基本上,这是您投资某个组合在任何时间点可能损失的金额。 例如,如果您的股票价格如下:

On day 1 the maximum you can lose is 0.
在第1天,您最多可以损失0。
On day 2 the maximum you can lose is also 0 (yay!)
在第2天,您最多可以输掉0(是!)
On day 3 the maximum you can lose is… 6.0! You can do that by investing in the stock on day2 (paid 10.0 for the stock and now it’s 4.0, you lose 6.0).
在第3天,您可能损失的最大金额为…6.0! 您可以通过在第2天投资股票来做到这一点(支付10.0的股票价格,现在为4.0,则亏损6.0)。
On day 4 the maximum you can lose is 2.0, again by paying 10.0 on day 2 for the stock.
在第4天,您可以损失的最大金额为2.0,再次在第2天为该股票支付10.0。
On day 5, what is the maximum you can lose? I think it’s pretty clear now that it’s 5.0, since you can pay a max of 10.0 for the stock. Notice it’s not 8.0 minus 5.0, because even though 8.0 is a peak, it’s not the maximum peak.
在第5天,您可以损失的最大金额是多少? 我认为现在是5.0,因为您最多可以为股票支付10.0。 请注意,它不是8.0减去5.0,因为即使8.0是一个峰值,也不是最大峰值。
Below is the code to do that:
下面是执行此操作的代码:
def max_drawdown(cum_returns):
    max_returns = np.fmax.accumulate(cum_returns)
    res = cum_returns / max_returns - 1
    res.columns = ['max drawdown']
    return resddown = max_drawdown(cret)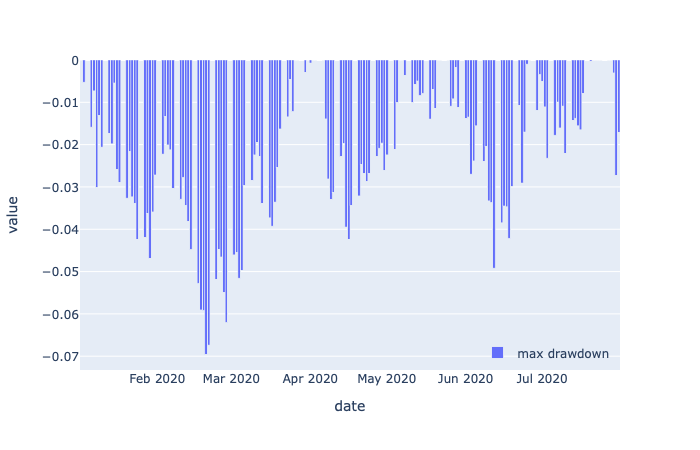
Why is max drawdown important? Aside from the fact that you don’t ever want to lose money, it’s important to limit max drawdown because it is an indication of risk and too much drawdown in a leveraged portfolio can trigger a margin call.
为什么最大亏损很重要? 除了您永远不想亏本的事实外,限制最大跌幅非常重要,因为这是一种风险迹象,杠杆投资组合中的太多跌幅可能会触发追加保证金。
翻译自: https://medium.com/the-innovation/portfolio-analysis-basics-returns-and-drawdowns-70c5f7a0eb3d


 370
370

 被折叠的 条评论
为什么被折叠?
被折叠的 条评论
为什么被折叠?
 到【灌水乐园】发言


