


 文章介绍了如何使用波士顿矩阵结合Python来对产品进行分类,通过销售增长率和市场占有率两个关键指标,将产品划分为四类,并提供了具体的Python代码示例进行模拟。这种方法也可应用于其他领域的二维指标分类,如渠道分析和产品质量评估。
分群思维(二)基于波士顿矩阵的产品分类
小P:小H,我们的产品现在越来越多了,有没有好分类方法帮助分类呢
小H:有啊,典型的如波士顿矩阵产品分类法
小P:我就知道你会,给我们讲讲呗~
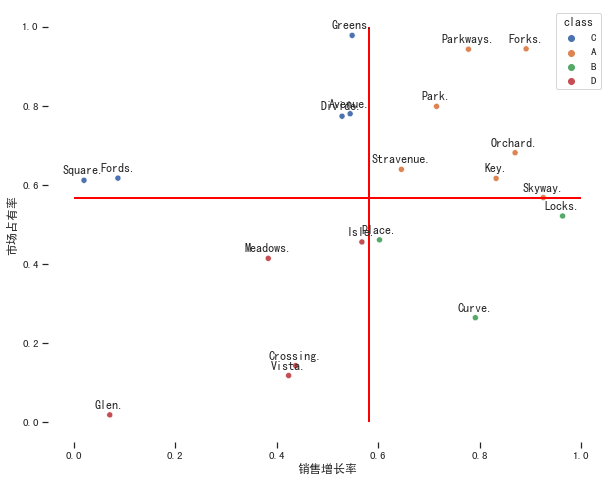
小H:波士顿矩阵将"销售增长率"和"市场占有率"作为衡量产量的重要因素,组合形成四种产品,也即著名的的波士顿产品分类。

Python模拟
import faker
import pandas as pd
import seaborn as sns
import numpy as np
import matplotlib.pyplot as plt
from matplotlib import ticker
%matplotlib inline

# 初始化设置
sns.set(style="ticks")
plt.rcParams['axes.unicode_minus']=False # 用来正常显示负号
plt.rcParams['font.sans-serif'] = ['SimHei'] # 用来正常显示中文标签
plt.rcParams['axes.unicode_minus'] = False # 用来正常显示负号
def mat_class(x, y, xmean, ymean):
    '''
    根据特征xy生成四类,其中A类似于明星产品
    '''
    if x>=xmean and y>=ymean:
        cl = 'A'
    elif x>=xmean and y<ymean:
        cl = 'B'
    elif x<xmean and y>=ymean:
        cl = 'C'
    else:
        cl = 'D'
    return cl
# 生成产品随机数
f = faker.Faker()
product = [f.unique.street_suffix() for i in range(20)] # 随机生成的街道简称替代产品名称
np.random.seed(0)
sales_growth = list(np.random.rand(20))
market_share = list(np.random.rand(20))
df = pd.DataFrame({'product':product, 'sales_growth':sales_growth, 'market_share':market_share})

sales_growth_mean = df['sales_growth'].mean()
market_share_mean = df['market_share'].mean()

df['class'] = df.apply(lambda x: mat_class(x.sales_growth, x.market_share,
                                           sales_growth_mean, market_share_mean), axis = 1)

df.head()
| product | sales_growth | market_share | class | |
|---|---|---|---|---|
| 0 | Greens | 0.548814 | 0.978618 | C |
| 1 | Park | 0.715189 | 0.799159 | A |
| 2 | Place | 0.602763 | 0.461479 | B |
| 3 | Avenue | 0.544883 | 0.780529 | C |
| 4 | Vista | 0.423655 | 0.118274 | D |
# 为每个点添加对应的名称
plt.figure(figsize=(10, 8))
# 基础散点图
x, y = df['sales_growth'], df['market_share']
label = df['product']
sns.scatterplot(x=x, y=y, hue="class", data=df)
plt.xlabel('销售增长率'); plt.ylabel('市场占有率')

# 对散点图中的每一个点进行文字标注
for a,b,l in zip(x,y,label):
    plt.text(a, b+0.01, '%s.' % l, ha='center', va='bottom',
                                             fontsize=12)

# 添加特定分割线
plt.vlines(x=sales_growth_mean, ymin=0, ymax=1,
           colors='red', linewidth=2)
plt.hlines(y=market_share_mean, xmin=0, xmax=1,
           colors='red', linewidth=2)

# # 背景网格
# plt.grid(True)
# 隐去四周的边框线条
sns.despine(trim=True, left=True, bottom=True)
plt.show()
应用
一般基于波士顿矩阵分类衍生出了类似的四象限分析法,将二维指标引申至相关的两个特征。例如通过渠道规模和渠道质量对渠道进行分类;产品功能使用率和次日留存率对产品质量进行分类等。
总结
波士顿矩阵对于二维分类具有很好的指导思想,可扩展性极强
共勉~


 1万+
1万+

 被折叠的 条评论
为什么被折叠?
被折叠的 条评论
为什么被折叠?
 到【灌水乐园】发言


