


文档资料
官网:Nsight Systems | NVIDIA Developer
文档:Nsight Systems — nsight-systems 2025.1 documentation
NVTX文档:nvtx - Annotate code ranges and events in Python — nvtx 0.2.4 documentation
参考资料
- 【CUDA进阶】深入理解 Nsight System 和 Nsight Compute_bilibili
- 彻底搞懂!CUDA编程之:如何安装Nsight system及compute_bilibili
- 分类: Nsight | 奔跑的IC
安装
安装步骤:
- 下载安装包:Nsight Systems - Get Started | NVIDIA Developer
- 修复依赖项的问题[参考],安装 libxcb-cursor0:
sudo apt install -f - 运行安装命令:
sudo dpkg -i nsight-systems-2024.4.1_2024.4.1.61-1_amd64.deb - 安装成功
问题解决:在Ubuntu20.04上安装Nsight Systems
- 使用Linux Perf:Nsight Systems Issue: Unable to configure the collection of CPU IP samples
- “如果希望在没有root用户的情况下运行CLI(推荐模式),则需要安装在具有完全访问权限的目录中。”换句话说就是可以在root用户下使用。此时,使用
nsys status -e命令的输出结果如下。通过此状态检查,可以确保在本地环境中满足使用Nsight Systems进行CPU采样的系统要求。如果采样环境不正常,仍然可以运行各种跟踪操作。
Timestamp counter supported: Yes
CPU Profiling Environment Check
Root privilege: enabled
Linux Kernel Paranoid Level = 4
Linux Distribution = Ubuntu
Linux Kernel Version = 6.5.0-21-generic: OK
Linux perf_event_open syscall available: OK
Sampling trigger event available: OK
Intel(c) Last Branch Record support: Available
CPU Profiling Environment (process-tree): OK
CPU Profiling Environment (system-wide): OK
使用
使用命令nsys help查看所有可用的命令和选项。
使用命令nsys profile运行模型训练脚本:nsys profile python3 main.py -a resnet18 -b 32 ~/dataset/tiny-imagenet-200
运行结果:
All done. Here are some perf stats fresh off the preses.
Generating '/tmp/nsys-report-b88a.qdstrm'
[1/1] [========================100%] report1.nsys-rep
Generated:
    /home/xx/examples/imagenet/report1.nsys-rep
打开NSys,点击 File -> Open 导入 report1.nsys-rep。
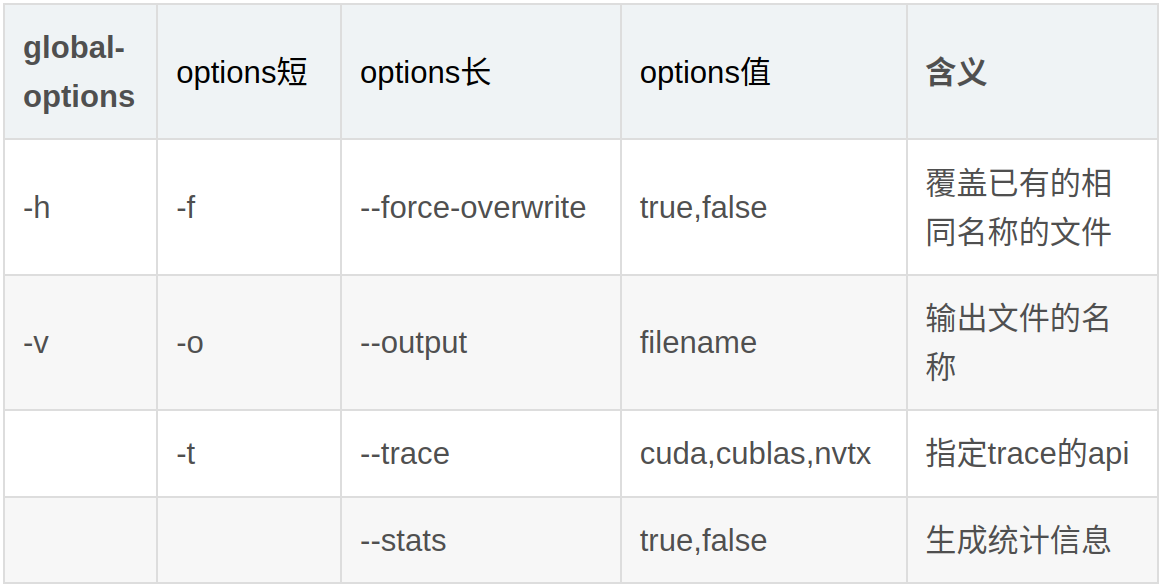
命令nsys profile的可选参数[参考]
# application是程序,application-arguments是程序参数
nsys [global-options] profile [options] <application> [application-arguments]
#示例,产生的 nsight_t5_fp16 下载到本地用 nsight 工具查看
nsys profile -o nsight_t5_fp16 -f true python temp.py
GUI 界面使用技巧
- 鼠标拖动可以查看此段的kernel执行时间。
- 双击选中区域可以放大查看,
ctrl+鼠标滚轮也可以放大/缩小。 - 在选中区域右键,点击
Filter and Reorder,可以重排选中区域的核函数耗时占比和排行。继续右键选中区域,点击Remove Filter,恢复到之前的核函数耗时占比和排行。 - 在左侧边栏
Timeline View右键,点击Show in Events View,可以按Duration排序核函数。
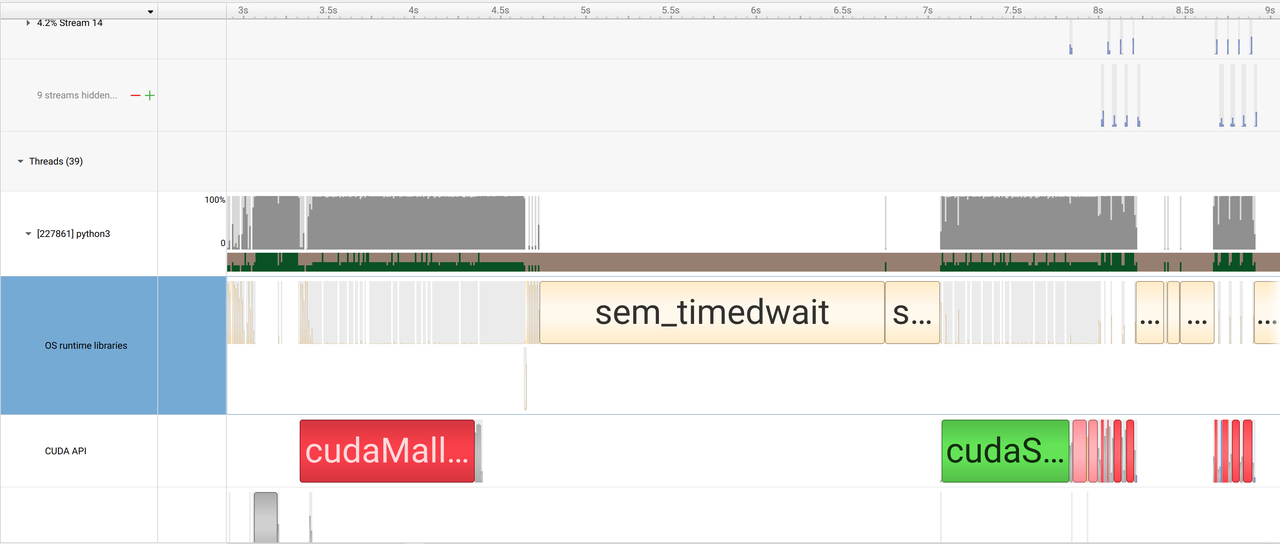
使用 Nsight Systems 分析 GPU 工作负载
本文介绍使用 Nsight Systems 分析 GPU 上的工作负载的常见工作流程。
作为示例,让我们使用 torchvision 的 resnet18 模型来分析前向、后向和 optimizer.step() 方法。
为了注释训练的每个部分,我们将通过torch.cuda.nvtx.range_push/.range_pop操作使用 nvtx 范围。这些范围作为堆栈工作并且可以嵌套。
此外,我们通常对第一次迭代不感兴趣,这可能会由于内存分配、cudnn 基准测试等而增加整体训练的开销,因此我们在几次迭代后通过torch.cuda.cudart().cudaProfilerStart()并通过.cudaProfilerStop() 在最后停止它。
完整的代码片段可以在这里看到:
import torch
import torch.nn as nn
import torchvision.models as models

# setup
device = 'cuda:0'
model = models.resnet18().to(device)
# 输入数据是 64 个形状为 3x224x224 的图像(模拟批次)
data = torch.randn(64, 3, 224, 224, device=device)
# 目标是 64 个在 0 到 999 之间的随机整数(模拟类别标签)
target = torch.randint(0, 1000, (64,), device=device)
criterion = nn.CrossEntropyLoss()
optimizer = torch.optim.Adam(model.parameters(), lr=1e-3)

nb_iters = 20        # 总的训练迭代次数
warmup_iters = 10    # 热身迭代次数,在这之前不进行性能分析。
for i in range(nb_iters):
    optimizer.zero_grad()

    # start profiling after 10 warmup iterations
    if i == warmup_iters: torch.cuda.cudart().cudaProfilerStart()

    # push range for current iteration
    if i >= warmup_iters: torch.cuda.nvtx.range_push("iteration{}".format(i))

    # push range for forward
    if i >= warmup_iters: torch.cuda.nvtx.range_push("forward")
    output = model(data)
    if i >= warmup_iters: torch.cuda.nvtx.range_pop()

    loss = criterion(output, target)

    if i >= warmup_iters: torch.cuda.nvtx.range_push("backward")
    loss.backward()
    if i >= warmup_iters: torch.cuda.nvtx.range_pop()

    if i >= warmup_iters: torch.cuda.nvtx.range_push("opt.step()")
    optimizer.step()
    if i >= warmup_iters: torch.cuda.nvtx.range_pop()

    # pop iteration range
    if i >= warmup_iters: torch.cuda.nvtx.range_pop()

torch.cuda.cudart().cudaProfilerStop()
其中:
torch.cuda.cudart().cudaProfilerStart()和torch.cuda.cudart().cudaProfilerStop()用于开始和结束 CUDA 的性能分析。torch.cuda.nvtx.range_push("name")和torch.cuda.nvtx.range_pop()用于在指定范围内插入 NVTX 标记,这样可以在分析工具中看到各个步骤的性能数据。
nsys 配置文件的 CLI 选项可以在此处找到,我的“标准”命令以及用于创建本示例配置文件的命令是:
nsys profile -w true -t cuda,nvtx,osrt,cudnn,cublas -s cpu --capture-range=cudaProfilerApi --cudabacktrace=true -x true -o my_profile python main.py
这些参数可以在链接的 CLI 文档中找到。一些有趣的论点是:
-t cuda,nvtx,osrt,cudnn,cublas:选择要跟踪的API--capture-range=cudaProfilerApi:仅当调用 cudaProfilerStart API 时才会开始分析/捕获范围结束时停止分析。--cudabacktrace=true:跟踪 CUDA API 时,在调用 CUDA API 时启用回溯收集。 (允许您将鼠标悬停在调用上并获取回溯)您还可以在 ns 中指定阈值,它定义了内核在收集回溯之前必须执行的阈值。
nsight system与cuda kernel的时间线分析与可视化
注意文中:记录一个时间段,
nvtx.range(msg),可以作为环境管理器(与with语句一起使用)或者函数装饰器(与@操作符一起使用),记录一段代码的开始和结束,后续分析的时候可以将这段时间标记上消息msg。(!这个不能在比较新的版本用)


 1万+
1万+

 被折叠的 条评论
为什么被折叠?
被折叠的 条评论
为什么被折叠?
 到【灌水乐园】发言


