


abstract
It is important to investigate the propagation from meteorological to hydrological drought and its potential influence factors, which helps to reveal drought propagation process, thereby being helpful for drought mitigation. In this study, Standardized Precipitation Index (SPI) and Standardized Streamflow Index (SSI) were adopted to characterize meteorological and hydrological droughts, respectively. The propagation time from meteorological to hydrological drought was investigated. The cross wavelet analysis was utilized to examine the correlations between hydrological and meteorological droughts in the Wei River Basin (WRB), a typical arid and semi-arid region in China. Moreover, the potential influence factors on the propagation were explored from the perspectives of large-scale atmospheric circulation anomaly and underlying surface characteristics. Results indicated: (1) the propagation time from meteorological to hydrological drought has noticeably seasonal characteristics, that in spring and summer is short, whilst that in autumn and winter is long; (2) hydrological and meteorological droughts are primarily characterized by statistically positive linkages on both long and short time scales; (3) El Niño Southern Oscillation (ENSO) and Arctic Oscillation (AO) are strongly correlated with actual evaporation, thus strongly impacting the propagation time from meteorological to hydrological drought. Additionally, the propagation time has roughly positive associations with the parameter w of the Fu’s equation from the Budyko framework.
本研究采用了标准化降水指数(SPI)和标准化流量指数(SSI)来表征气象和水文干旱,以调查气象干旱向水文干旱的传播时间。采用交叉小波分析方法检验了中国典型干旱半干旱地区——渭河流域(WRB)水文和气象干旱之间的相关性。此外,从大气环流异常和地表特征两个角度探讨了传播过程的潜在影响因素。结果表明:(1)气象干旱向水文干旱的传播时间具有明显的季节特征,春夏季较短,而秋冬季较长;(2)水文和气象干旱在长期和短期时间尺度上主要表现为统计上的正相关;(3)厄尔尼诺-南方涛动(ENSO)和北极涛动(AO)与实际蒸发强相关,从而对气象干旱向水文干旱的传播时间产生了明显影响。此外,传播时间与Budyko框架中Fu方程的参数w呈大致正相关关系。
1. Introduction
Drought is a kind of extreme natural disasters resulting from abnormal decreases in precipitation (Oladipo, 1985; McKee et al, 1993; Wilhite et al 2000; Huang and Chou, 2008; Wang et al, 2011a; Huang et al, 2014a, 2015a,b), which can give rise to a large number of losses in the fields of economy, ecology, and environment (e.g. crop losses, degradation and desertification, urban water supply shortages, forest fires, etc.) (Flannigan and Harrington, 1988; Nicholson et al, 1998; Austin et al 1998; De Gaetano, 1999; Evans and Geerken, 2004). Compared to other kinds of natural hazards, the spatial extent of drought is extremely larger and its influencing time is commonly much longer. Thus, the damages caused by drought are expected to be highly larger than other natural hazards (Mishra and Singh, 2010; Xu et al, 2014).
Over the past century, the global climate and environment have witnessed remarkable changes, in which global warming is one of the most striking characteristics, which leads to accelerating the rate of water circulation, thereby resulting in highly frequent extreme events such as droughts and floods at the global scale (Willems, 2000; Kunkel, 2003; Roy and Balling, 2004; Beniston and Stephenson, 2004; Christensen and Christensen, 2004; Leng et al, 2015a,b). The frequency of drought tends to increase under the context of global warming. Hence, many scientists made a lot of attempts to investigate drought, which mainly consist of spatial and temporal differences of drought (Lana et al, 2001), the mitigation of drought effects (Huang and Chou, 2008), the frequency analysis of drought (Huang et al, 2014b; Mondal and Mujumdar, 2015) and drought prediction based on various atmospheric circulation indices (Cordery and McCall, 2000). Amongst these previous studies, more efforts have been focused on developing reliable drought indices, which can be applied for earlier detection of droughts including their intensity and spatial extent. For instance, Standardized Precipitation Index (SPI) is one of the widely used indices to monitor drought as sole parameter (e.g. Hayes et al, 1999) or in combination with other meteorological indices (for Iran, Morid et al, 2006), and to make a spatial and temporal
analysis of drought (in Greece, Livada and Assimakopoulos, 2007).
However, studies focused on studying the propagation from meteorological drought to hydrological drought and their associations were highly rare (Vicente-Serrano and López-Moreno, 2005; Van Loon and Laaha, 2015; Barker et al, 2016), which is of important significance to reveal drought propagation process and mechanism, thus being helpful for establishing drought early warning system. Commonly, meteorological drought develops and ends relatively quickly, whilst hydrological drought is the result of meteorological drought. The two kinds of droughts can reflect the different stages of drought development to a certain degree. In general, the occurrence of hydrological drought is later than meteorological drought, and the corresponding propagation time depends on local landscape condition (Pandey and Ramasastri, 2001). Therefore, investigation of the propagation time from meteorological to hydrological drought and its potential influence factors has important significance for establishing an effective monitoring and warning system of hydrological drought based on meteorological drought. This system is highly helpful for the mitigation of droughts and is expected to largely decrease drought-caused damages. Therefore, investigation of the propagation from meteorological drought to hydrological drought and its potential influence factors has importantly practical meanings.
Although SPI has been widely adopted to investigate drought in various regions, it is broadly accepted that SPI with different time scales can impact the assessment of drought conditions in different regions due to the fact that the response of different usable water sources to precipitation deficit can be extremely different. The fundamental advantage of SPI is that it can be computed for a variety of time scales, which allows SPI to monitor short-term drought such as agricultural drought and long-term drought such as hydrological drought (Mishra and Singh, 2010). For instance, Szalai et al
(2000) stated that agricultural drought was characterized best by SPI at a scale of 2–3 months. Hence, the appropriate time scale of SPI can be used to reflect the propagation time from meteorological to hydrological drought. Recently, the Budyko hypothesis has been widely utilized to investigate basin-scale water and energy balances (Yang et al, 2008; Roderick and Farquhar, 2011; Wang and Hejazi, 2011b; Yang and Yang, 2011; Xu et al, 2014; Yang et al, 2014), and the Fu’s equation is one of the formulations of the Budyko curve (Yang et al, 2007; Li et al, 2013). The parameter w of the Fu’s equation modifies the partitioning of precipitation between evaporation and runoff. The Budyko hypothesis is an effective tool for investigating the interactions among climate, hydrological cycle, and vegetation (Roderick and Farquhar, 2011; Yang and Yang, 2011). Additionally, the parameter w is an empirical parameter controlling the shape of the Budyko curve and reflecting the impacts of other factors like land surface characteristics, which has strong effects on the propagation time from meteorological to hydrological drought. Some studies have found that the parameter w of the Budyko framework is associated with land surface characteristics such as soil types, vegetation cover, climate seasonality, as well as topography (Milly, 1993, 1994; Zhang et al, 2001, 2004; Yang et al, 2007, 2009; Shao et al, 2012; Williams et al, 2012). Hence, the parameter x can be regarded as an integrated parameter to reveal the impacts of underlying surface characteristics on the propagation time from meteorological to hydrological drought. Therefore, the correlations between the propagation time and the parameter w of the Fu’s equation were explored in this study aimed at revealing possible effects of the parameter w on the propagation time.
Arctic Oscillation (AO) is closely associated with the climate of middle and high latitudes regions (Hudgins and Huang, 1996).
Many studies demonstrated that meteorological, agricultural, and hydrological droughts are closely linked with climate indices such as the El Niño Southern Oscillation (ENSO) and Atlantic Oscillation (AO) (Talaee et al, 2014). Evaporation is a complex parameter controlling mass and energy exchange in atmosphere and terrestrial ecosystems, playing a critical role in the mass and heat fluxes in the global atmospheric system. Hence, it can be adopted to monitor the variations of moisture and energy shifting from the ground to the atmosphere. Therefore, the large-scale atmospheric circulation anomaly such as ENSO and AO may impact the propagation time from meteorological to hydrological drought through affecting actual evaporation.
The primary objectives of this study are: (1) to inspect the relationships between meteorological and hydrological drought based on standard quantitative indexes; (2) to examine the propagation time from meteorological to hydrological drought; (3) to explore the potential influence factors on the propagation time from the perspectives of the atmospheric circulation anomaly such as El Niño Southern Oscillation (ENSO)/Arctic Oscillation (AO) and underlying surface characteristics.
干旱是一种极端自然灾害,由降水异常减少引起(Oladipo,1985;McKee等,1993;Wilhite等,2000;Huang和Chou,2008;Wang等,2011a;Huang等,2014a,2015a,b),可能导致经济、生态和环境领域的大量损失(例如作物损失、土地退化和沙漠化、城市供水短缺、森林火灾等)(Flannigan和Harrington,1988;Nicholson等,1998;Austin等,1998;De Gaetano,1999;Evans和Geerken,2004)。与其他自然灾害相比,干旱的空间范围非常广阔,其影响时间通常要长得多。因此,干旱造成的损失预计将远大于其他自然灾害(Mishra和Singh,2010;Xu等,2014)。
在过去的一个世纪里,全球气候和环境经历了显著变化,其中全球变暖是最突出的特征之一,导致水循环速率加快,从而在全球范围内产生了极端事件,如干旱和洪水(Willems,2000;Kunkel,2003;Roy和Balling,2004;Beniston和Stephenson,2004;Christensen和Christensen,2004;Leng等,2015a,b)。在全球变暖的背景下,干旱频率往往会增加。因此,许多科学家试图研究干旱,主要包括干旱的空间和时间差异(Lana等,2001)、干旱影响的缓解(Huang和Chou,2008)、干旱频率分析(Huang等,2014b;Mondal和Mujumdar,2015)以及基于各种大气环流指数的干旱预测(Cordery和McCall,2000)。在这些先前的研究中,更多的工作集中在开发可靠的干旱指数上,这些指数可以用于更早地检测干旱,包括其强度和空间范围。例如,标准化降水指数(SPI)是用于监测干旱的广泛使用的指标之一,可以作为单一参数(例如Hayes等,1999)或与其他气象指标结合使用(对伊朗,Morid等,2006),并用于对干旱进行空间和时间分析(在希腊,Livada和Assimakopoulos,2007)。
然而,针对从气象干旱到水文干旱的传播及其关联的研究非常少见(Vicente-Serrano和López-Moreno,2005;Van Loon和Laaha,2015;Barker等,2016),这对揭示干旱传播过程和机制具有重要意义,因此有助于建立干旱早期预警系统。通常,气象干旱的发展和结束相对较快,而水文干旱是气象干旱的结果。这两种干旱可以在一定程度上反映干旱发展的不同阶段。一般来说,水文干旱的发生比气象干旱要晚一些,相应的传播时间取决于当地的地形条件(Pandey和Ramasastri,2001)。因此,从气象干旱到水文干旱的传播时间及其潜在影响因素的调查对于建立基于气象干旱的有效监测和预警系统具有重要意义。该系统对于缓解干旱非常有帮助,并且有望大幅减少干旱造成的损失。因此,研究从气象干旱到水文干旱的传播及其潜在影响因素具有重要的实际意义。
尽管SPI已被广泛应用于各个地区的干旱研究中,但普遍认为,由于不同可用水源对降水缺乏的反应可能极其不同,SPI在不同时间尺度上的应用可能会影响对不同地区干旱条件的评估。SPI的基本优势在于它可以计算各种时间尺度,这使得SPI可以监测短期干旱(如农业干旱)和长期干旱(如水文干旱)(Mishra和Singh,2010)。例如,Szalai等人(2000年)指出,SPI在2-3个月的时间尺度上最能表征农业干旱。因此,SPI的适当时间尺度可以用来反映从气象干旱到水文干旱的传播时间。最近,Budyko假设已被广泛应用于研究流域水和能量平衡(Yang等,2008;Roderick和Farquhar,2011;Wang和Hejazi,2011b;Yang和Yang,2011;Xu等,2014;Yang等,2014),而Fu方程是Budyko曲线的一种表述(Yang等,2007;Li等,2013)。Fu方程的参数w修改了降水在蒸发和径流之间的分配。Budyko假设是研究气候、水文循环和植被之间相互作用的有效工具(Roderick和Farquhar,2011;Yang和Yang,2011)。此外,参数w是控制Budyko曲线形状的经验参数,反映了其他因素如地表特征的影响,比如土壤类型、植被覆盖、气候季节性以及地形(Milly,1993,1994;Zhang等,2001,2004;Yang等,2007,2009;Shao等,2012;Williams等,2012)。因此,参数w可以被视为一个综合参数,用于揭示地表特征对从气象干旱到水文干旱的传播时间的影响。因此,本研究旨在探讨Fu方程参数w与传播时间之间的相关性,以揭示参数w对传播时间的可能影响。
北极涛动(AO)与中高纬度地区的气候密切相关(Hudgins和Huang,1996)。
许多研究表明,气象、农业和水文干旱与气候指数(如厄尔尼诺南方涛动(ENSO)和大西洋涛动(AO))密切相关(Talaee等,2014)。蒸发是控制大气和陆地生态系统中质量和能量交换的复杂参数,在全球大气系统中扮演着重要角色。因此,可以采用蒸发来监测从地面到大气的水分和能量变化。因此,厄尔尼诺南方涛动(ENSO)和大西洋涛动(AO)等大尺度大气环流异常可能通过影响实际蒸发来影响从气象干旱到水文干旱的传播时间。
本研究的主要目标是:(1)检查基于标准定量指标的气象和水文干旱之间的关系;(2)检验从气象干旱到水文干旱的传播时间;(3)从厄尔尼诺南方涛动(ENSO)/北极涛动(AO)等大气环流异常以及地表特征的角度探讨传播时间的潜在影响因素。
2. Study area and data
2.1. The Wei River Basin
The Wei River Basin (WRB), as presented in Fig. 1, is selected as a case study in this study. It lies between 103.5E–110.5E and 33.5N–37.5N, covering a total area of nearly 1.35 105 km2 .
Located in a continental monsoon climate zone, the basin is characterized by rich precipitation and high temperature in summer, and dominated by sparse precipitation and low temperature in winter. Its annual average precipitation is approximately 559 mm (Zhang et al, 2008). Generally, its precipitation varies seasonally, which in flood season (from June to September) accounts for nearly 60% of annual precipitation. Its annual precipitation also varies obviously because of the unstable features of the intensity, duration and influencing area of the subtropical high pressure belt over the northern Pacific, which shows strong impacts on local precipitation. Topographically, the altitude decreases from its highest northwest mountainous areas to its lowest Guanzhong Plain located in the southeast and southern portions. It should be emphasized that the Guanzhong Plain is a very important agricultural production zone, and agriculture plays an important role in local economic development. Additionally, many industrial parks also have been built in this plain, whose normal operations need a large amount of water. Nevertheless, in recent decades, the runoff of this basin has significantly decreasing trends (Huang et al, 2014b), and it frequently suffers from droughts (Huang et al, 2014c). Thus, its available water resources are scarce, failing to satisfy the water demand of local socioeconomic and ecoenvironmental developments.
该研究选择了位于103.5E–110.5E和33.5N–37.5N之间的渭河流域(WRB)作为案例研究。该流域总面积约为1.35 × 10^5 km²。
渭河流域位于大陆季风气候区,夏季降水丰富,气温较高,冬季降水稀少,气温较低。其年平均降水量约为559毫米(张等,2008)。一般来说,其降水呈季节性变化,洪水季节(6月至9月)降水量约占年降水量的60%。由于北太平洋副热带高压带的强度、持续时间和影响范围的不稳定特征,其年降水量也明显变化,这对局地降水产生了很大影响。从地形上看,从最高的西北山区到位于东南部和南部的最低点的关中平原,海拔逐渐降低。需要强调的是,关中平原是一个非常重要的农业生产区,农业在当地经济发展中发挥着重要作用。此外,许多工业园区也建在这片平原上,其正常运行需要大量水资源。然而,在近几十年里,该流域的径流呈显著下降趋势,经常遭受干旱(黄等,2014b)。因此,其可利用水资源稀缺,无法满足当地社会经济和生态环境发展的需求。
2.2. Data set
Daily precipitation data collected from 21 meteorological stations in the WRB and its adjacent areas were utilized in this study, whose locations are displayed in Fig. 1. Each station has precipitation data spanning January 1st, 1960–December 31st, 2008, which were acquired from the National Climate Center (NCC) of the China Meteorological Administration (CMA). The monthly Nino 3.4 Index time series covering 1960–2008 collected from the NOAA Earth System Research Laboratory (http://www.esrl.noaa.gov/ psd/data/correlation/nina34.data) was used to characterize ENSO events in this study. The monthly AO series during 1960–2008 was acquired from the National Oceanic and Atmospheric Administration (NOAA). Furthermore, Potential evapotranspiration (PET) values of the meteorological stations were calculated through the Penman-Monteith equation (Allen et al, 1998), whilst S. Huang et al / Journal of Hydrology 547 (2017) 184–195 185
corresponding annual actual evaporation in the WRB was calculated through water balance equation.
Daily natural runoff data at Huaxian, Zhangjiashan and Linjiacun hydrological stations in the middle and lower reaches of the WRB were acquired from the hydrologic manual. Each station has runoff data spanning January 1st, 1960–December 31st 2008.
Huaxian station is in the lower reaches of the basin, and its catchment area occupies approximately 97.16% of the whole basin.
Therefore, the runoff of Huaxian station can be regarded as the runoff of the whole basin. Zhangjiashan station is in the lower reaches of the Jinghe River which is the largest tributary of the Wei River, whilst Linjiacun station is located in the upper reaches of the basin.
该研究利用了来自21个气象站在渭河流域及其邻近地区收集的日降水数据,这些站点的位置如图1所示。
每个站点都有从1960年1月1日至2008年12月31日的降水数据,这些数据是从中国气象局国家气候中心(NCC)获得的。
本研究利用了美国国家海洋和大气管理局(NOAA)地球系统研究实验室(http://www.esrl.noaa.gov/psd/data/correlation/nina34.data)收集的1960年至2008年的每月Nino 3.4指数时间序列来描述本研究中的ENSO事件。
1960年至2008年的每月AO系列数据是从美国国家海洋和大气管理局(NOAA)获得的。此外,通过Penman-Monteith方程(Allen et al, 1998)计算了气象站的潜在蒸散发(PET)值,而渭河流域的年实际蒸发量是通过水量平衡方程计算的。
渭河流域中下游地区的华县、张家山和临洮村水文站的日自然径流数据是从水文手册中获取的。
每个站点都有从1960年1月1日至2008年12月31日的径流数据。
华县站位于流域下游,其集水面积约占整个流域的97.16%。
因此,华县站的径流可以视为整个流域的径流。张家山站位于渭河最大支流泾河的下游,而临洮村站位于流域上游。
3. Methodology
In this study, SPI and Standardized Streamflow Index (SSI) were adopted to characterize meteorological and hydrological droughts, respectively. The parameter w of the Fu’ equation was used to roughly characterize integrated land surface characteristics. The heuristic segmentation method was applied to identify possible change points of annual runoff series in the WRB, whilst the cross wavelet analysis of AO/ENSO and evaporation was to reveal the impact of the atmospheric circulation anomaly on the propagation from meteorological to hydrological drought.
3.1. The heuristic segmentation method
Pedro et al (2001) recommended the heuristic segmentation method to partition a non-stationary time series of interest into several stationary segments, a sliding pointer moves from left to right. The averages of the sub-series in the left denoted as l1 and right denoted as l2 are calculated. For two Gaussian-distributed random series, the difference between the averages of the two sub-series l1 and l2 under a statistical significance is estimated through the Student’s t-test statistic as follows:
where
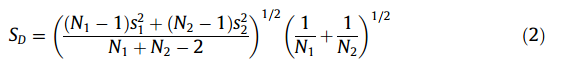
represents the pooled variance, sl and s2 denotes the standard deviations of the two time series, N1 and N2 represent the length of the two series. Through moving the pointer along the given time series step-by-step, the statistic t is calculated to assess the difference between the averages. The largest t value is regarded as a possible candidate for the cut point. Then, the statistical significance P(tmax) is calculated. Considering that P(tmax) is not the standard Student’s t-test since the series are not independent and cannot be gained in a closed analytical form. P(tmax) is approximately computed as follows:
![]()
where \eta =4.19lnN-11.54 and
\delta = 0.40, which are obtained from the Monte Carlo simulations, N is the number of the time series, v = N-2, and Ix (a, b) denotes the incomplete beta function. If the difference between the two averages is not statistically significant (e.g., P(t_{max}) is less than the threshold (P_0) of 0.95), the time series will not be divided. Conversely, the time series is partitioned into two segments with significantly different averages. If the time series is split, the iteration of the above procedures on each new segment will continue until the acquired significant value is less than the threshold or the length of the acquired segments is smaller than the presupposed minimum segment length (l_0).
3.2. Standardized precipitation index (SPI)
McKee et al (1993) first proposed the SPI to characterize the drought conditions in Colorado. The SPI can be adopted to indicate the precipitation conditions in a specific period in a long time series and shows the precipitation deficits corresponding to the period. Since the SPI can capture the drought features at various time scales (1, 3, 6, 9, 12, 24, 48 months), it has been broadly applied to investigate different aspects of droughts (McKee et al, 1993; Logan et al, 2010; Kao and Govindaraju, 2010). Besides, the SPI can monitor the short-term water supplies, which is crucial for water management and agricultural production. Short-term shortages of soil moisture may lead to strong influences on agricultural production, thereby triggering agricultural droughts (Mishra and Singh, 2010).
The calculation of SPI is based on the long time precipitation observation data on a specific time scale. The long-term precipitation observation data usually follows a probability distribution, which is subsequently converted to a standard normal distribution (McKee et al, 1993). Firstly, the moving average monthly precipitation series which comes from the original precipitation series at a given meteorological station is calculated at a given time scale.
Then, the gamma probability distribution function is employed to fit the average monthly precipitation series at the given time scale.
Ultimately, the SPI value is calculated by converting the cumulative probabilities based on the Gamma distribution to a standard normal distribution (McKee et al, 1993; Kao and Govindaraju, 2010). The SPI can be calculated as follows:
3.3. Standardized streamflow index (SSI)
The SSI was used to characterize hydrological drought in this study. Note that streamflow series is highly biased and scarcely follow normal distribution, it is necessary to standardize the probability distribution of streamflow series. Vicente-Serrano et al (2012) concluded that in most cases (>95% for each monthly runoff series), the Pearson III distribution fits runoff series well.
Hence, the Pearson III distribution was chosen for computing the hydrological drought index in this study. Since it is on the basis of the concept of SPI, outlined in the above section, the detailed procedures are omitted in this paper, which can be referred to Sergio et al (2012).
本研究采用SSI来表征水文干旱。需要注意的是,流量序列存在严重偏差,并且很少遵循正态分布,因此有必要对流量序列的概率分布进行标准化。Vicente-Serrano等人(2012)得出结论,在大多数情况下(每个月的径流系列中超过95%),Pearson III分布很好地拟合了径流系列。
因此,本研究选择了Pearson III分布来计算水文干旱指数。由于它基于SPI的概念,本文中省略了详细的流程,可以参考Sergio等人(2012)的研究。
3.4. The cross wavelet transform
The cross wavelet analysis developed by Hudgins et al (1993) is n an effective tool for exploring the correlations between two correlated time series. It is a new technique combined with the cross
spectrum analysis and wavelet transform, and it can preferably examine the linkages between two time series in time-frequency domain (Hudgins and Huang, 1996; Torrence and Compo, 1998).
The cross wavelet transform of the two time series x_n and y_n can be defined as W^{XY} =W^ XW^{Y*} , where * stands for their complex conjugation.
Their cross wavelet power is defined as |W^{XY}|. The complex argument arg(W^{xy}) can be regarded as the local relative phase between x_n and y_n in both time and frequency fields. The theoretical distribution of the cross wavelet power with their background power spectra P^X_k and P^Y_k was referred to Torrence and Compo (1998), which is expressed as follows:
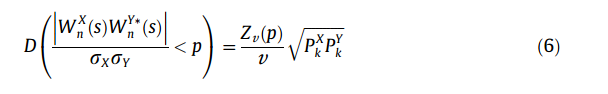
where Zv(p) denotes the confidence level associated with the probability p of a probability distribution function which is defined by the square root of the product of two \chi ^2 distributions (Grinsted et al, 2004). The relevant codes can be downloaded freely in the following website: http://www.pol.ac.uk/home/research/waveletcoherence/.
3.5. The Fu’s equation based on the Budyko hypothesis
Budyko (1974) found that the ratio of actual evapotranspiration to precipitation is determined by the ratio of potential evaporation to precipitation. Henceforth, the governing equations based on the Budyko hypothesis have been proposed by numerous hydrologists (e.g., Milly, 1994; Fu, 1981). Fu (1981) provided a solid theoretical derivation of the coupled water-energy balance equation, which is referred to as the Fu’s equation, thus facilitating the application of the Budyko hypothesis. More details can be referred to Zhang et al
(2004). Eq. (7) proposed by Fu (1981) was adopted in this study.
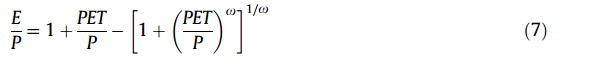
where E, P, and PET represent actual evapotranspiration, precipitation, and potential evapotranspiration, respectively; w is an integration constant fitted by the least square method based these meteorological data, which can fully reflect the underlying surface characteristics (e.g., vegetation cover, geomorphic feature, and soil property) (Milly, 1993; Zhang et al, 2004; Yang et al, 2007; Williams et al, 2012; Shao et al, 2012).
4. Results and discussions
4.1. Identification of possible change points in annual runoff series
Our previous studies (Zhao et al, 2014; Huang et al, 2014b, 2015b) found that the annual runoff at the three stations has remarkably decreasing trends. Hence, the runoff series in the WRB may have some change points and its stationarity may be invalid. The heuristic segmentation method was adopted to identify possible change points in the annual runoff and precipitation series at the three stations in the WRB. The threshold P0 was set to 0.95 and ‘0 was set to 25. The segmentations and change points identification of the annual runoff and precipitation series at the three stations are exhibited in Fig. 2. It can be seen from Fig. 2A1 that a change point (1969) in the annual runoff series at Zhangjiashan station was identified in the first iteration due to the condition that P (tmax) = 0.98 > P0, whilst no change point was detected in the second iteration due to the condition that P(tmax) = 0.87 < P0. In Fig. 2A2, no change point in the annual precipitation series at Zhangjiashan was found due to the condition that P(tmax) = 0.83 < P0. Likewise, two S. Huang et al / Journal of Hydrology 547 (2017) 184–195 187 change points (1969 and 1993) in the annual runoff at Linjiacun station and one change point (1993) in the annual runoff at Huaxian station, whilst the annual precipitation series at the two stations also has no change point. In general, the precipitation in the WRB has no obvious changes and change point, whilst its runoff shows remarkable changes and change points.
4.2. The propagation time from meteorological to hydrological drought
The fundamental advantage of SPI is that it can be computed at different time scales, which can be used to monitor short-term and long-term water resources. In order to investigate the propagation time from meteorological to hydrological drought, the relationships between SSI and SPI series with different time scales were explored. The correlation coefficients between the monthly SSI and SPI series with various time scales at the three stations in the WRB are illustrated in Figs. 3–5, respectively.
It can be easily seen from Fig. 3 that the propagation time from meteorological to hydrological drought in the Jing River (the basin above Zhangjiashan station) has noticeably seasonal characteristics, which is mainly characterized by the Loess Plateau and its ecology and environment are highly fragile. In the Fig. 3, the x-axis denotes various time scales of SPI (1-month, 3-month, 6month, 9-month, ... , 21-month), and y-axis represents different months, while the color bar denotes the correlation coefficients between SSI and SPI series, in which deep red and blue colors denote high and low correlation coefficients, respectively. High correlation coefficients (>0.7) are concentrated in spring and summer (March–August) with varying time scales from 3 to 9 months.
Specifically, the correlation coefficient between SSI and SPI series in the basin above Zhangjiashan station in July at 1-month timescale is 0.77, whilst that in May at 3-month and 6-month timescales are 0.79 and 0.77, respectively. Roughly, the propagation time in summer is approximately 3 months, which is relatively shorter than other seasons, probably owing to the higher temperature in summer than other seasons. Note that there is some snow in winter in this area, and most of snow melts in the next spring.
Therefore, the longer propagation time (approximately 6 months) in spring than summer is likely resulted from snowmelt. Regarding
autumn and winter, the correlations between monthly SSI and SPI are relatively low (nearly 0.42), and their propagation time is relatively long (6–12 months), possibly as a consequence of the water stored in the soils during the preceding months.
Similarly, Fig. 4 shows that the propagation time from meteorological to hydrological drought in the basin above Linjiacun also has obviously seasonal characteristics. However, the corresponding correlation coefficients of the monthly SSI and SPI series with various time scales at Linjiacun station are higher than those in the basin above Zhangjiashan. In general, the propagation time from meteorological to hydrological drought in this area is longer than that in the basin above Zhangjiashan. The primary reason may lie in the location of the basin above Linjiacun, which is located in the upper reaches of the WRB with a large amount of snow in winter. The snow covers some mountains and even exists in next summer in the upstream of the basin above Linjiacun. The snowmelt in this area therefore accounts for the longer response time than that in the basin above Zhangjiashan to a certain extent.
Regarding the whole basin, the propagation time from meteorological to hydrological drought also has remarkably seasonal characteristics. The correlation coefficients of the monthly SSI and SPI series with various time scales fall in between those in the basin above Zhangjiashan and Linjiacun (Fig. 5). The highest correlations (nearly 0.75) occur in February–April at 6-month timescale, whilst the lowest correlations (approximately 0.18) occur in October– December at 1-month timescale (Fig. 5). Roughly, the propagation time in the spring, summer, autumn and winter is approximately 6, 3, 9 and 12 months in the WRB, respectively.
4.3. The linkages between hydrological drought and meteorological drought
In order to provide detailed evidence for the usefulness of SPI with different time scales and to reveal the detailed linkages between hydrological drought and meteorological drought, the cross wavelet analysis was employed in this study. Hence, the average 6-month SPI series in February–April and the average 1month SPI series in October–December in the WRB were respectively used to explore their correlations with the corresponding
average 1-month SSI series. Based on the Morlet wavelet, the cross wavelet transform between the average 1-month SPI series in October–December/the average 6-month SPI series in February– April and the corresponding average 1-month SSI series are shown in Fig. 6. Note that in Fig. 6, the 5% confidence level against red noise is exhibited as a thick contour, and the relative phase relationship is denoted as arrows (with negative correlations pointing left, and positive associations pointing right).
It can be observed from Fig. 6A that the relationships between the average 1-month SPI series in October–December and the corresponding average 1-month SSI series in the WRB is primarily positive. Dramatically, they have statistically positive correlations with a period of 4 years in 1997–2007 and with a period of nearly 6 years in 1962–1986. Generally, the 1-month SPI series show positive associations with the corresponding 1-month SSI series on relatively long time scales (approximately 4–8 years), which may be closely associated with the large-scale atmospheric circulation, except that they have non-statistically positive relationships on relatively short time scales (nearly 1–4 years) during 1976–1983.
However, Fig. 6B indicates that the average 6-month SPI series in February–April shows statistically significantly positive correlations with the corresponding average 1-month SSI series on both long and short time scales ranging from 1 to 10 years. In practice, the response of hydrological drought to meteorological drought is determined by the large-scale atmospheric circulation and local underlying surfaces at both long and short time scales, respectively (Medved-Cvikl et al, 2012). Thus, the findings of Fig. 6B are more reasonable than Fig. 6A in reflecting the linkages between hydrological and meteorological droughts, thereby further verifying the usefulness of SPI at different time scales when monitoring hydrological drought. Additionally, there is noticeable shifts in the statistically positive correlations from long time scales (6–10 years) to short time scales (1–4 years), implying that intensifying local underlying surfaces are playing a more and more important role in influencing the propagation from meteorological to hydrological drought in the WRB.
In order to reveal the detailed influence of the large-scale atmospheric circulation anomaly on the propagation time from meteorological to hydrological drought, the wavelet cross analysis was
applied to analyze the correlations between annual actual evaporation in the WRB and average monthly ENSO/AO values in 1960–2008. The cross wavelet transforms between annual actual evaporation and average monthly ENSO/AO values are exhibited in Fig. 7. Generally, Fig. 7A exhibits strong negative correlations with ENSO events. Specifically, it has significantly negative linkages with ENSO events with periods of 3–4 years in 1964–1972 and with periods of 4–7 years in 1978–1992 at the 95% confidence level. Similarly, in general, Fig. 7B shows that actual evaporation in the WRB has strong positive correlations with AO. Specifically, it exhibits statistically positive correlations with AO with periods of 2–4 years in 1960–1970 at the 95% significance level. Hence, the large-scale atmospheric circulation such as ENSO and AO shows strong linkages with actual evaporation, thus strongly influencing the propagation time from meteorological to hydrological drought.
Fig. 7 further verifies that the large-scale atmospheric circulation anomaly has strong impacts on the propagation time from meteorological to hydrological drought at relatively long timescales, which is consistent with the analysis result of Fig. 6B that the large-scale atmospheric circulation anomaly can influence the propagation time from meteorological to hydrological drought at relatively long timescales (approximately 4–8 years).
4.4. The dependence of the propagation time from meteorological to hydrological drought on the underlying surface characteristics
As mentioned above, underlying surface characteristics including soil type, vegetation cover and topography type show strong effects on the propagation time from meteorological to hydrological drought, and the impacts tend to be stronger. It should be emphasized here that the parameter w of the Fu’ equation based on the Budyko framework can reflect the general influence of land surface characteristics on the response of hydrological drought to meteorological drought. Therefore, the parameter w during different time periods was calculated in this study to analyze the tendency between the propagation time from meteorological to
hydrological drought and underlying surface characteristics. The relationships between annual E/P and annual E0/P at the three stations are exhibited in Fig. 8. It can be seen from Fig. 8 that the Budyko curves in the three basins are similar to a great extent.
The w values of the basin above Zhangjiashan, the basin above Linjiacun and the whole basin are 3.34, 3.08 and 3.23, respectively.
The w value in the basin above Zhangjiashan is the largest among the three basins, indicating that the evaporation in the basin above Zhangjiashan is larger than those of other basins when E0/P remains unchanged.
In order to analyze the tendency between propagation time and the parameter w synthetically reflecting the impacts of land surface characteristics, the propagation time and w values in the period before and after the change points in the annual runoff series at the three stations were computed, and the results are displayed in Table 1. Regarding the w differences in various basins, possible cause is the different land topography and vegetation cover, 3.43 for the upper catchment of Zhangjiashan and 3.08 for the upper catchment of Linjiacun. Yang et al (2014) revealed a logarithmic relationship of n of Choudhury-Yang equation (similar to the w
of the Fu’s equation) for the Budyko hypothesis with catchment slope. Li et al (2013) reported that the basin-specific w was linearly correlated with the long-term mean annual vegetation cover.
Consequently, the larger slope and denser vegetation in the upper catchment of Linjiacun may lead to smaller w. The detailed reasons should be further investigated in the future study. It can be observed from Table 1 that all of the w values at the three basins have increasing trends, which is consistent with the findings of Jiang et al (2015). Meanwhile, the corresponding propagation time also has upward tends (Table 1). Roughly, the propagation time is positively correlated with the parameter w values in these basins.
For several decades, the soil and topography types can be regarded as unchanged in a specific basin, the changes in vegetation cover therefore can directly affects w value, thus influencing the propagation time from meteorological drought to hydrological drought.
Note that soil loss is extremely severe in the WRB. Hence, the water and soil conservation practices including building afforestation, check dams, grass-planting, and creation of level terraces have been conducted since 1960. The areas of soil conservation practices in the WRB are displayed in Table 2. It can be observed from Table 2 that the areas of afforestation and grass-planting have increased rapidly since 1990, which after 1990 is highly larger than that before 1990. Consequently, the increasing forests and grass store more water in soils during the preceding months. Therefore, the propagation time from meteorological to hydrological drought tends to be longer after the change point in annual runoff series than that before the change point in the WRB. This finding further verifies the accuracy of the analysis result of Fig. 6B that underlying surface characteristics such as land cover can impact the propagation time from meteorological drought to hydrological drought at relatively short time scales (nearly 1–4 years).
4.5. Discussions
Since the streamflow data adopted in this study are natural streamflow series, which were reconstructed through water balance calculation and considered the impacts of human activities such as reservoir regulation and water withdrawal. Hence, for the direct human activities such as reservoir regulation and water withdrawal, their influences have been excluded in this study.
However, for underlying surface changes such as expansion areas of afforestation and grass-planting, because these data are unavailable for us, their influences cannot be excluded. Nevertheless, the cross wavelet analysis adopted in this study is a new technique combined with the cross spectrum analysis and wavelet transform, and it can preferably reveal the linkages between two time series in both time and frequency domains (Hudgins and Huang, 1996; Torrence and Compo, 1998). As observed in Fig. 6B, the 6-month SPI series and the corresponding 1-month SSI series has statistically positive correlations on both long and short time scales ranging from 1 to 10 years. In practice, the response of hydrological drought to climate drought is determined by the large-scale atmospheric circulation and local underlying surfaces at both long and short time scales, respectively (Medved-Cvikl et al, 2012). For the cross wavelet analysis, it can also capture the impact of expansion areas of afforestation and grass-planting on the propagation time from meteorological to hydrological drought. Therefore, it is not necessary to quantify relative contributions of the climate and direct human impacts on streamflow in the WRB first when investigating the propagation from meteorological drought to hydrological drought. There are some studies on establishing the relationships of the long-term average values of parameters in the Budyko-type equations of basins to the factors such as climate, vegetation cover, geomorphology, or proportions of irrigated land and basin (Yang et al, 2007; Han et al, 2011; Li et al, 2013). These relevant factors are commonly treated as constant. However, in practice, some of them like irrigated land area in the watershed can be altered over years. Consequently, the shape of the Budyko-type curve for the watershed is probably changed. Jiang et al (2015) found that the parameter w of the Budyko-type curve in the WRB has obvious increasing trends, which was consistent with the results of this study. As mentioned above, the parameter w is closely related with land surface characteristics such as soil types, vegetation cover, climate seasonality and topography, and it can be regarded as an integrated parameter and be roughly reflected their combined effects. Thus, it has been very difficult for us to distinguish the specific contributions of these factors to the increasing parameter w at present, which needs to be further investigated in the future study.
A recent study Barker et al (2016) also investigated the propagation from meteorological to hydrological drought using standardized indicators, and analyzed the influences of climate and catchment properties on the hydrological drought characteristics and propagation. Differently, they explored the relationship between the standard-period average annual rainfall (SAAR) and SSI to reveal the influences of climate on the propagation from meteorological to hydrological drought, whilst we examined the linkages between ENSO/AO and actual evaporation to reveal the influences of climate on the propagation. Moreover, they explored the impacts of detailed catchment properties such as catchment storage, altitude, area, base flow index, etc., on the propagation time, whilst we examined the impact of the parameter w of the Fu’s equation which synthetically reflects underlying surface characteristics on the propagation time. Furthermore, the method their used is to calculate the Spearman correlations, whilst that we applied is the cross wavelet analysis which can reveal the correlations between two series in time-frequency domain.


 125
125


 被折叠的 条评论
为什么被折叠?
被折叠的 条评论
为什么被折叠?
 到【灌水乐园】发言


