


 该博客包含四个MATLAB实验,涉及数字信号处理的基础概念。实验一和实验二展示了如何使用`impulse`函数计算传递函数的冲激响应,并用图形显示。实验三通过`conv`函数演示了线性卷积的过程。实验四则分别展示了不同传递函数的阶跃响应和使用外部输入信号进行系统模拟。
**
实验二
**
实验内容

题目一:
clear all;
ts=0;te=5;dt=0.01;
num=[0 3 2];
den=[1 5 6];
sys=tf(num,den);
t=ts:dt:te;
y=impulse(sys,t);
plot(t,y);grid;xlabel('time(sec)');ylabel('h(t)')

题目二:
clear all;
ts=0;te=5;dt=0.01;
num=[0 0 1];
den=[2 1 8];%zuo
sys=tf(num,den);
t=ts:dt:te;
y=impulse(sys,t);
subplot(1,2,1)
plot(t,y);grid;xlabel('time(sec)');ylabel('h(t)')
subplot(1,2,2)
step(num,den);
axis([-5 30 0 0.4])

题目三:
t1=-1:0.01:3;
t2=0:0.01:4;
f1=1.*(t1>1)-1.*(t1>2);
f2=1.*(t2>2)-1.*(t2>3);
c=0.01*conv(f1,f2);
t3=-1:0.01:7;
subplot(3,1,1);plot(t1,f1);grid
subplot(3,1,2);plot(t2,f2);grid
subplot(3,1,3);plot(t3,c);grid

题目四:
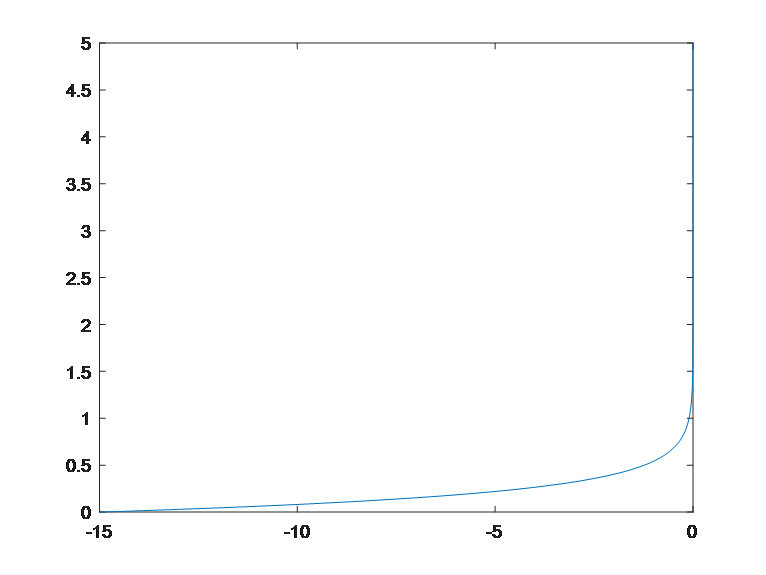
4.1:
clear all;
ts=0;te=5;dt=0.01;
a=[0 1 5];
b=[0 3 0];
sys=tf(b,a);
t=ts:dt:te;
y=impulse(sys,t);
plot(y,t)
4.2:
clear all;
ts=0;te=5;dt=0.01;
a=[1 2 1];
b=[0 2 0];
sys=tf(b,a);
t=ts:dt:te;
y=exp(2*t).*(t>0);
lsim(sys,y,t)


 1603
1603

 被折叠的 条评论
为什么被折叠?
被折叠的 条评论
为什么被折叠?
 到【灌水乐园】发言


