


👨🎓个人主页:研学社的博客
💥💥💞💞欢迎来到本博客❤️❤️💥💥
🏆博主优势:🌞🌞🌞博客内容尽量做到思维缜密,逻辑清晰,为了方便读者。
⛳️座右铭:行百里者,半于九十。
📋📋📋本文目录如下:🎁🎁🎁
目录

💥1 概述
文献来源:
大多数异常值检测算法基于惰性学习或暗示二次复杂性。这两种特性都使它们不适合大数据和流数据应用,并排除了它们在必须自主运行的系统中的适用性。在本文中,我们提出了一种称为SDO(稀疏数据观察者)的新算法,用于根据低密度数据模型估计异常值。SDO是一个渴望学习的人;因此,应用阶段的计算成本大大降低。我们使用各种合成数据集以及文献中发表的主要数据集进行测试,以进行异常检测测试。结果表明,SDO与排名最高的异常值检测替代方案具有令人满意的竞争性。良好的检测性能加上低复杂性使SDO具有高度的灵活性,并可适应独立框架,这些框架必须以与惰性学习算法相当的准确率快速检测异常值。
原文摘要:
Abstract:
Most outlier detection algorithms are based on lazy learning or imply quadratic complexity. Both characteristics make them unsuitable for big data and stream data applications and preclude their applicability in systems that must operate autonomously. In this paper we propose a new algorithm—called SDO (Sparse Data Observers)—to estimate outlierness based on low density models of data. SDO is an eager learner; therefore, computational costs in application phases are severely reduced. We perform tests with a wide variation of synthetic datasets as well as the main datasets published in the literature for anomaly detection testing. Results show that SDO satisfactorily competes with the best ranked outlier detection alternatives. The good detection performance coupled with a low complexity makes SDO highly flexible and adaptable to stand-alone frameworks that must detect outliers fast with accuracy rates equivalent to lazy learning algorithms.
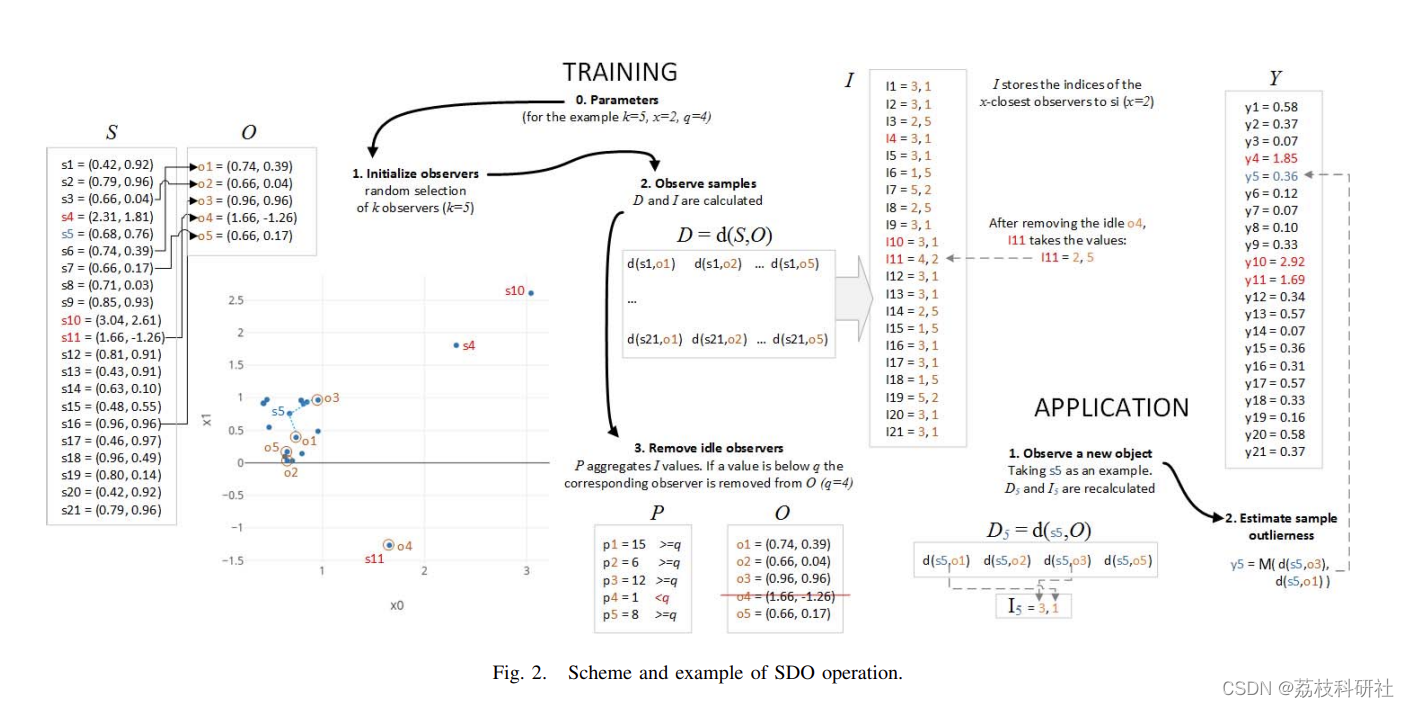
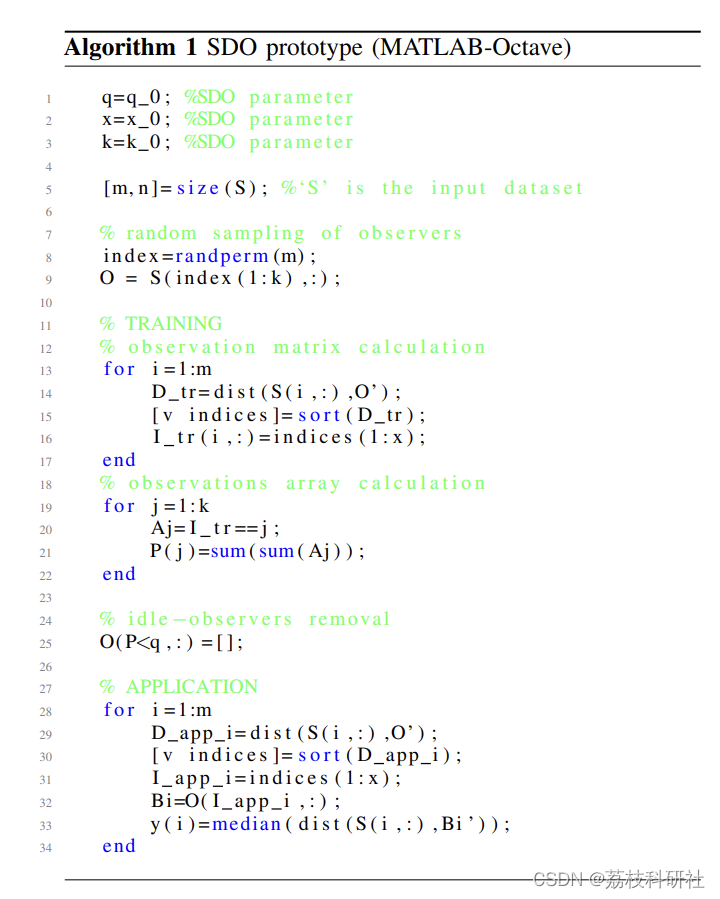
SDO是一种算法,它通过估计基于距离的异常值对数据样本进行评分。与其他异常值检测算法一样,SDO在训练阶段创建数据集的低密度模型,然后将新样本与创建的模型进行比较。这种方案允许在应用阶段减轻计算负载,不需要再次调用旧数据样本。
SDO被设计为嵌入到自主运行的系统或框架中,并且必须以连续的方式处理大量数据。SDO是用于大数据和流数据应用程序的机器学习解决方案。
发现数据中的异常值,无论是用于删除(即数据清理)还是用于仔细分析异常,已成为任何处理数据的应用程序中几乎不可或缺的步骤。尽管从不同的角度来看,方法通常通过测量多维数据空间中的距离或密度来建立异常值分数。在文献中提出的各种技术中,基于异常值检测的k- 最近邻(k-nn) [1] 或局部异常因子 (LOF) [2],尽管有许多变化和演变 [3],但由于其可靠性 [4],仍然是脱颖而出的因子。
从根本上说,异常值检测算法面临的挑战是:
2)非极端物体的不确定性
如果没有外部参考或基准,异常值仅根据被测数据的上下文进行定义。这一事实会引起不确定性,因为正态性(对于应用程序上下文)不一定根据密度或距离来定义,或者不是均匀定义的。虽然极值很清楚,但中间值有时可能难以解释[7]。
3) 参数化
性能通常取决于可能难以估计、不直观的参数,或者在数据发生变化时需要重新调整[4]。
4)嵌入决策过程
最准确的异常值检测方法通常基于惰性学习器,这意味着在评估新对象时(即在应用程序阶段)需要大量的计算工作。此外,它还涉及存储旧数据的巨大空间。这是两个相关的缺点,阻碍了将异常值检测嵌入到预期自主工作并根据持续收集的数据做出快速决策的系统中。
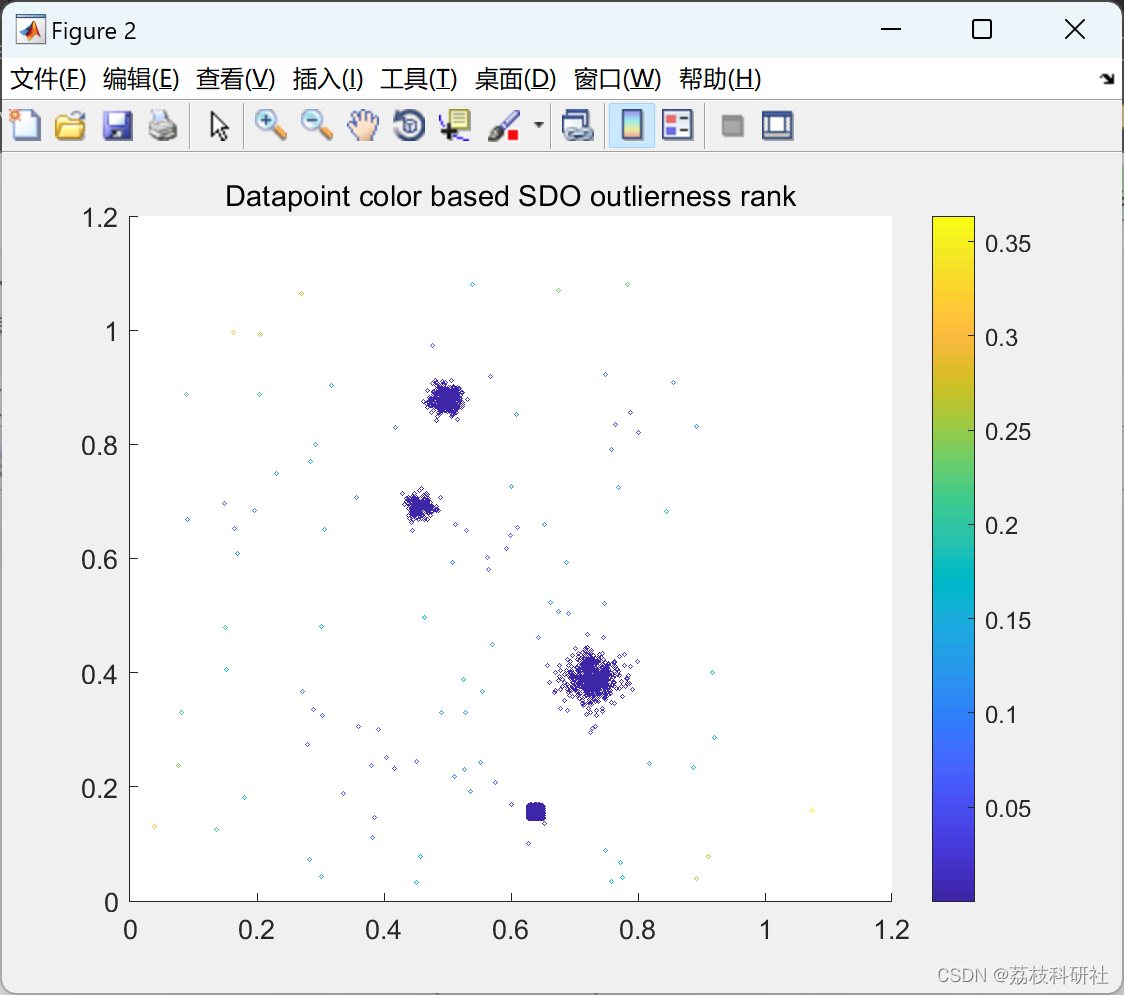
在本文中,我们提出了用于异常值检测和排序的SDO(稀疏数据观察者)算法。SDO构建由观察者形成的低密度数据模型。观察者是放置在数据群中的数据对象,理想情况下与同一集群中的其他观察者等距。数据对象的异常值是根据到其距离来评估的x-最接近的观察者(图 2 显示了二维数据集的 SDO 排名的可视化示例)。
SDO在使用具有高度可变结构,参数和维度的合成集群样数据集的实验中获得了非常好的性能。此外,当使用与基准存储库中相同的数据集和索引进行测试时,SDO显示出与Campos等人[4]分析的方法相同的性能。这个存储库[4]可能是最近(2016年)和最详尽的算法之间的异常值排名和检测比较。
📚2 运行结果
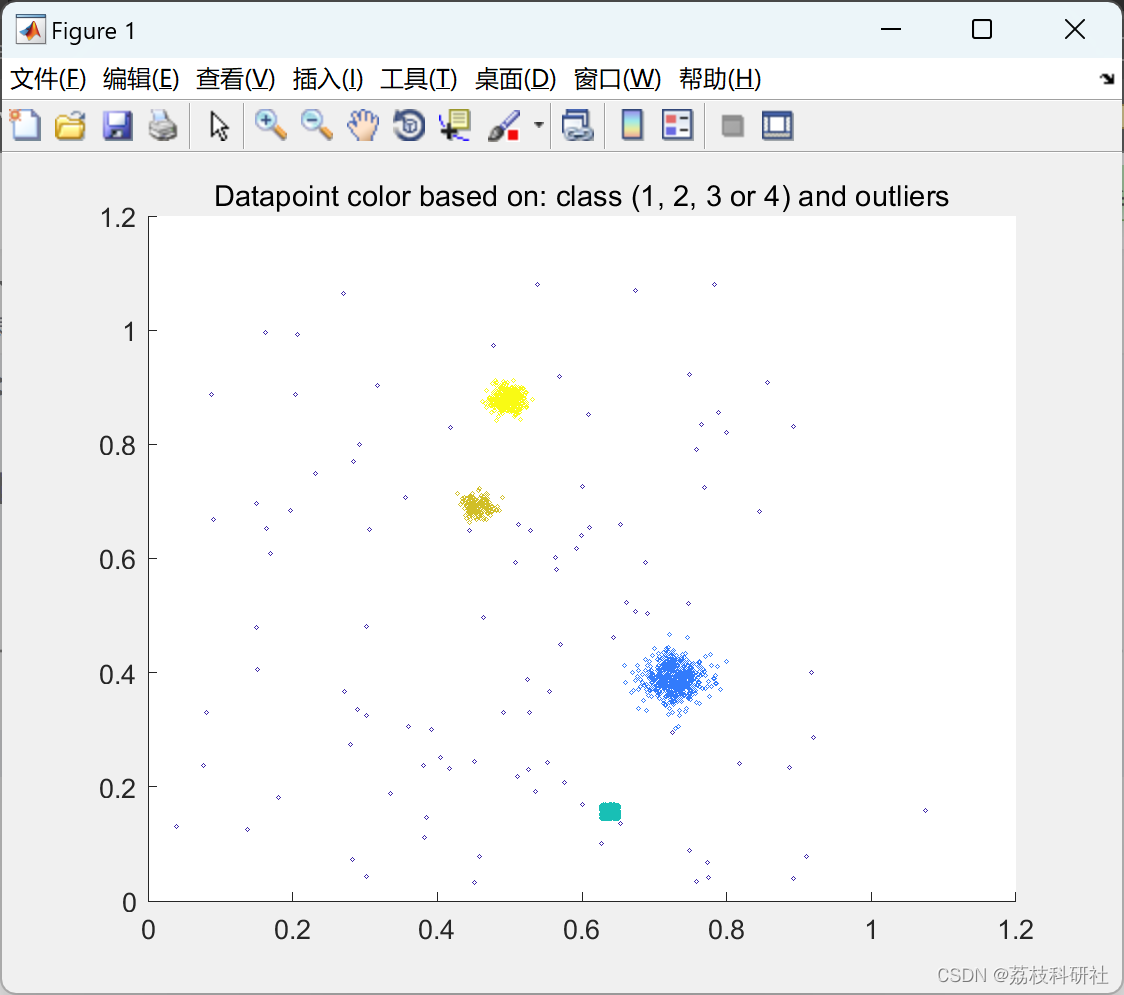
部分代码:
% Inputs:
% data, training dataset
% param.
% k, number of observers
% q, observation threshold
% qv, quantile threshold for 'q' calculation
% x, closest observers
% sd, random seed
% hbs, histogram-based selection of observers flag
% ynorm.c, constant for score amplification
%
% Outputs:
% y, outlierness score
% observers, i.e., set of point with the SDO low density model
% param.
% m, number of samples
% n, number of dimensions
% kp, number of active observers
% ynorm.ave, mean of scores
% ynorm.std, standar deviation of scores
% ynorm.min, minimun score
[m,n]=size(data);
if exist('param')==0, param=[];end
if isfield(param,'k')==0,
% Caclulation of 'k' if not defined
% 'k' is established based on sample size for finite populations using the
% variance of PCA most important parameter
[c_pca,s_pca] = princomp(data);
sigma = std(s_pca(:,1));
if sigma<1,sigma=1;end
error = 0.1*std(s_pca(:,1));
[ param.k ] = sample_size( m, sigma, error );
end
if isfield(param,'x')==0, param.x= 5; end % default value for 'x' if not defined
if isfield(param,'sd')==0, param.sd= 1000; end % default value for 'sd' if not defined
if isfield(param,'hbs')==0, param.hbs= 0; end % 'hbs=0' by default
if (param.sd>0)
%if sd<=0, the script does not seed the random number generator
rng(param.sd);
end
param.m=m;
param.n=n;
k=param.k;
%q=param.q; (below)
x=param.x;
hbs=param.hbs;
r=[];
% if histogram-based sampling is desired
if (hbs)
dataLC=hbdiscret(data,k);
[mLC,n]=size(dataLC);
k=min(mLC,k);
else
mLC=m;
dataLC=data;
end
% ------------- TRAINING ------------
ind=randperm(mLC);
observers = dataLC(ind(1:k),:);
for i=1:m
distA=dist(data(i,:),observers');
[val indA]=sort(distA);
closest(i,:)=indA(1:x);
end
for i=1:k
A=closest==i;
A=sum(A');
iMXi=ones(m,n);
iMXi=bsxfun(@times, iMXi,observers(i,:));
AX=bsxfun(@times, data,A');
AXs=AX(A>0,:);
AXs=median(AXs);
actM(i)=sum(sum(A));
end
if isfield(param,'qv')==0, param.qv=0.3; end % 'qv=0.3' by default
if isfield(param,'q')==0,
% if 'q' is not defined, 'q' is calculated based on 'qv'
param.q = quantile(actM,param.qv)+1;
end
q=param.q;
observers(actM<q,:)=[];
[kp,n]=size(observers);
param.kp=kp;
% ------------- APPLICATION ------------
for i=1:m
a=data(i,:);
distB=dist(a,observers');
[val indB]=sort(distB);
xb=min(length(indB),x);
BX=observers(indB(1:xb),:);
y(i)=median(dist(a,BX'));
end
yc=2;
param.ynorm.ave=mean(y);
param.ynorm.std=std(y);
param.ynorm.c=yc;
y=yc*zscore(y);
param.ynorm.min=min(y);
y=y-min(y);
end
🎉3 参考文献
部分理论来源于网络,如有侵权请联系删除。
[1]F. Iglesias, T. Zseby, A. Zimek. Outlier Detection Based on Low Density Models. Proc. IEEE International Conference on Data Mining Workshops, ICDM Workshops, Singapore; 11-17-2018 – 11-20-2018. pp. 970 – 979.


 559
559


 被折叠的 条评论
为什么被折叠?
被折叠的 条评论
为什么被折叠?
 到【灌水乐园】发言


