


 这篇文章介绍了如何使用`ui.Map`对象在地图上添加各种元素,如标签、选择器、按钮以及图像图层。通过`add`方法可以将新的地图、UI控件和几何图层添加到默认地图上。此外,还展示了如何设置地图的中心点、获取地图边界和缩放级别,以及如何设置和调整图像图层的可视化参数,包括多波段显示、颜色梯度和透明度控制。示例中涉及了Sentinel-2卫星图像和地球引擎的数据操作。
Map.add(item)
这个方法通常是在地图展示区加入各种ui使用,如ui.Label等。
// The default map in the Code Editor is a built-in ui.Map object called "Map".
// Let's refer to it as "defaultMap" for clarity.
var defaultMap = Map;

// ui.Map objects can be constructed. Here, a new map is declared.
var newMap = ui.Map({
  center: {lat: 0, lon: 0, zoom: 1},
  style: {position: 'bottom-right', width: '400px'}
});

// Add the newMap to the defaultMap;
defaultMap.add(newMap);

// Other UI widgets can be added to ui.Map objects, for example labels:
defaultMap.add(ui.Label('Default Map', {position: 'bottom-left'}));
newMap.add(ui.Label('New Map', {position: 'bottom-left'}));

// ...selectors:
defaultMap.add(ui.Select(['This', 'That', 'Other']));

// ...or buttons:
defaultMap.add(ui.Button('Click me'));

// You can also add ui.Map.Layer objects. Here, an ee.Geometry object
// is converted to a map layer and added to the default map.
var geom = ee.Geometry.Point(-122.0841, 37.4223);
var geomLayer = ui.Map.Layer(geom, {color: 'orange'}, 'Googleplex');
defaultMap.add(geomLayer);
defaultMap.centerObject(geom, 18);
Map.centerObject(object, zoom)
设置地图的居中位置,参数object是矢量数据或者影像数据;zoom表示缩放等级。
// The default map in the Code Editor is a built-in ui.Map object called "Map".
// Let's refer to it as "defaultMap" for clarity.
var defaultMap = Map;

// ui.Map objects can be constructed. Here, a new map is declared.
var newMap = ui.Map({
  center: {lat: 0, lon: 0, zoom: 1},
  style: {position: 'bottom-right', width: '400px'}
});

// Add the newMap to the defaultMap.
defaultMap.add(newMap);

// You can set the viewport of a ui.Map to be centered on an object.
// Here, the defaultMap is centered on a point with a selected zoom level.
var geom = ee.Geometry.Point(-122.0841, 37.4223);
defaultMap.centerObject(geom, 18);
defaultMap.addLayer(geom, {color: 'orange'}, 'Googleplex');

// Map extent can be fetched using the ui.Map.getBounds method.
print('defaultMap bounds as a list',
      defaultMap.getBounds());
print('defaultMap bounds as a dictionary',
      ee.Dictionary.fromLists(['w', 's', 'e', 'n'], defaultMap.getBounds()));
print('defaultMap bounds as GeoJSON',
      defaultMap.getBounds({asGeoJSON: true}));

// Map center point can be fetched using the ui.Map.getCenter method.
print('defaultMap center as a Point geometry', defaultMap.getCenter());

// Map zoom level can be fetched using the ui.Map.getZoom method.
print('defaultMap zoom level', defaultMap.getZoom());

// Map scale can be fetched using the ui.Map.getScale method.
print('defaultMap approximate pixel scale', defaultMap.getScale());
Map.addLayer(eeObject, visParams, name, shown, opacity)
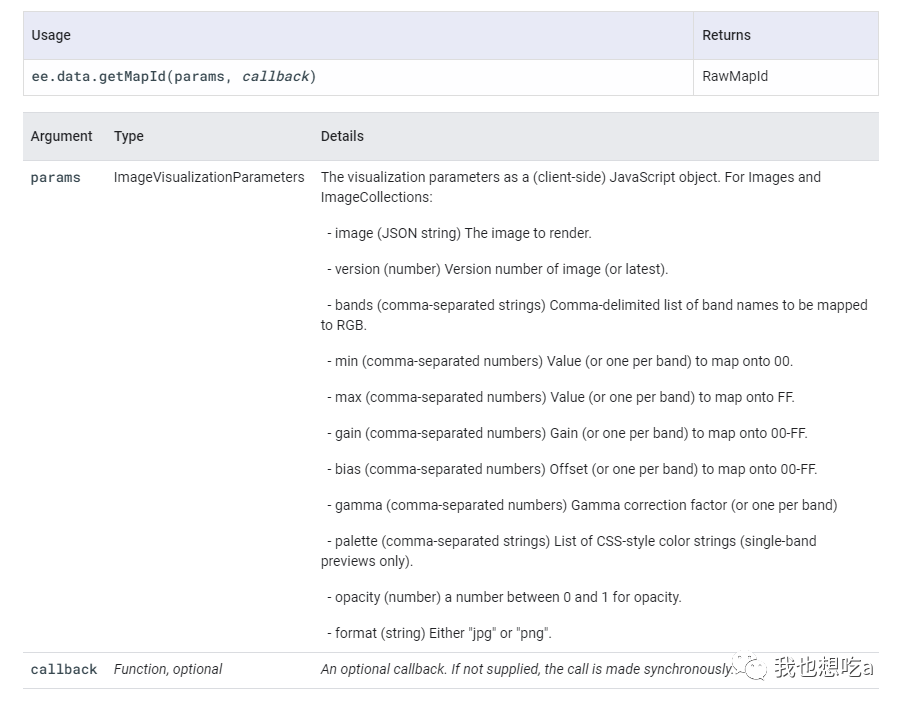
在地图上添加图层,具体参数为:
-
eeObject:图层内容,可以是矢量数据、影像等;
-
visParams:显示图层内容样式参数;
-
name:图层名称;
-
shown:图层是否显示;
-
opacity:图层的透明度。
其中,visParams参数样式可以设置的内容包括:
-
band:波段列表
-
min:最小值
-
max:最大值
-
gamma:伽马系数
-
palette:颜色列表
-
opacity:透明度
-
...
// A Sentinel-2 surface reflectance image.
var image = ee.Image('COPERNICUS/S2_SR/20210109T185751_20210109T185931_T10SEG');
Map.setCenter(-121.87, 37.44, 9);

// Set multi-band RGB image visualization parameters. If the "bands" parameter
// is not defined, the first three bands are used.
var rgbVis = {
  bands: ['B11', 'B8', 'B3'],
  min: 0,
  max: 3000
};
Map.addLayer(image, rgbVis, 'Multi-band RGB image');

// Set band-specific "min" and "max" properties.
var rgbVisBandSpec = {
  bands: ['B11', 'B8', 'B3'],
  min: [0, 75, 150],
  max: [3500, 3000, 2500]
};
Map.addLayer(image, rgbVisBandSpec, 'Band-specific min/max');

// If you don't specify "min" and "max" properties, they will be determined
// from the data type range, often resulting in an ineffective color stretch.
Map.addLayer(image.select('B8'), null, 'Default visParams');

// If an image layer has already been styled, set "visParams" as null.
var imageRgb = image.visualize(rgbVis);
Map.addLayer(imageRgb, null, 'Pre-styled image');

// Use the "palette" parameter with single-band image inputs to define the
// linear color gradient to stretch between the "min" and "max" values.
var singleBandVis = {
  min: 0,
  max: 3000,
  palette: ['blue', 'yellow', 'green']
};
Map.addLayer(image.select('B8'), singleBandVis, 'Single-band palette');

// Images within ImageCollections are automatically mosaicked according to mask
// status and image order. The last image in the collection takes priority,
// invalid pixels are filled by valid pixels in preceding images.
var imageCol = ee.ImageCollection('COPERNICUS/S2_SR')
                   .filterDate('2021-03-01', '2021-04-01');
Map.addLayer(imageCol, rgbVis, 'ImageCollection mosaic');

// FeatureCollection, Feature, and Geometry objects can be styled using the
// "color" parameter.
var featureCol = ee.FeatureCollection('WCMC/WDPA/current/polygons');
Map.addLayer(featureCol, {color: 'purple'}, 'FeatureCollection');


 1377
1377

 被折叠的 条评论
为什么被折叠?
被折叠的 条评论
为什么被折叠?
 到【灌水乐园】发言


