


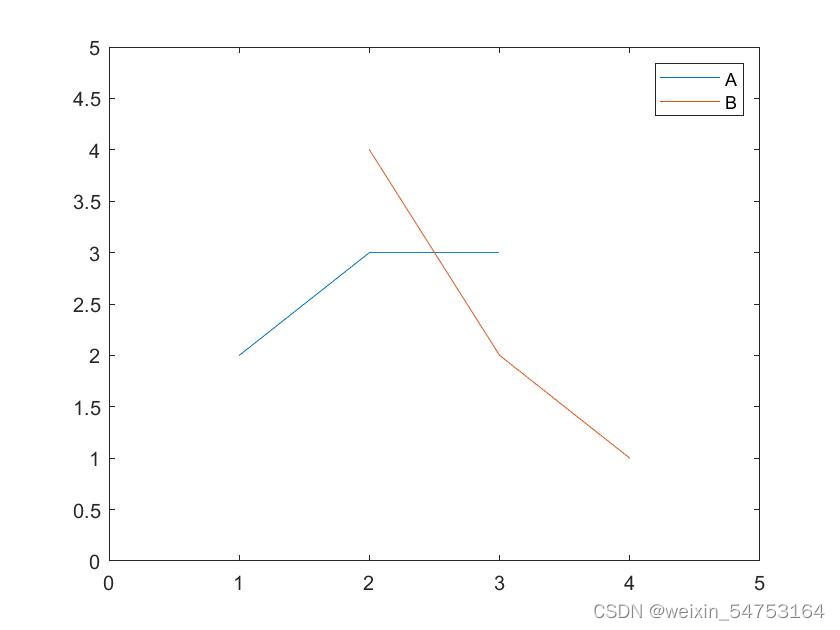
1.图例默认右上角
clear all;
clc;
close all

a=[1,2,3];
b=[2,3,3];
c=[2,3,4];
d=[4,2,1];
plot(a,b);hold on
plot(c,d);
legend('A','B')
xlim([0,5]);%横坐标范围
ylim([0,5]);%纵坐标范围
结果:
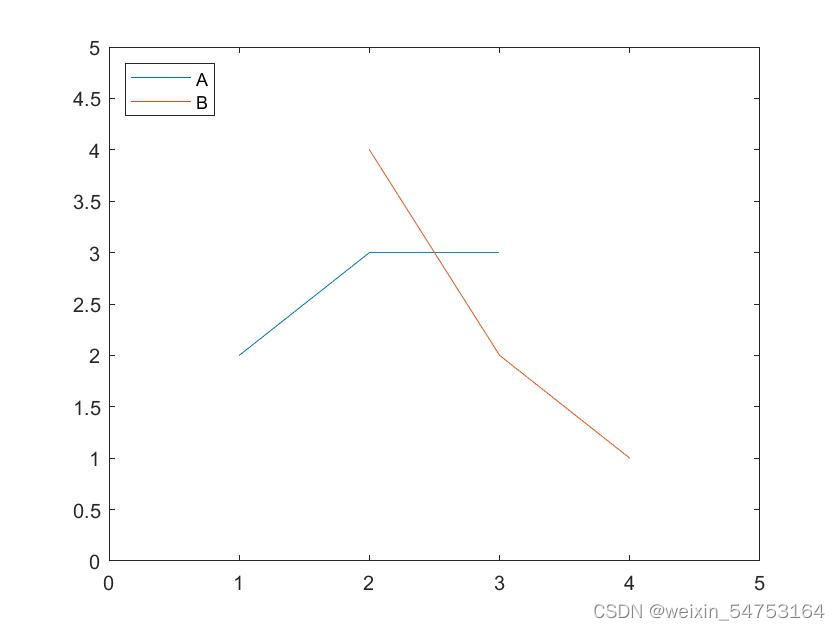
2.改图例位置
clear all;
clc;
close all

a=[1,2,3];
b=[2,3,3];
c=[2,3,4];
d=[4,2,1];
plot(a,b);hold on
plot(c,d);
legend('A','B','location','northwest')
xlim([0,5]);
ylim([0,5]);
结果:
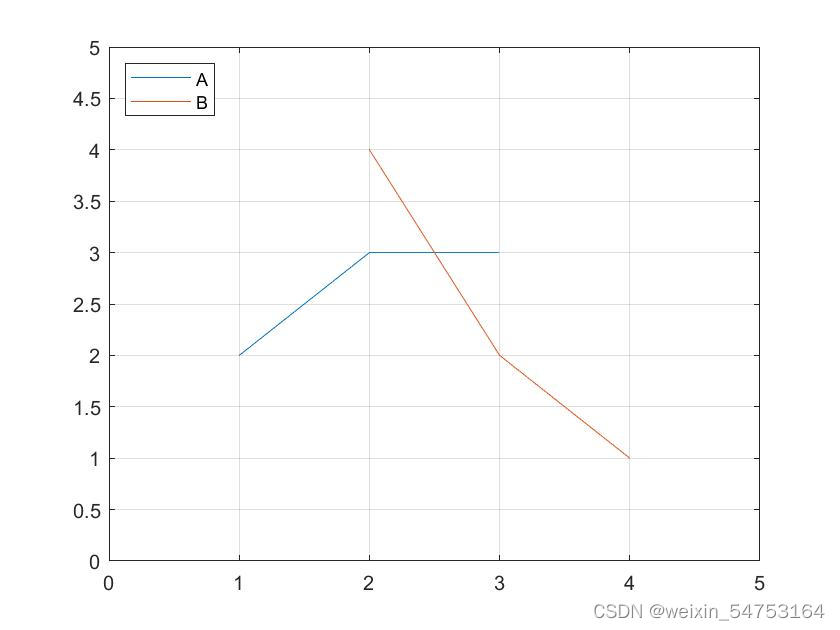
3.加网格
clear all;
clc;
close all

a=[1,2,3];
b=[2,3,3];
c=[2,3,4];
d=[4,2,1];
plot(a,b);hold on
plot(c,d);
legend('A','B','location','northwest')
grid on
xlim([0,5]);
ylim([0,5]);
结果:


 2908
2908


 被折叠的 条评论
为什么被折叠?
被折叠的 条评论
为什么被折叠?
 到【灌水乐园】发言


