


目录
Example configuration for print-quality plots
1. Set the plot grid and background
2. Set the font type and scale
3. Set the default figure size
https://github.com/MichaelGrupp/evo/wiki/Plotting
Plotting
Michael Grupp edited this page on Jul 21, 2023 · 22 revisions
Clone this wiki locally
https://github.com/MichaelGrupp/evo.wiki.git
There are several settings that allow you to change the appearance of plots.
In the command line apps, take a look at parameters like --plot, --plot_mode etc. More general, package-wide settings can be set via evo_config set (see "Configuration" section). Have a look at evo_config show to see all available settings and their current values.
有几种设置允许您更改打印的外观。
在命令行应用程序中,查看诸如--plot、--plot_mode等参数。更常见的是,可以通过evo_config-set设置包范围的设置(请参阅“配置”部分)。查看evo_config show,查看所有可用设置及其当前值。
Example configuration for print-quality plots
This is an example walkthrough for how you could theoretically change the plot settings to produce high-quality plots for print (thesis, paper...).
这是一个示例演练,介绍如何从理论上更改打印设置,以生成高质量的打印图(论文、论文…)。

1. Set the plot grid and background
The default plot settings have a dark background. This looks good on the screen, but is not suitable for printing. We can change the background to a grid with white background by changing the style parameter of Seaborn with:
evo_config set plot_seaborn_style whitegrid
默认打印设置的背景为深色。这在屏幕上看起来不错,但不适合打印。我们可以通过以下方式更改Seaborn的样式参数,将背景更改为具有白色背景的网格:
evo_config set plot_seaborn_style whitegrid
2. Set the font type and scale
The default font doesn't really fit to the rest of our paper, which uses a serif font. The relative size of the text labels in the plot figure could also be increased for better readability. We can switch to a serif font with larger scale by calling:
evo_config set plot_fontfamily serif plot_fontscale 1.2
默认的字体并不适合我们论文的其他部分,它使用了衬线字体。为了更好的可读性,还可以增加绘图图中文本标签的相对大小。我们可以通过调用切换到更大比例的衬线字体:
evo_config set plot_fontfamily serif plot_fontscale 1.2
To match the smaller font, we also reduce the line width:
evo_config set plot_linewidth 1.0
为了匹配较小的字体,我们还减小了线宽:
evo_config set plot_linewidth 1.0
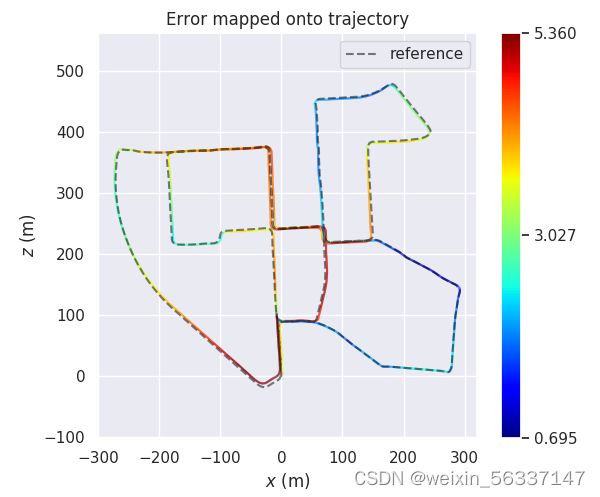
There are some other things you can change, for example the line style of the reference trajectory:
evo_config set plot_reference_linestyle -
您还可以更改其他一些内容,例如参考轨迹的线样式:
evo_config set plot_reference_linestyle -
3. Set the default figure size
You can adjust the default plot figure size, too. For example to a width of 5 and a height of 4.5:
evo_config set plot_figsize 5 4.5
您也可以调整默认的绘图图形大小。例如,宽度为5,高度为4.5:
evo_config set plot_figsize 5 4.5
4. Use LaTeX renderer
Because we use LaTeX to write the paper, we want to render the fonts of the plots with LaTeX, too:
evo_config set plot_usetex
因为我们使用LaTeX来写论文,所以我们也想用LaTeX渲染绘图的字体:
evo_config set plot_usetex
You may need to change the plot_texsystem parameter to the LaTeX system that's installed on your machine if this doesn't work on the first try, see evo_config show.
Advanced: plots can be also exported in pgf format (--save_plot plot.pgf).
如果第一次尝试时不起作用,您可能需要将plot_txystem参数更改为机器上安装的LaTeX系统,请参阅evo_config show。
高级地:绘图也可以以pgf格式导出(--save_plot plot.pgf)。
5. Restore default settings
evo_config reset
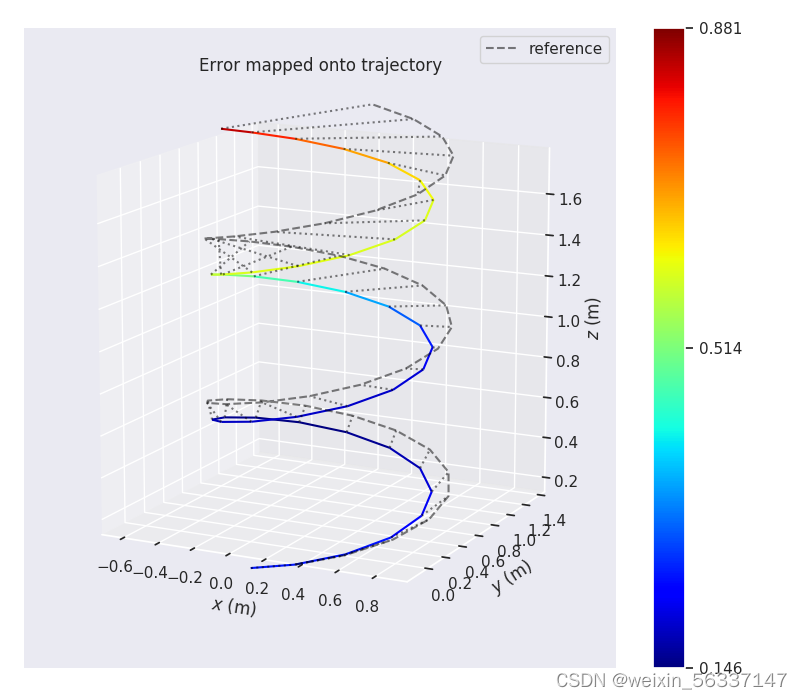
Coordinate axis markers
Coordinate axis markers can be activated by setting plot_axis_marker_scale to a non-zero value, for example:
evo_config set plot_axis_marker_scale 0.1
坐标轴标记可以通过将plot_axis_marker_scale设置为非零值来激活,例如:
evo_config set plot_axis_marker_scale 0.1
Reference trajectories have a separate parameter plot_reference_axis_marker_scale.
You probably need to play around with this scale value to adjust it to the size of your trajectories. Set it to 0 again if you don't need it anymore.
参考轨迹有一个单独的参数plot_Reference_axis_marker_scale。
你可能需要使用这个比例值来调整它以适应你的轨迹大小。如果不再需要,请再次将其设置为0。

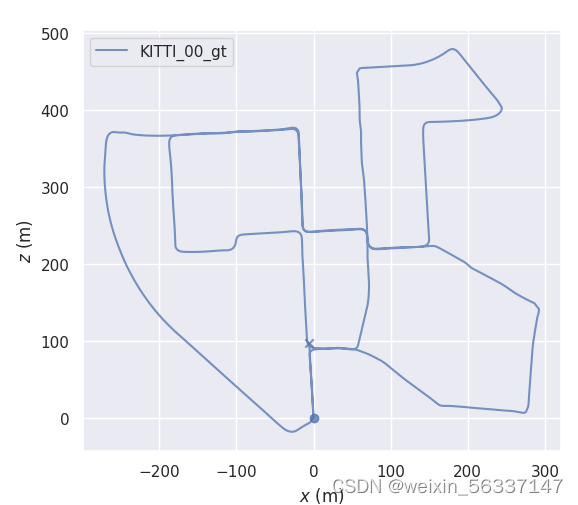
Start and end markers
evo_config set plot_start_end_markers true
Start is marked with a circle, the end with a cross.
evo_config set plot_start_end_markers true
起点用圆圈标记,终点用十字架标记。
Pose correspondence markers
You can enable markers that connect the reference trajectory's poses with the corresponding poses in the other trajectories. This setting applies to evo_ape and evo_rpe, but also to evo_traj if you specify a --ref reference and the other trajectories are either synced or aligned.
Activate:
evo_config set plot_pose_correspondences true
可以启用标记,将参考轨迹的姿势与其他轨迹中的相应姿势连接起来。此设置适用于evo_ape和evo_rpe,但如果指定--ref引用并且其他轨迹同步或对齐,则也适用于evo_traj。
evo_config set plot_pose_correspondences true
Changing the length unit
You can scale the axis ticks of trajectory plots to a different length unit. This can be useful if you have data at very small scale (cm, mm; e.g. from a phone) or very large (km; e.g. from a car). Note that this does not alter the data, it only changes the plot appearance.
Example:
evo_config set plot_trajectory_length_unit km
可以将轨迹图的轴刻度缩放为不同的长度单位。如果您有非常小规模(厘米、毫米;例如来自手机)或非常大规模(公里;例如来自汽车)的数据,这可能会很有用。请注意,这不会更改数据,只会更改打印外观。
例子:evo_config set plot_trajectory_length_unit km


2D ROS maps
You can insert 2D maps that follow the ROS map_server format into plots. The format is described here: http://wiki.ros.org/map_server#Map_format
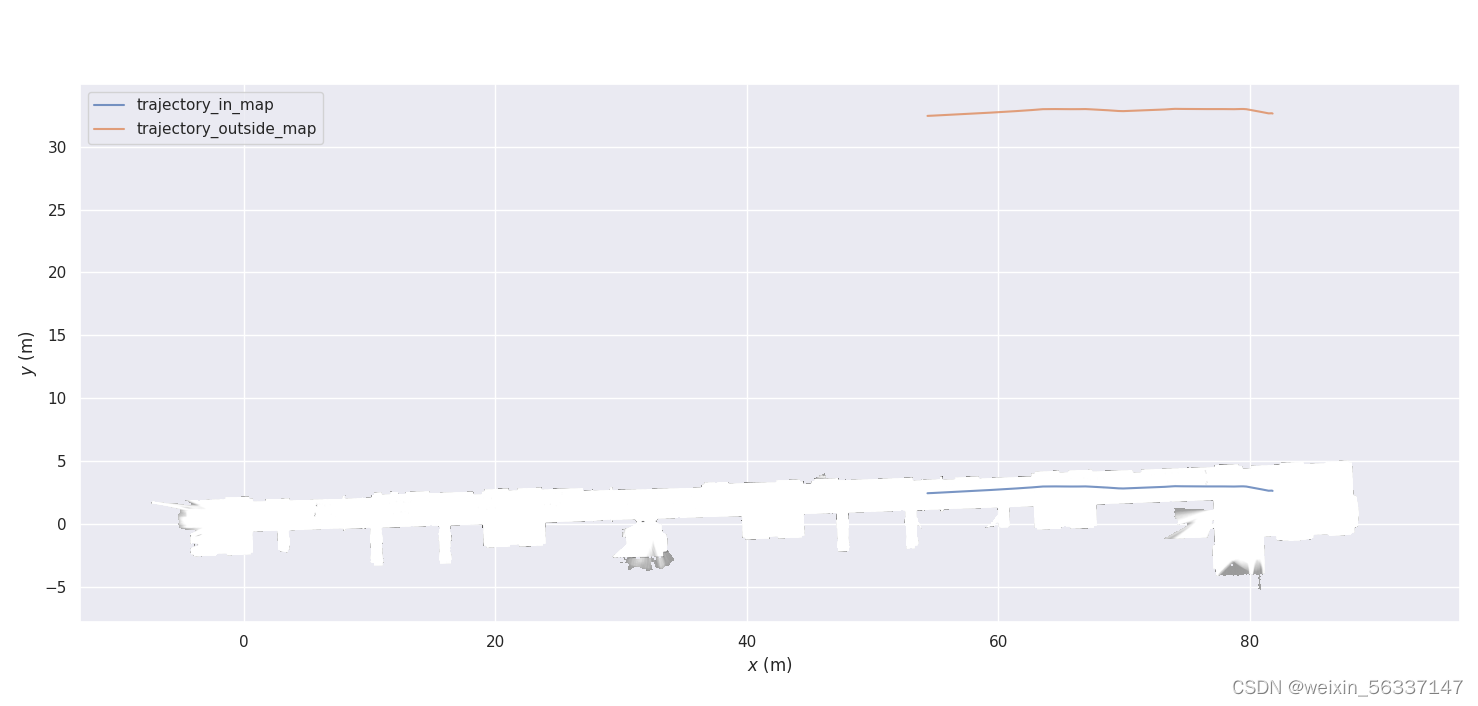
Given that you have such a pair of files (map.pgm and map.yaml), just add --ros_map_yaml map.yaml and the map will be shown in addition to the trajectories:
您可以将遵循ROS map_server格式的2D地图插入到绘图中。格式描述如下:http://wiki.ros.org/map_server#Map_format
假设您有这样一对文件(map.pgm和map.yaml),只需添加--ros_map_yaml map.yaml,除了轨迹之外,还会显示地图:

Note that this follows the ROS convention:
the map is assumed to be in the x-y plane, so it will be only shown in the xy/yx plot modes
the image will be transformed to the x-y plane's origin as specified in the .yaml file
请注意,这遵循ROS约定:
地图被假定在x-y平面上,因此它将仅在xy/yx绘图模式中显示
图像将被转换为.yaml文件中指定的x-y平面的原点
Masking
In the above image the unknown cells of the map grid are not shown. To make this work, you might have to tweak the setting for the uint8 value that represents unknown cells in a ROS map image. ROS' standard map_saver uses 205, other tools might not (for example, Cartographer uses 128 for images of probability grids):
evo_config set ros_map_unknown_cell_value 128
在上面的图像中,没有显示地图网格的未知单元。为了实现这一点,您可能需要调整uint8值的设置,该值表示ROS图图像中的未知单元。ROS的标准map_saver使用205,其他工具可能不会(例如,制图师使用128表示概率网格的图像):
evo_config set ros_map_unknown_cell_value 128
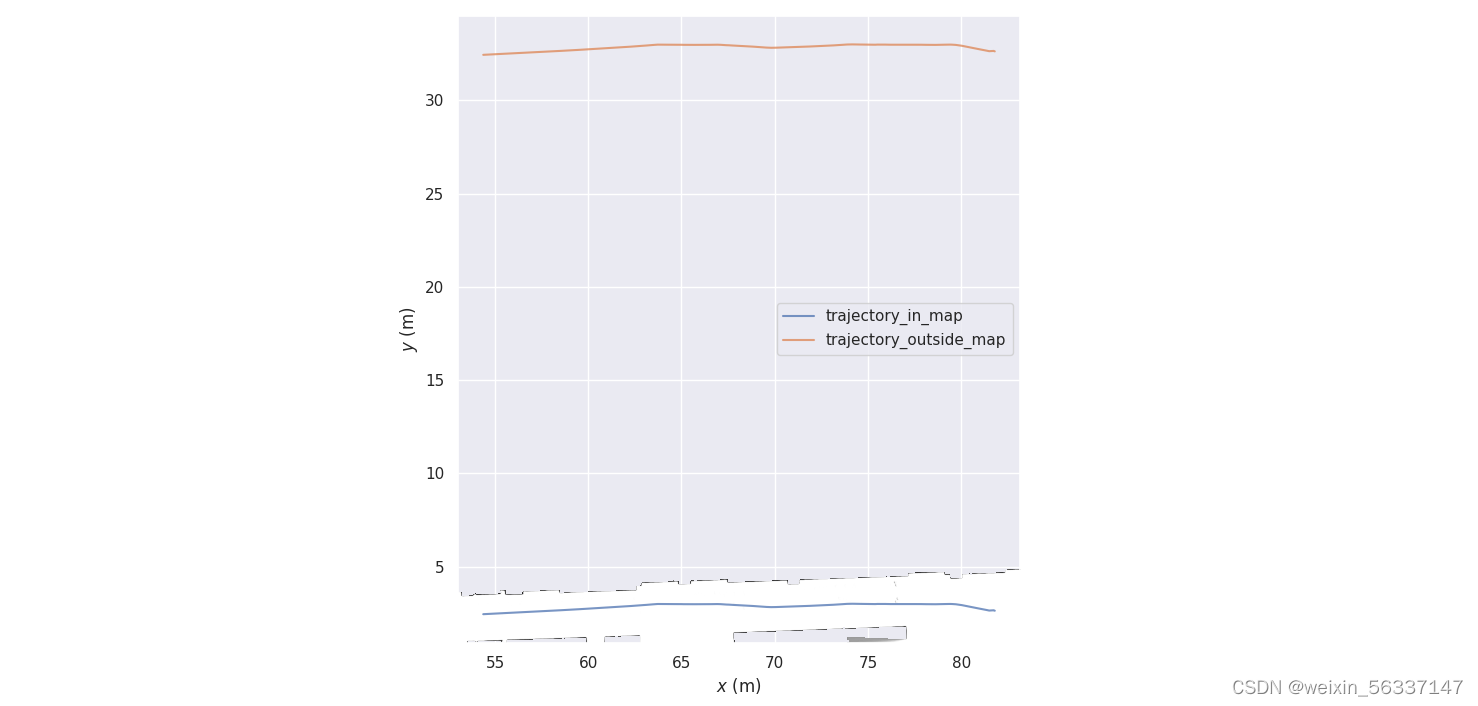
But this can also be completely disabled. Then the bounding box of the map will be visible.
evo_config set ros_map_enable_masking false
但这也可以完全禁用。然后,地图的边界框将可见。
evo_config set ros_map_enable_masking false
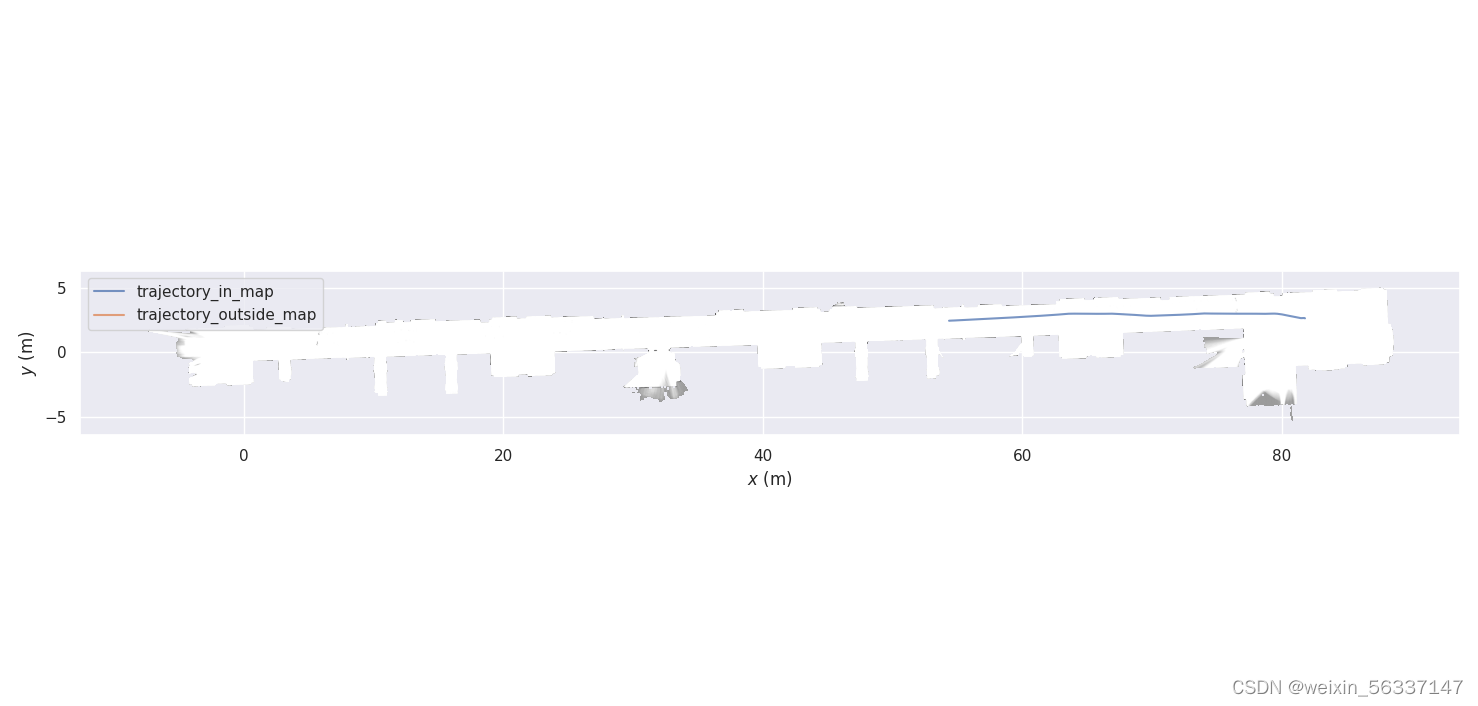
Viewport
You can define how the viewport will change when you plot a map by choosing one of the settings:
evo_config set ros_map_viewport {keep_unchanged, update, zoom_to_map}
通过选择以下设置之一,可以定义打印地图时视口的更改方式:
evo_config set ros_map_viewport {keep_unchanged, update, zoom_to_map}
This is especially useful when saving plots automatically and you don't want to edit the view manually all the time.
当自动保存打印并且不想一直手动编辑视图时,这一点尤其有用。
keep_unchanged
update
zoom_to_map
参考


 139
139


 被折叠的 条评论
为什么被折叠?
被折叠的 条评论
为什么被折叠?
 到【灌水乐园】发言


