


目录
💥1 概述
记录的地震信号常常被噪声破坏。本文使用了一种基于高分辨率时频分析的单通道地震数据自动噪声衰减方法。同步压缩是一种时频重新分配方法,旨在锐化时频图像。噪声可以从信号中区分出来,并且在这个重新分配的域中更容易衰减。使用一般交叉验证方法来估计阈值水平,该方法不依赖关于噪声水平的任何先验知识。通过增加基于峰度测量的预处理步骤和基于自适应硬阈值的后处理步骤,提高了阈值处理的效率。所提出的算法可以衰减噪声(白色或彩色)并保持信号,或者去除信号并保持噪声。因此,它既可以用于正常的去噪应用,也可以用于环境噪声研究中的预处理。在合成、微震和地震记录上测试了所提出方法的性能。
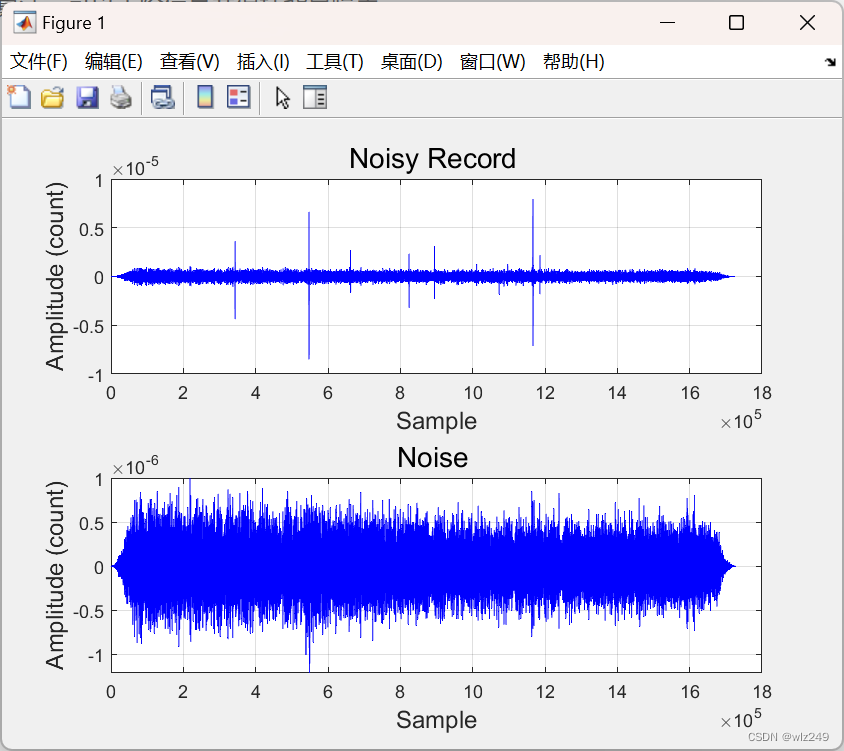
这是GCV方法的一种反向算法,可以去除信号并保持背景噪声。
📚2 运行结果
🎉3 参考文献
[1]王姣,李振春,王德营.基于CEEMD的地震数据小波阈值去噪方法研究[J].石油物探,2014,53(02):164-172.
👨💻4 Matlab代码
主函数部分代码:
clear all
close all
% Parameters for Calculate the wavelet transform -
opt.type = 'morlet'; % Type od the mother wavelet used for CWT calculation: 'morlet' 'shannon' 'mhat' 'hhat'
opt.padtype = 'symmetric'; % padded via symmetrization
opt.rpadded = 1;
opt.nv = 16; % Number of voices. You can sellect 8,16,32,64.
% Guassian correction factor. This corrects the uncertainties for the
% estimation of the guassianity and amplifies the pre-processing effects.
% It should be selected highh enough to remove the strong noises outside
% of the signal's frequency band but not too high to remove signal's energy.
% value of 1.0 means no correction.
opt.gc=3;
%load('syntNoisy3_z.mat');
% data.noisy = syntNoisy3_z;
% data.t = linspace(0,(100),length(data.noisy));
% data.dt = 0.01;
% Read the noisy data
[data.t,data.noisy,data.hdr] = read_sac('XD.A01..BHZ.064.SAC');
data.dt = data.hdr.times.delta % delta
d1 = data.noisy;
% Since thecurrent version of the code can not handel overlapping winows we
% implement the algorithm by repeating the process using two windows of
% different sizes (one larger than the largest event in the waveform and one
% smaller window which its lenght is not a multiplication of the larger window size)
% however this makes the code slower but so far this is the easiest
% soloution
% processing long duration data is done in moving window fasion
opt.wsiz = 500; % wondow size (sec), needs to be longer than the length of typical events that you have in your data
tic
dn =gcvThreshR(data,opt);
toc
data.noisy = dn.xgcv;
opt.wsiz = 55; % wondow size (sec), needs to be longer than the length of typical events that you have in your data
tic
dn =gcvThreshR(data,opt);
toc
figure,
subplot(2,1,1),
plot(d1, 'b');
grid on
title('Noisy Record ','Rotation',0,'FontSize',14);
xlabel({'Sample'},'FontSize',12);
ylabel('Amplitude (count)','FontSize',12)


 1052
1052


 被折叠的 条评论
为什么被折叠?
被折叠的 条评论
为什么被折叠?
 到【灌水乐园】发言


