


第 4 章 对 象 和 图 形


Python 3.9.7 (default, Sep 16 2021, 13:09:58)
[GCC 7.5.0] :: Anaconda, Inc. on linux
Type "help", "copyright", "credits" or "license" for more information.
>>> import graphics
>>> win = graphics.GraphWin()
>>> win.close
<bound method GraphWin.close of GraphWin('Graphics Window', 200, 200)>
>>> win.close()
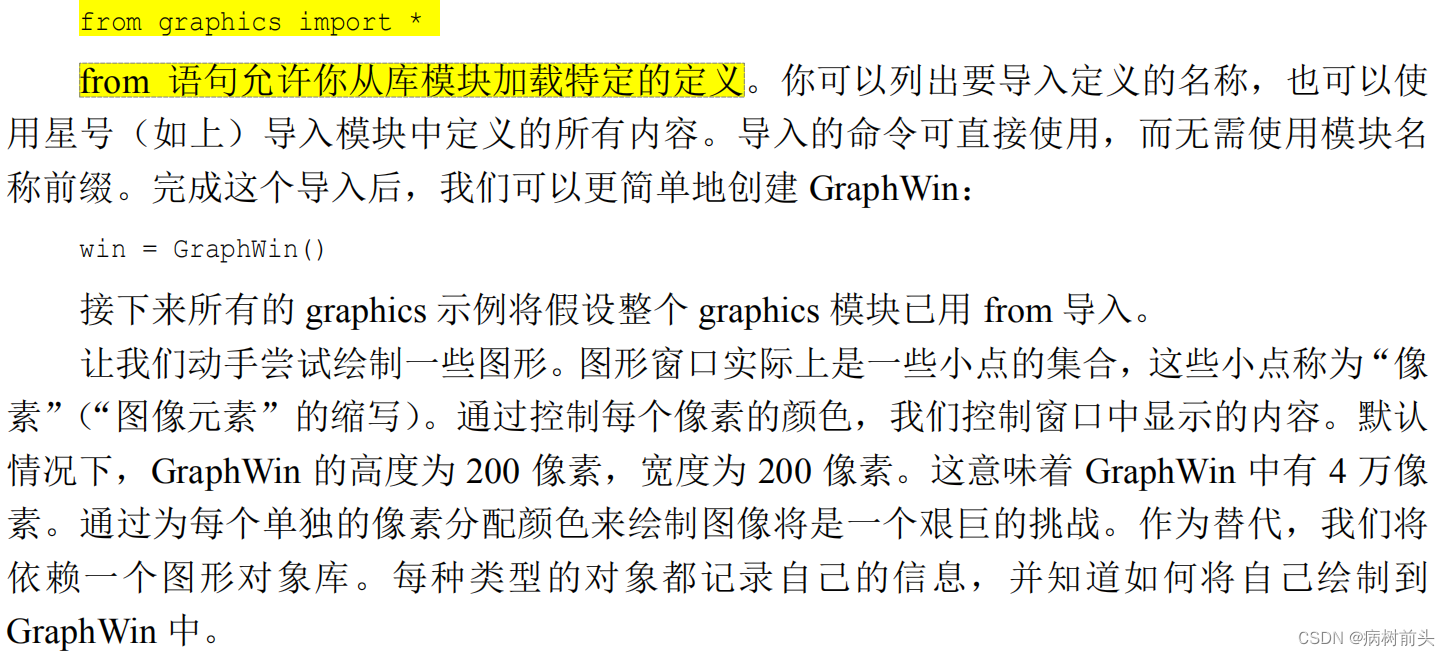
>>> from graphics import *
>>> win = GraphWin()
>>> p = point(50,60)
Traceback (most recent call last):
File "<stdin>", line 1, in <module>
NameError: name 'point' is not defined
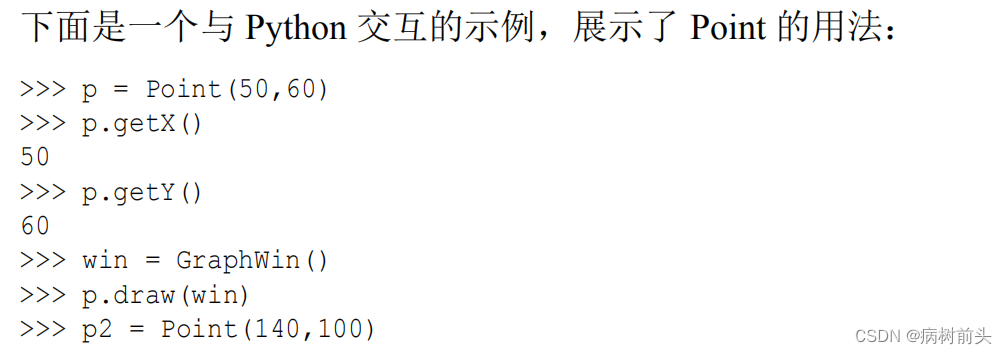
>>> p = Point(50,60)
>>> p.getX()
50.0
>>> p.getY()
60.0
>>> win = GraphWin()
>>> p.draw(win)
Point(50.0, 60.0)
>>> p2 = Point(140,100)
>>> p2.draw(win)
Point(140.0, 100.0)
>>> win.close()
>>> win.close()
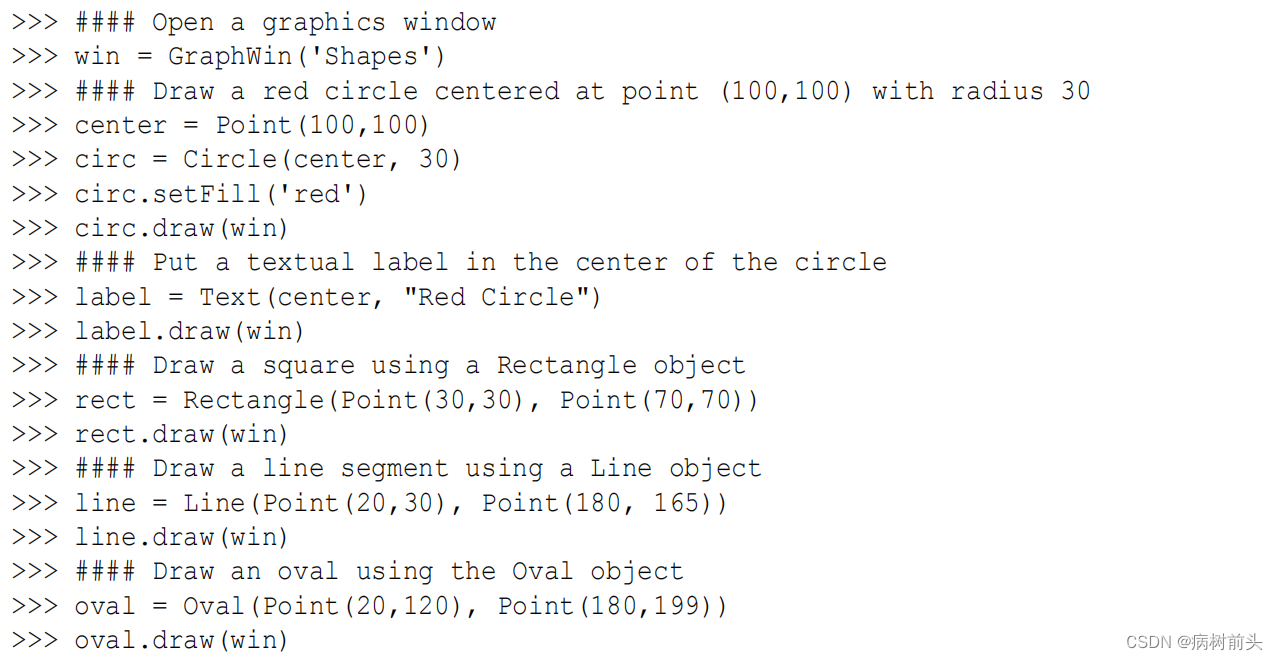
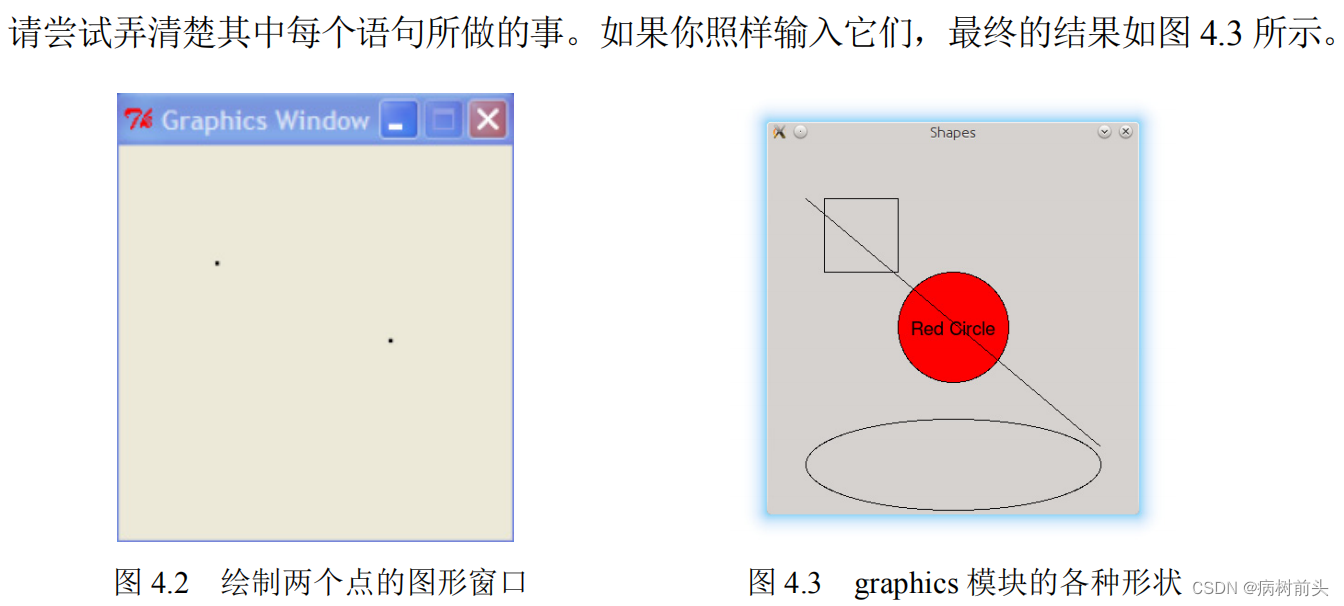
>>> win = GraphWin('Shapes')
>>> center = Point(100,100)
>>> circ = Circle(center, 30)
>>> circ.draw(win)
Circle(Point(100.0, 100.0), 30)
>>> circ.setFill('red')
>>> circ.draw(win)
Traceback (most recent call last):
File "<stdin>", line 1, in <module>
File "/home/yhm/anaconda3/lib/python3.9/site-packages/graphics/__init__.py", line 481, in draw
if self.canvas and not self.canvas.isClosed(): raise GraphicsError(OBJ_ALREADY_DRAWN)
graphics.GraphicsError: Object currently drawn
>>> label = Text(center, "Red Circle")
>>> label.draw(win)
Text(Point(100.0, 100.0), 'Red Circle')
>>> rect = Rectangle(Point(30,30), Point(70,70))
>>> rect.draw(win)
Rectangle(Point(30.0, 30.0), Point(70.0, 70.0))
>>> line = Line(Point(20,30),Point(180,165))
>>> line.draw(win)
Line(Point(20.0, 30.0), Point(180.0, 165.0))
>>> oval = Oval(Point(20,120),Point(180,199))
>>> oval.draw(win)
Oval(Point(20.0, 120.0), Point(180.0, 199.0))
>>>


  1 # futval_graph.py
  2
  3 from graphics import *
  4
  5 def main():
  6     #Introduction
  7     print("This program plots the growth of a 10-year investment.")
  8
  9     #Get principal and interest rate
 10     principal = float(input("Enter the initial principal: "))
 11     apr = float(input("Enter the annualized interest rate: "))
 12     #Create a graphics window with labels on left edge
 13     win = GraphWin("Investment Growth Chart", 320, 240)
 14     win.setBackground("white")
 15     Text(Point(20,230), '0.0K').draw(win)
 16     Text(Point(20,180), '2.5K').draw(win)
 17     Text(Point(20,130), '5.0K').draw(win)
 18     Text(Point(20,80), '7.5K').draw(win)
 19     Text(Point(20,30), '10.0K'). draw(win)
 20
 21     #Draw bar for initial principal
 22     height = principal * 0.02
 23     bar = Rectangle(Point(40,230), Point(65, 230-height))
 24     bar.setFill("green")
 25     bar.setWidth(2)
 26     bar.draw(win)
 27
 28     #Draw bars for successive years
 29     for year in range(1,11):
 30         #calculate value for the next year
 31         principal = principal * (1 + apr)
 32         #draw bar for this value
 33         x11 = year * 25 + 40
 34         height = principal * 0.02
 35         bar = Rectangle(Point(x11, 230), Point(x11+25, 230-height))
 36         bar.setFill("green")
 37         bar.setWidth(2)
 38         bar.draw(win)
 39
 40     input("Press <Enter> to quit")
 41     win.close()
 42
 43 main()


 7137
7137


 被折叠的 条评论
为什么被折叠?
被折叠的 条评论
为什么被折叠?
 到【灌水乐园】发言


