


写在前面:该笔记为学习吴恩达团队在coursera新开设的机器学习课程而记录,新版本采用python进行授课且相较于旧版有小部分改动
官方网址:https://www.coursera.org/specialization/machine-learning-introduction
学习视频传送门:(强推|双字)2022吴恩达机器学习Deeplearning.ai课程_哔哩哔哩_bilibili
catalog
1.What is Machine Learning?
1.What is Machine Learning?
Two definitions of Machine Learning are offered.
1. Arthur Samuel described it as: “the field of study that gives computers the ability to learn without being explicitly programmed.” This is an older, informal definition.
2. Tom Mitchell provides a more modern definition: “A computer program is said to learn from experience E with respect to some class of tasks T and performance measure P, if its performance at tasks in T, as measured by P, improves with experience E.”
2.Learning Content
->The two main type of machine learning are supervised learning and unsupervised learning.Of these two,supervised learning is the type of machine learning that is used most in many real word applications,and that has seen the most rapid advancement and innovation. Reinforcement Learning is another type of machine learning algorithm did not talk about briefly.
->The other thing we're going to spend a lot of time on in this specialization is practical advice for applying learning algorithms and know how to design and build serious machine learning systems.
3.Supervised Learning
->Supervised machine learning refers to algorithms that learn x to y or input to output mappings.The key characteristic of supervised learning is that you give your learning algorithm examples to learn from.That includes the right answers,whereby right answer,I mean,the correct label y for a given input x,and is by seeing correct pairs of input x and desired output label y that the learning algorithm eventually learns to take just the input alone without the output label and gives a reasonably accurate prediction or guess of the output.
【Some examples】
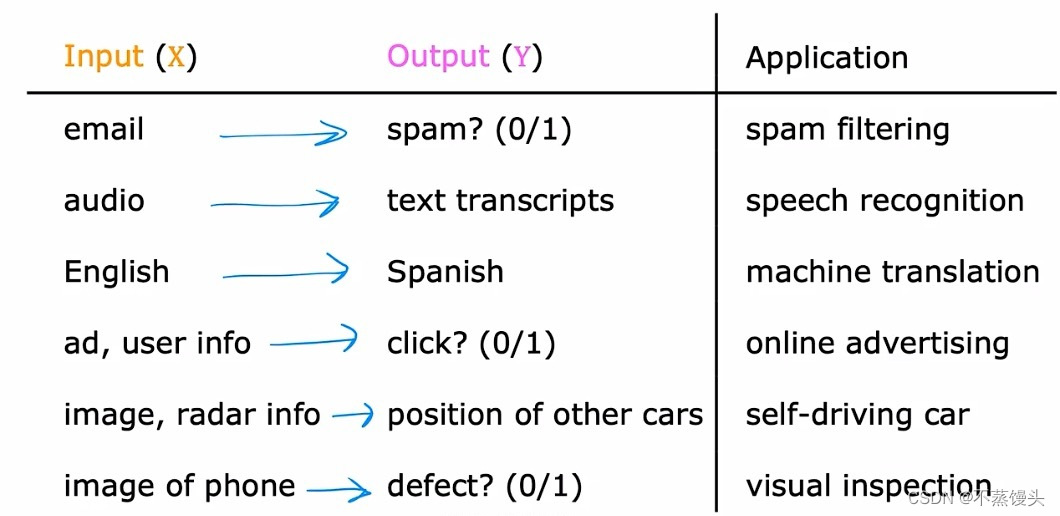
->In all of these applications,you will first train your model with examples of inputs x and the right answers,that is the labels y.After the model has learned from these input,output,or x and y pairs, they can then take a brand new input x,something it has never seen before,and try to produce the appropriate corresponding output y.
【Eg one —Regression:Housing price prediction (predict number)】

->Say you want to predict housing prices based on the size of the house.You've collected some data and say you plot the data and it looks like this.Here on the horizontal axis is the size of the house in square feet.Here on the vertical axis is the price of the house in,With this data,let's say a friend wants to know what's the price for their 750 square foot house.
->One thing a learning algorithm might be able to do is say,for the straight line to the data and reading off the straight line,it looks like your friend's house could be sold for maybe about $150000.But fitting a straight line isn't the only learning algorithm you can use.There are others that could work better for this application.For example,routed and fitting a straight line,you might decide that it's better to fit a curve,a function that's slightly more complicated or more complex than a straight line.If you do that and make a prediction here,then it looks like your friend's house could be sold for closer to $200000.One of the things you see later in this class is how you can decide whether to fit a straight line,a curve,or other function that is even more complex to the data.Now,it doesn't seem appropriate to pick the one that gives your friend the best price,but one thing you see is how to get an algorithm to systematically choose the most appropriate line or curve or other thing to fit to this data.
->We gave the algorithm a database in which the so-called right answer,that is the label or the correct price y is given for every house on the plot.The task of the learning algorithm is to produce more of these right answers,specifically predicting what is the likely price for other houses like your friend's house. This housing price prediction is the particular type of supervised learning called regression.By regression,I mean we're trying to predict a number from infinitely many possible numbers,such as the house prices in our example,which could be 150000 or 70000or 183000 or any other number in between.
【Eg two —Classification:Breast cancer detection】
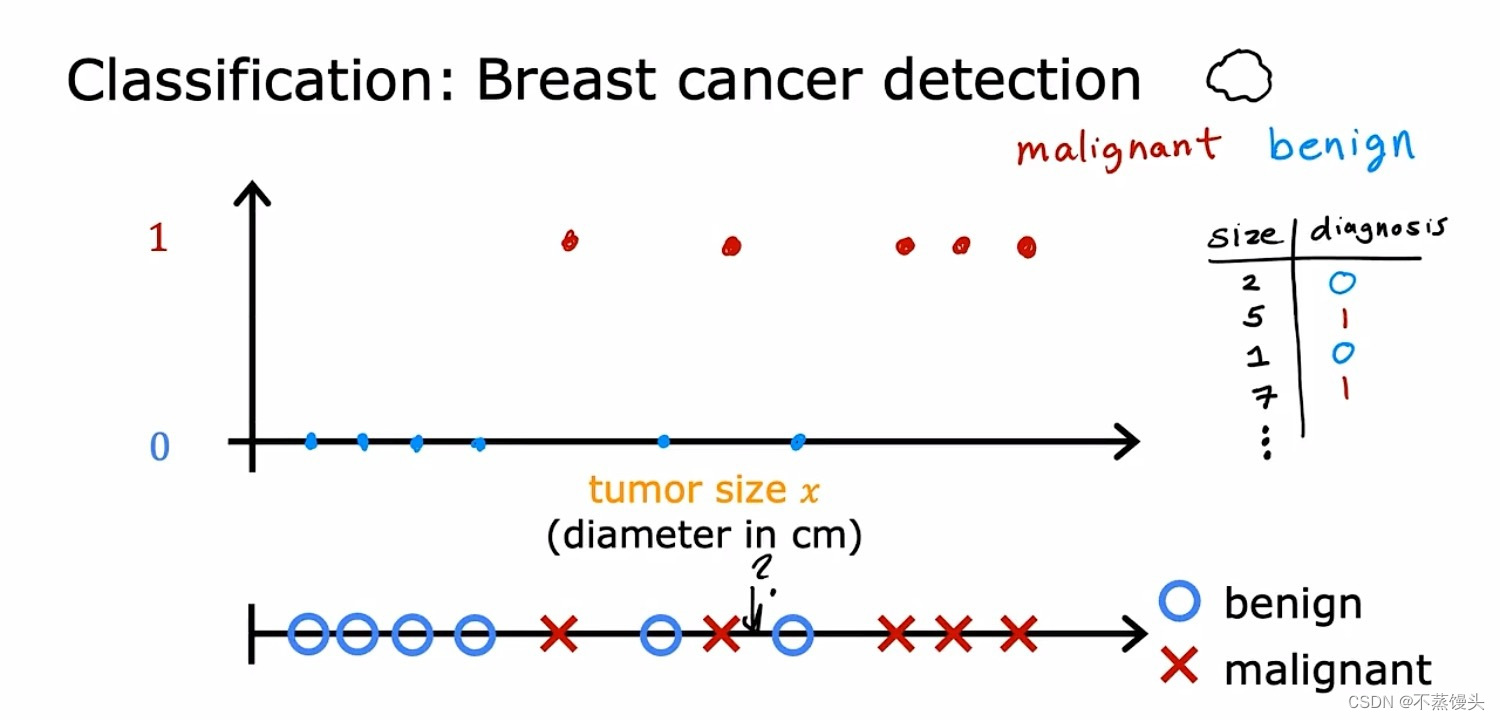
->Say you're building a machine learning system so that doctors can have a diagnostic tool to
detect breast cancer.Using a patient's medical records your machine learning system tries to figure out if a tumor that is a lump is malignant meaning cancerous or dangerous.Or if that tumor, that lump is benign,meaning that it's just a lump that isn't cancerous and isn't that dangerous?These tumors are labeled as either benign,which I will designate in this example with a 0 or malignant,which designate in this example with a 1.You can then plot your data on a graph like this where the horizontal axis represents the size of the tumor and the vertical axis takes on only two values 0 or 1 depending on whether the tumor is benign,0 or malignant 1.
->One reason this is different from regression is that we're trying to predict only a small number of possible outputs or categories.In this case two possible outputs 0 or1,benign or malignant.This is different from regression which tries to predict any number,all of the infinitely many number of possible numbers.And so the fact that there are only two possible outputs is what makes this classification.Because there are only two possible outputs or two possible categories in this case, you can also plot this data set on a line like this.Right now,I'm going to use two different symbols to denote the category using a circle an ⭕️ to denote the benign examples and a cross to denote the malignant examples.And if new patients walks in for a diagnosis and they have a lump that is this size,then the question is,will your system classify this tumor as benign or malignant?
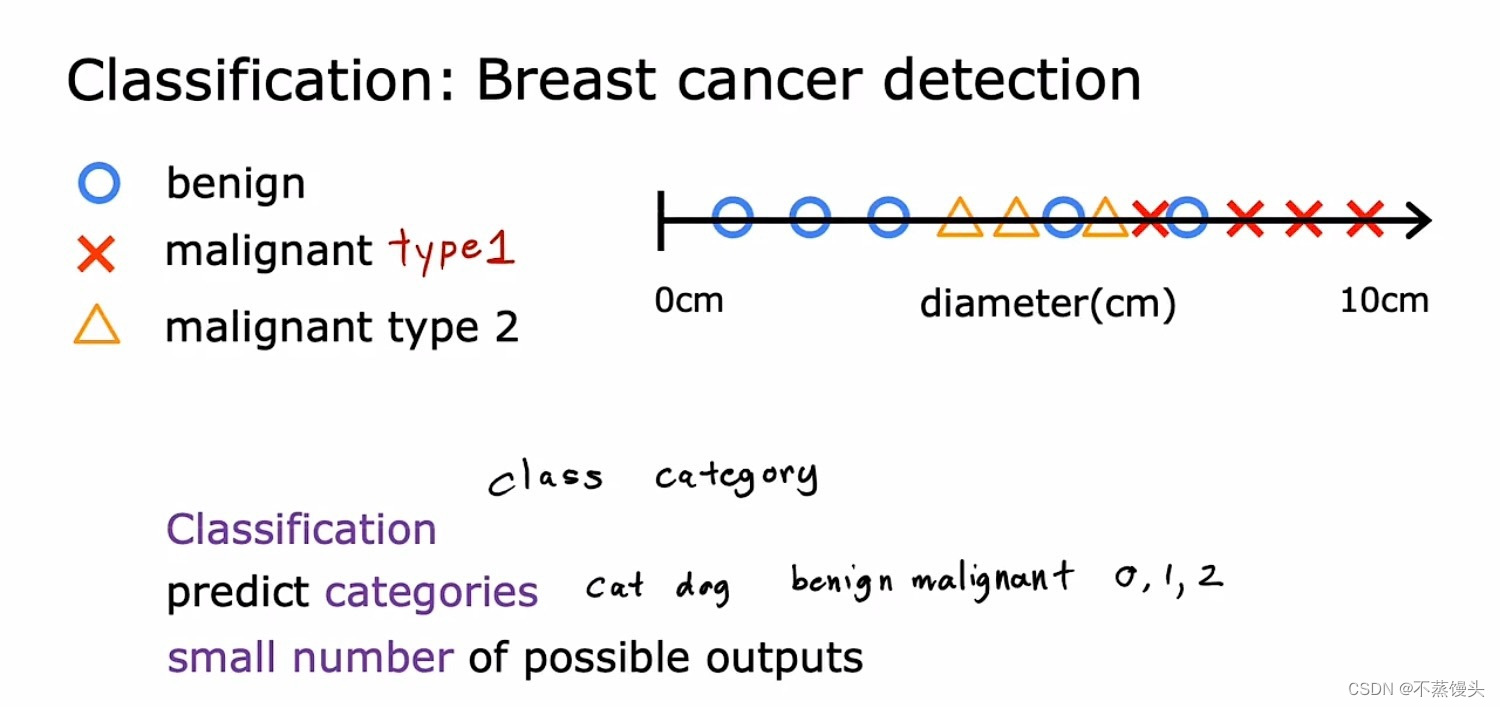
->It turns out that in classification problems you can also have more than two possible output categories.Maybe you're learning algorithm can output multiple types of cancer diagnosis if it turns out to be malignant.So let's call two different types of cancer type 1 and type 2.In this case the average would have three possible output categories it could predict.And by the way in classification,the terms output classes and output categories are often used interchangeably.So to summarize classification algorithms predict categories.Categories don't have to be numbers.It could be non numeric for example,it can predict whether a picture is that of a cat or a dog. Categories can also be numbers like 0,1 or 0,1,2.But what makes classification different from regression when you're interpreting the numbers is that classification predicts a small finite limited set of possible output categories such as 0,1 and 2 but not all possible numbers in between like 0.5 or 1.7.
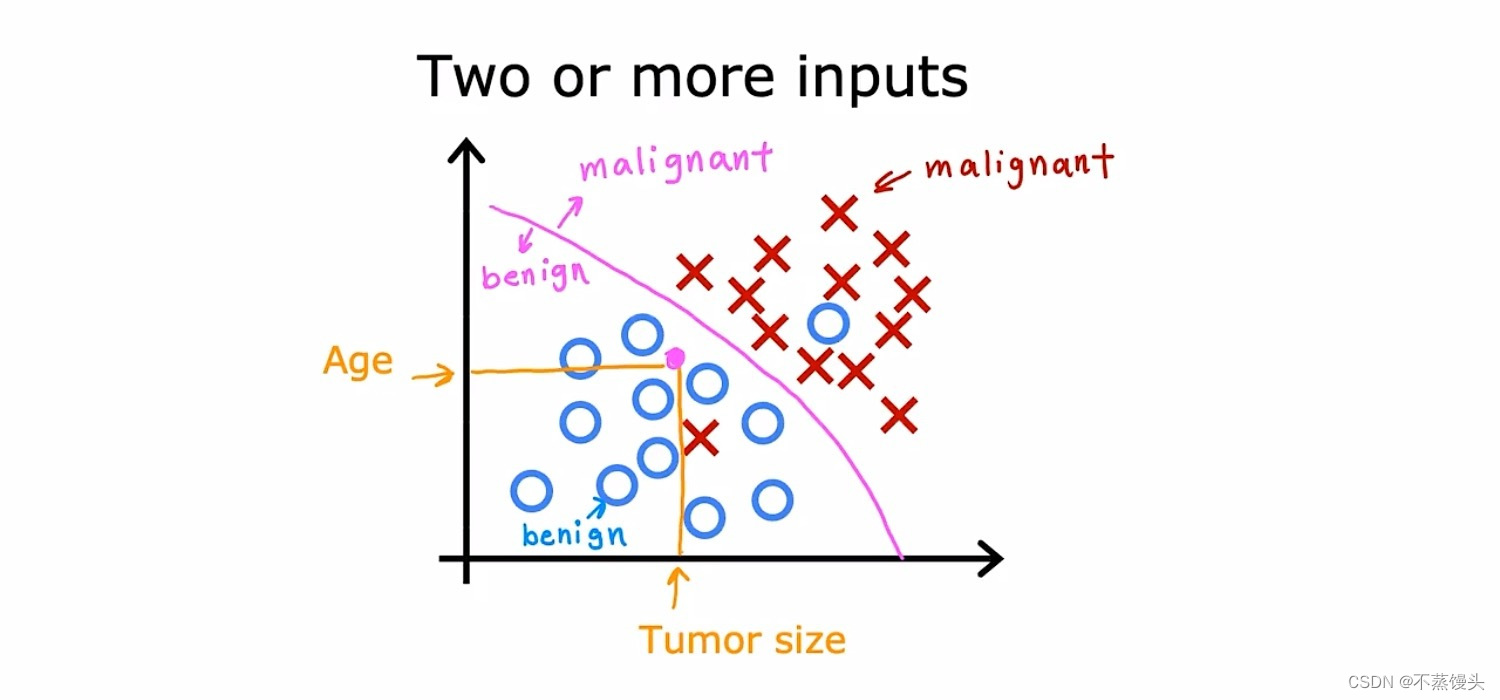
->In the example of supervised learning that we've been looking at,we have only one input value the size of the tumor.But you can also use more than on input value to predict an output.Here's an example,instead of just knowing the tumor size,say you also have each patient's age in years. Your new data set now has two inputs,age and tumor size.What in this new data set we're going to use circles to show patients whose tumors are benign and crosses to show the patients with a tumor that was malignant.So when a new patient comes in,the doctor can measure the patient's tumor size and also record the patient's age.And so given this,how can we predict if this patient's tumor is benign or malignant?Well,what the learning algorithm might do is find some boundary that separates out the malignant tumors from the benign ones.So the learning algorithm has to decide how to fit a boundary line through this data.The boundary line found by the learning algorithm would help the doctor with the diagnosis.From this example we have seen how to inputs the patient's age and tumor size can be used.In other machine learning problems often many more input values are required.
4.Unsupervised Learning
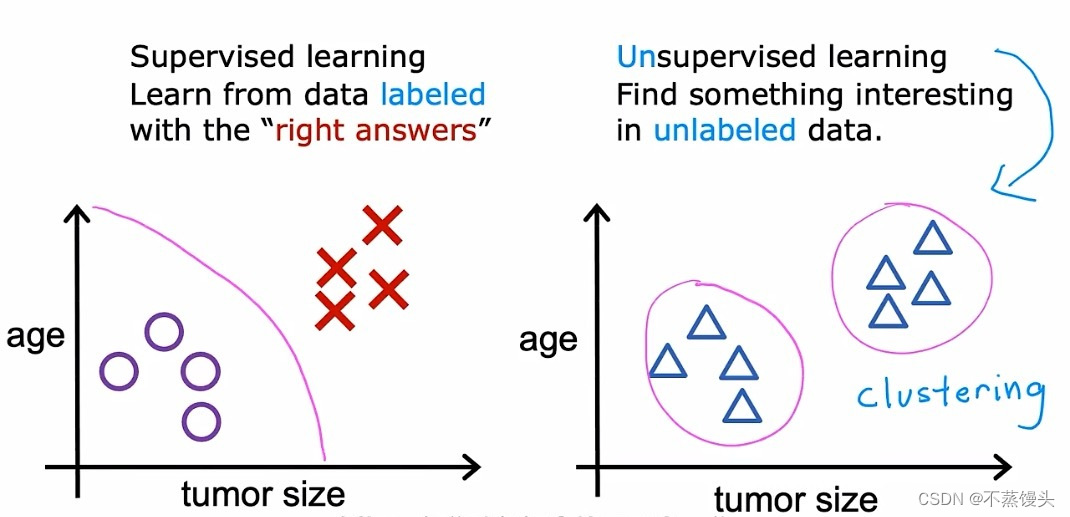
->When we're looking at supervised learning in the last part recalled,it looks something like this in this case of a classification problem.Each example,was associated with an output label y such as benign or malignant,designated by the poles and crosses in unsupervised learning.Were given data that isn't associated with any output labels y,say you're given data on patients and their tumor size and the patient's age.But not whether the tumor was benign or malignant,so the data set looks like this on the right.We're not asked to diagnose whether the tumor is benign or malignant,because we're not given any labels.Why in the data set,instead,our job is to find some structure or some pattern or just find something interesting in this data.We call it unsupervised because we're not trying to supervise the algorithm.To give some quote right answer for every input,instead,we asked the our room to figure out all by yourself what's interesting.Or what patterns or structures that might be in this data,with this particular data set.An unsupervised learning algorithm,might decide that the data can be assigned to two different groups or two different clusters.And so it might decide,that there's one cluster what group over here and there's another cluster or group over here.This is a particular type of unsupervised learning,called a clustering algorithm.Because it places the unlabeled data,into different clusters and it turns out to be used in many applications.
【Eg one —Clustering:Google news】
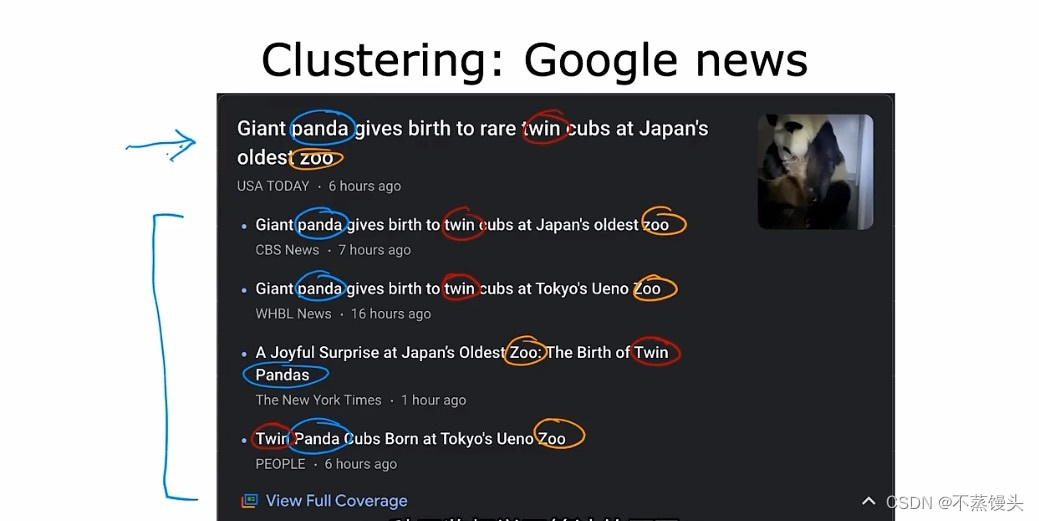
->For example,clustering is used in google news,what google news does is every day it goes.And
looks at hundreds of thousands of new articles on the internet,and groups related stories together.For example,here is a sample from Google News,where the headline of the top article,is giant panda gives birth to rear twin cubs at Japan's oldest zoo.you might notice that below this are other related articles.Maybe from the headlines alone,you can start to guess what clustering might be doing.Notice that the word panda appears here here,here,here and here and notice that the word twin also appears in all five articles.And the word Zoo also appears in all of these articles, so the clustering algorithm is finding articles. All of all the hundreds of thousands of news articles on the internet that day,finding the articles that mention similar words and grouping them into clusters.Now, what's cool is that this clustering algorithm figures out on his own which words suggest, that certain articles are in the same group.What I mean is there isn't an employee at google news who's telling the algorithm to find articles that the word panda. And twins and zoo to put them into the same cluster, the news topics change every day.And there are so many news stories,it just isn't feasible to people doing this every single day for all the topics that use covers.Instead the algorithm has to figure out on his own without supervision,what are the clusters of news articles today.So that's why this clustering algorithm,is a type of unsupervised learning algorithm.
【Eg two —Clustering:DNA microarray】
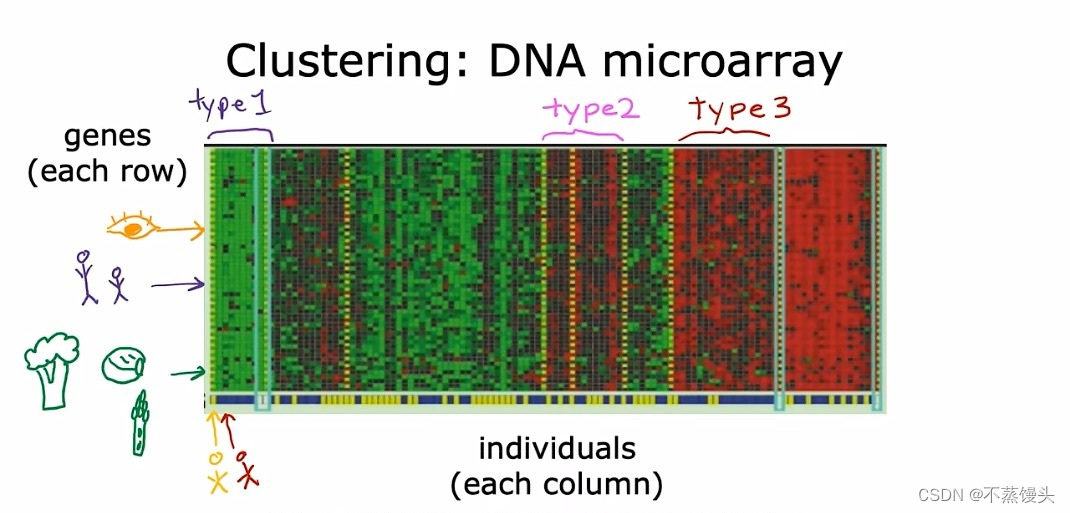
->Let's look at the second example of unsupervised learning applied to clustering genetic or DNA data. This image shows a picture of DNA micro array data, these look like tiny grids of a spreadsheet. And each tiny column represents the genetic or DNA activity of one person, So for example, this entire Column here is from one person's DNA. And this other column is of another person, each row represents a particular gene. So just as an example, perhaps this role here might represent a gene that affects eye color, or this role here is a gene that affects how tall someone is. Researchers have even found a genetic link to whether someone dislikes certain vegetables, such as broccoli, or brussels sprouts,or asparagus.The idea is to measure how much certain genes, are expressed for each individual person.So these colors red, green, gray, and so on, show the degree to which different individuals do,or do not have a specific gene active. And what you can do is then run a clustering algorithm to group individuals into different categories. Or different types of people like maybe these individuals that group together, and let's just call this type one. And these people are grouped into type two, and these people are groups as type three.This is unsupervised learning,because we're not telling the algorithm in advance,that there is a type one person with certain characteristics.Or a type two person with certain characteristics, instead what we're saying is here's a bunch of data. I don't know what the different types of people are but can you automatically find structure into data.And automatically figure out whether the major types of individuals,since we're not giving the algorithm the right answer for the examples in advance.
【Eg three —Clustering:DNA microarray】
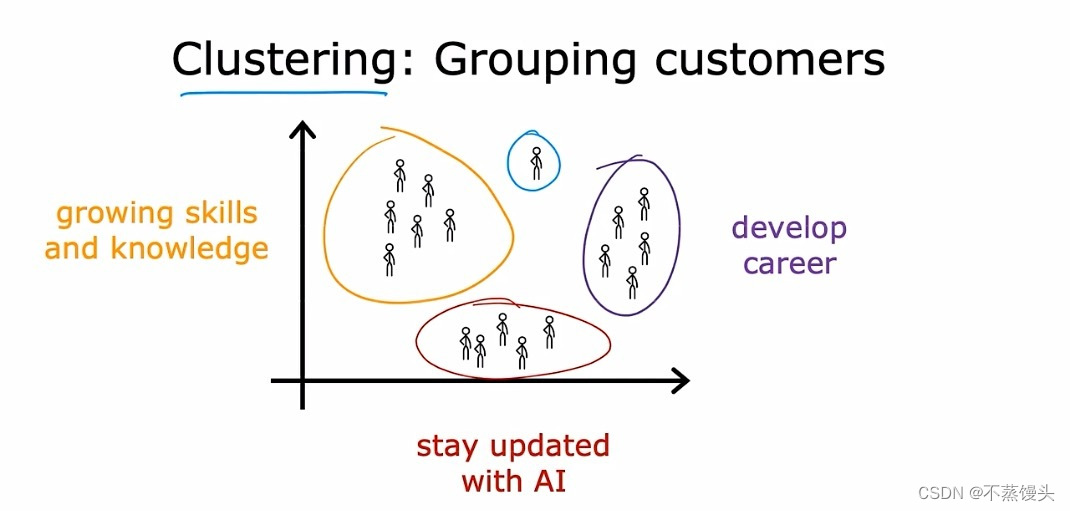
->This is unsupervised learning, here's the third example,many companies have huge databases of customer information given this data.Can you automatically group your customers into different market segments so that you can more efficiently serve your customers.Concretely the deep learning dot AI team did some research to better understand the deep learning dot AI community. And why different individuals take these classes, subscribed to the batch weekly newsletter,or attend our AI events. Let's visualize the deep learning dot AI community, as this collection of people running clustering.That is market segmentation found a few distinct groups of individuals, one group's primary motivation is seeking knowledge to grow their skills. Perhaps this is you, and so that's great,a second group's primary motivation is looking for a way to develop their career.Maybe you want to get a promotion or a new job,or make some career progression if this describes you,that's great too. And yet another group wants to stay updated on how AI impacts their field of work, perhaps this is you,that's great too.This is a clustering that our team used to try to better serve our community as we're trying to figure out. Whether the major categories of learners in the deeper and community, So if any of these is your top motivation for learning, that's great.Or in case this is you,and you want something totally different than the other three categories.That's fine too,so to summarize a clustering algorithm.Which is a type of unsupervised learning algorithm,takes data without labels and tries to automatically group them into clusters. And besides clustering, there are other types of unsupervised learning as well. Let's go on to take a look at some other types of unsupervised learning algorithms.
->Let's give a slightly more formal definition of unsupervised learning and take a quick look at some other types of unsupervised learning other than clustering. Whereas in supervised learning, the data comes with both inputs x and input labels y, in unsupervised learning, the data comes only with inputs x but not output labels y, and the algorithm has to find some structure or some pattern or something interesting in the data. We're seeing just one example of unsupervised learning called a clustering algorithm, which groups similar data points together.In this specialization,you'll learn about clustering as well as two other types of unsupervised learning. One is called anomaly detection, which is used to detect unusual events. This turns out to be really important for fraud detection in the financial system, where unusual events,unusual transactions could be signs of fraud and for many other applications.You also learn about dimensionality reduction. This lets you take a big data-set and almost magically compress it to a much smaller data-set while losing as little information as possible. In case anomaly detection and dimensionality reduction don't seem to make too much sense to you yet. We'll get to this later in the specialization.
【Question]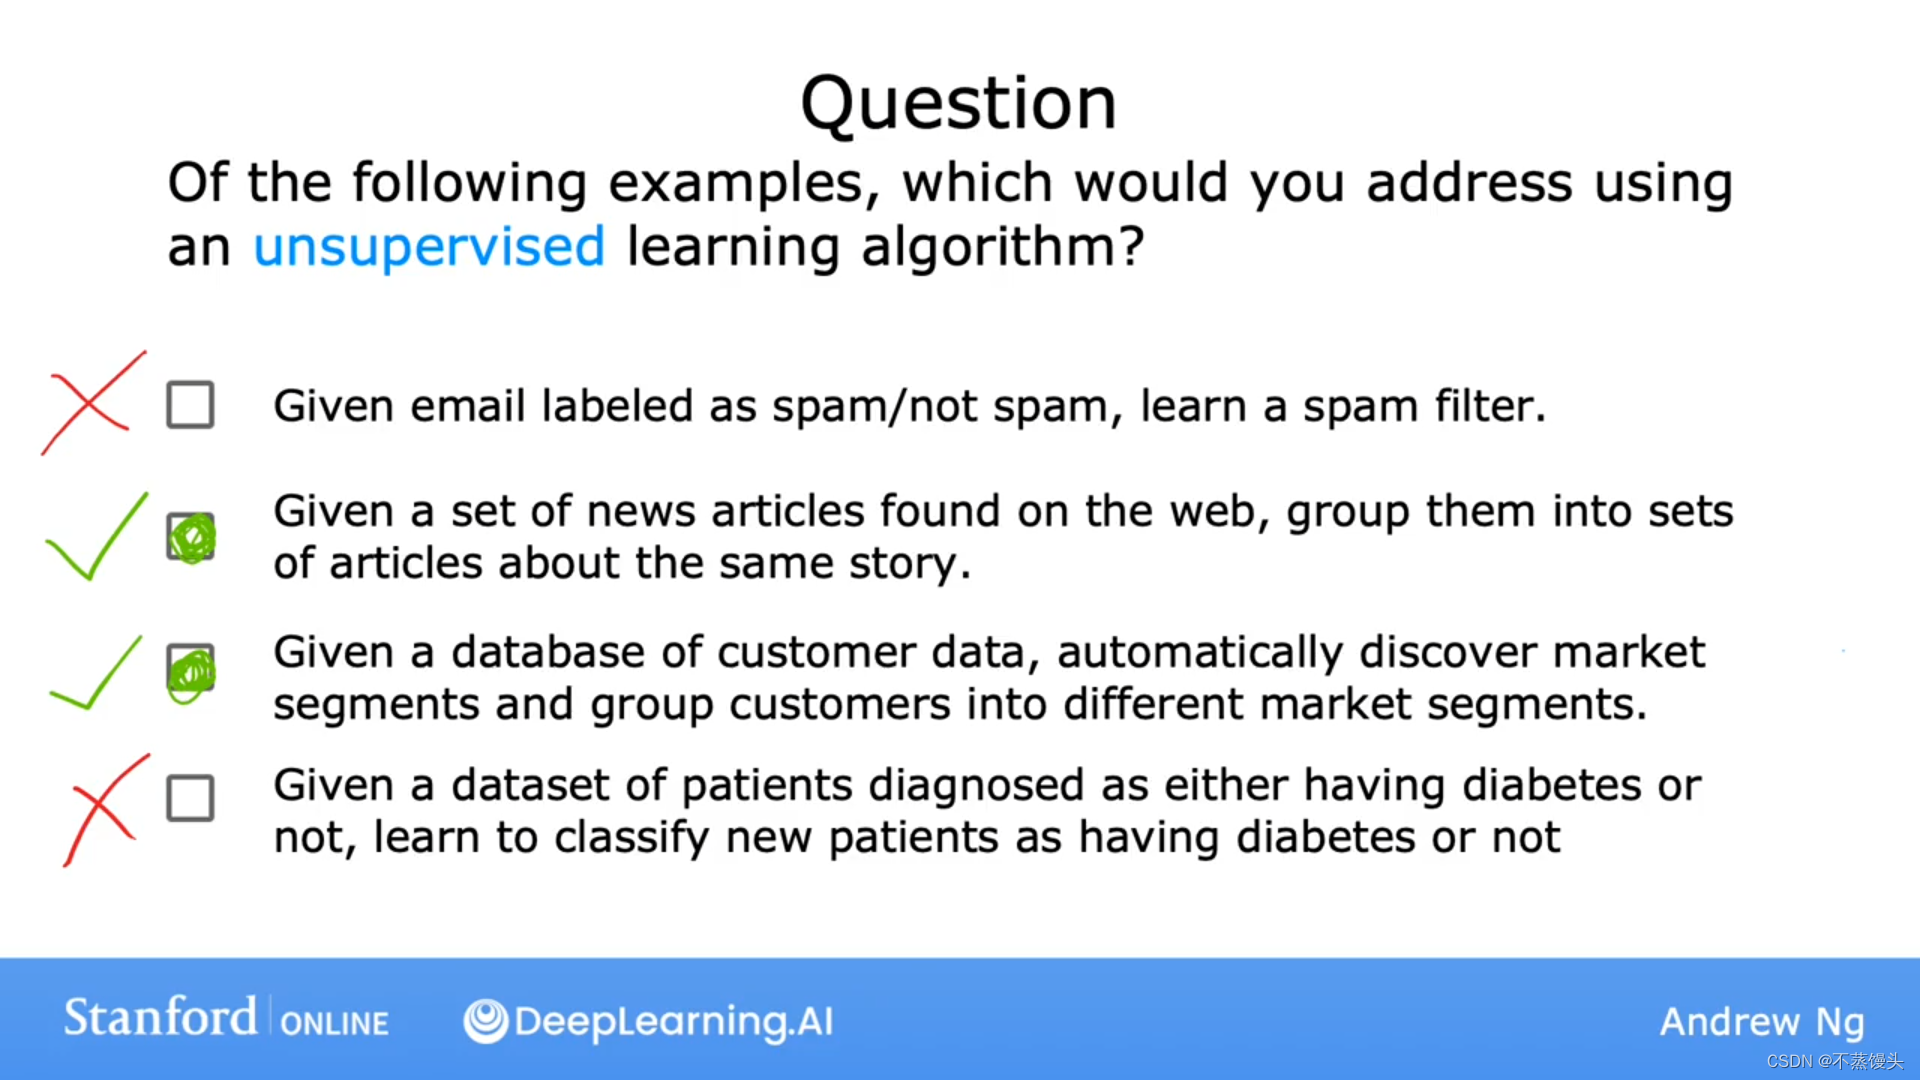
->Please select any of the following that you think are examples of unsupervised learning. Two are unsupervised examples and two are supervised learning examples. Please take a look. Maybe you remember the spam filtering problem. If you have labeled data you now label as spam or non-spam e-mail, you can treat this as a supervised learning problem. The second example, the news story example. That's exactly the Google News and tangible example that you saw in the last video. You can approach that using a clustering algorithm to group news articles together. That we'll use unsupervised learning. The market segmentation example that I talked about a little bit earlier. You can do that as an unsupervised learning problem as well because you can give your algorithm some data and ask it to discover market segments automatically. The final example on diagnosing diabetes. Well, actually that's a lot like our breast cancer example from the supervised learning videos. Only instead of benign or malignant tumors, we instead have diabetes or not diabetes. You can approach this as a supervised learning problem, just like we did for the breast tumor classification problem.
5.Summary
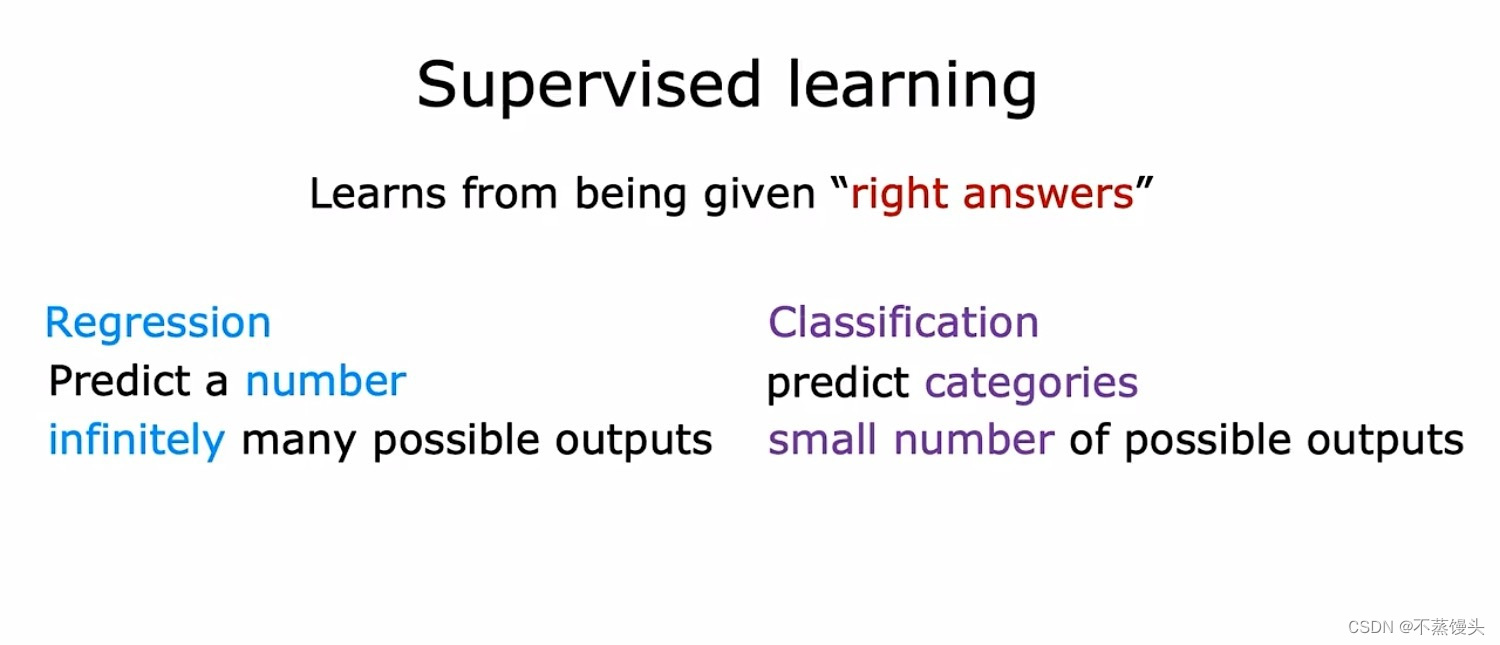
(1)Supervised learning algorithms maps input x to output y,where the learning algorithm learns from the quote right answers.
(2)The two major types of supervised learning are regression and classification.In a regression application like predicting prices of houses,the learning algorithm has to predict numbers from infinitely many possible output numbers.Whereas in classification the learning algorithm has to make a prediction of a category,all of a small set of possible outputs.
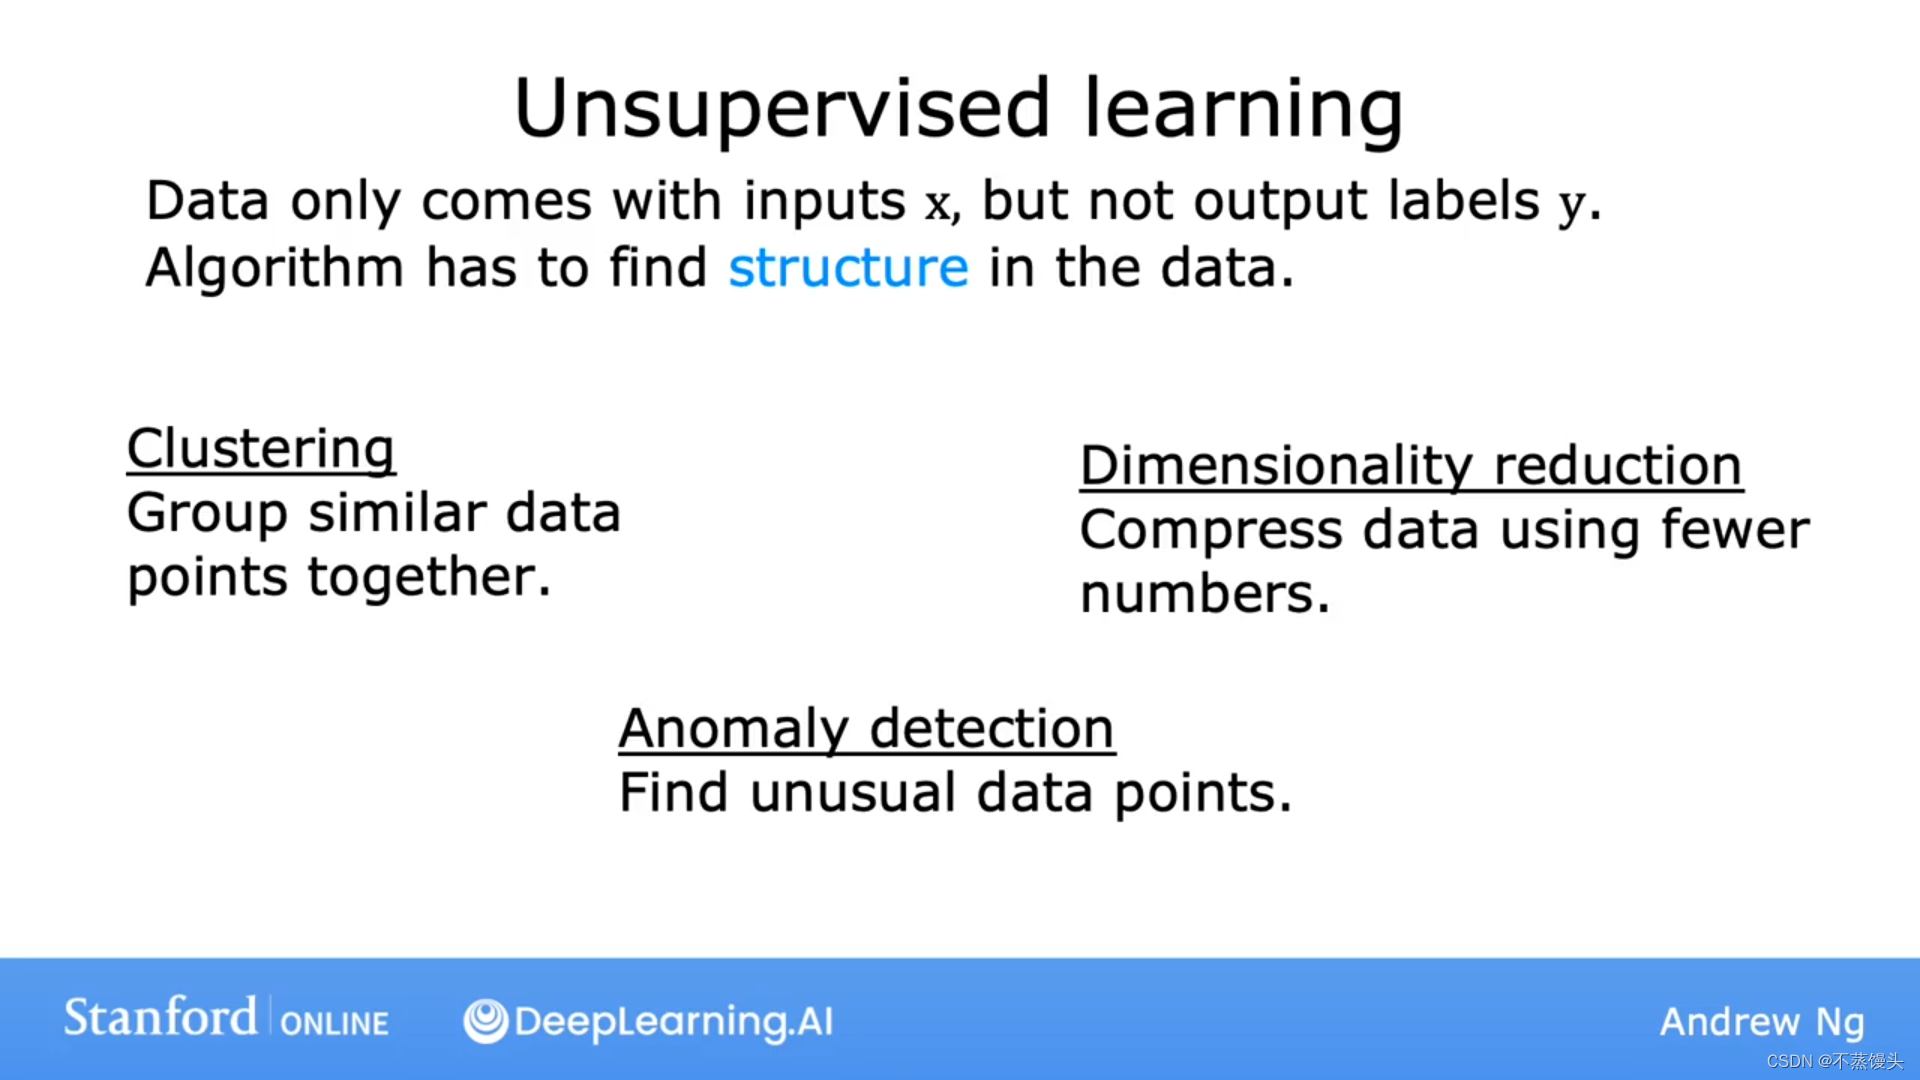
(1)In unsupervised learning, the data comes only with inputs x but not output labels y, and the algorithm has to find some structure or some pattern or something interesting in the data.
(2)The three major types of unsupervised learning are clustering algorithm,anomaly detection and dimensionality reduction.Clustering algorithm groups similar data points together.Anomaly detection is used to detect unusual events and dimensionality reduction lets you take a big data-set and almost magically compress it to a much smaller data-set while losing as little information as possible.


 644
644


 被折叠的 条评论
为什么被折叠?
被折叠的 条评论
为什么被折叠?
 到【灌水乐园】发言


