


📣 前言
- 👓 可视化主要使用 plotly
- 🔎 数据处理主要使用 pandas
- 🕷️ 数据爬取主要使用 requests
- 👉 本文是我自己在和鲸社区的原创
今天这篇文章将给大家介绍【🧋Python数据可视化全国奶茶饮品加盟数据】
案例。
Step 1. 导入模块
import numpy as np
import pandas as pd
import plotly.graph_objects as go
import plotly.express as px
import jieba
from stylecloud import gen_stylecloud
from IPython.display import Image # 用于在jupyter lab中显示本地图片
import warnings
from pandas.core.common import SettingWithCopyWarning

warnings.filterwarnings('ignore', category=SettingWithCopyWarning)
Step 2. 数据概览
数据下载:关注公众号,回复关键词【奶茶数据】
df1 =pd.read_excel(r"/home/mw/input/naic5590/加盟信息_231214_1702546097.xlsx")
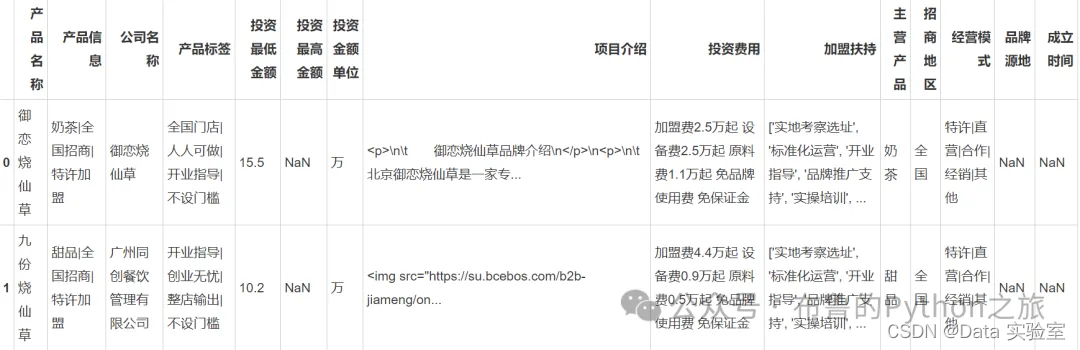
df1.head()
输出结果:
df1.info()
输出结果:
<class 'pandas.core.frame.DataFrame'>
RangeIndex: 6264 entries, 0 to 6263
Data columns (total 15 columns):
产品名称      6264 non-null object
产品信息      6264 non-null object
公司名称      6264 non-null object
产品标签      6264 non-null object
投资最低金额    6264 non-null float64
投资最高金额    801 non-null float64
投资金额单位    6264 non-null object
项目介绍      6264 non-null object
投资费用      5764 non-null object
加盟扶持      6264 non-null object
主营产品      6255 non-null object
招商地区      6264 non-null object
经营模式      6252 non-null object
品牌源地      1554 non-null object
成立时间      1029 non-null object
dtypes: float64(2), object(13)
memory usage: 734.1+ KB
Step 3. 数据处理
3.1 数据去重
df1 = df1.drop_duplicates(subset=['产品名称'])
3.2 筛选奶茶饮品数据
keywords = ['奶', '茶', '咖啡', '饮品', '饮料']
# 使用 str.contains 方法进行筛选
filtered_df = df1[df1['产品信息'].str.contains('|'.join(keywords), na=False)]
# 输出筛选结果
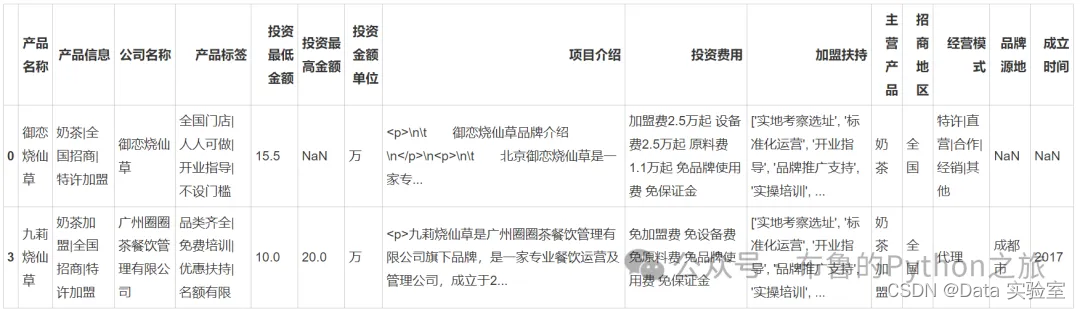
filtered_df.head(2)
输出结果:
3.3 拆分列
# 拆分并创建新列
filtered_df[['加盟费', '设备费', '原料费', '品牌使用费', '保证金']] = filtered_df['投资费用'].str.split(' ', expand=True)
filtered_df["加盟费"] = filtered_df["加盟费"].apply(lambda x: str(x).replace("加盟费", "").replace("万起", "").replace("万", '').replace("0-", '').replace("免", '0'))
filtered_df["设备费"] = filtered_df["设备费"].apply(lambda x: str(x).replace("设备费", "").replace("万起", "").replace("免", '0').replace("万", '').replace("0-", ''))
filtered_df["原料费"] = filtered_df["原料费"].apply(lambda x: str(x).replace("原料费", "").replace("万起", "").replace("免", '0').replace("万", '').replace("0-", ''))
filtered_df["品牌使用费"] = filtered_df["品牌使用费"].apply(lambda x: str(x).replace("品牌使用费", "").replace("万起", "").replace("免", '0').replace("万", '').replace("0-", ''))
filtered_df["保证金"] = filtered_df["保证金"].apply(lambda x: str(x).replace("保证金", "").replace("万起", "").replace("免", '0').replace("万", '').replace("0-", ''))
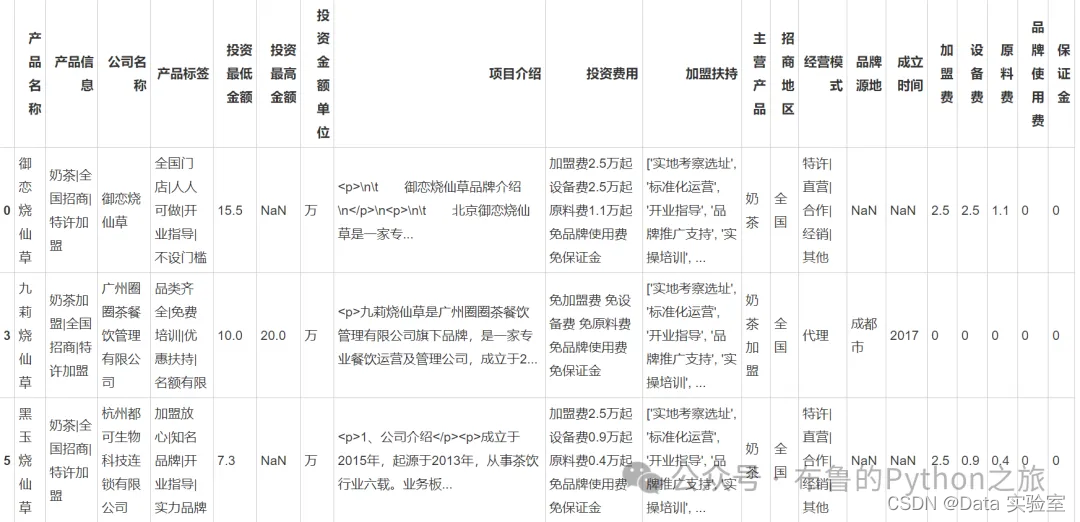
filtered_df.head(3)
输出结果:
print("——" * 10)
print('数据集存在重复值个数:')
print(filtered_df.duplicated().sum())
print("——" * 10)
print('数据集缺失值情况:')
print(filtered_df.isna().sum())
print("——" * 10)
print('数据集各字段类型:')
print(filtered_df.dtypes)
print("——" * 10)
print('数据总体概览:')
print(filtered_df.info())
输出结果:
————————————————————
数据集存在重复值个数:
0
————————————————————
数据集缺失值情况:
产品名称         0
产品信息         0
公司名称         0
产品标签         0
投资最低金额       0
投资最高金额    2501
投资金额单位       0
项目介绍         0
投资费用       113
加盟扶持         0
主营产品         2
招商地区         0
经营模式         1
品牌源地      2223
成立时间      2409
加盟费          0
设备费          0
原料费          0
品牌使用费        0
保证金          0
dtype: int64
————————————————————
数据集各字段类型:
产品名称       object
产品信息       object
公司名称       object
产品标签       object
投资最低金额    float64
投资最高金额    float64
投资金额单位     object
项目介绍       object
投资费用       object
加盟扶持       object
主营产品       object
招商地区       object
经营模式       object
品牌源地       object
成立时间       object
加盟费        object
设备费        object
原料费        object
品牌使用费      object
保证金        object
dtype: object
————————————————————
数据总体概览:
<class 'pandas.core.frame.DataFrame'>
Int64Index: 2647 entries, 0 to 6258
Data columns (total 20 columns):
产品名称      2647 non-null object
产品信息      2647 non-null object
公司名称      2647 non-null object
产品标签      2647 non-null object
投资最低金额    2647 non-null float64
投资最高金额    146 non-null float64
投资金额单位    2647 non-null object
项目介绍      2647 non-null object
投资费用      2534 non-null object
加盟扶持      2647 non-null object
主营产品      2645 non-null object
招商地区      2647 non-null object
经营模式      2646 non-null object
品牌源地      424 non-null object
成立时间      238 non-null object
加盟费       2647 non-null object
设备费       2647 non-null object
原料费       2647 non-null object
品牌使用费     2647 non-null object
保证金       2647 non-null object
dtypes: float64(2), object(18)
memory usage: 434.3+ KB
None
Step 4.数据分析可视化
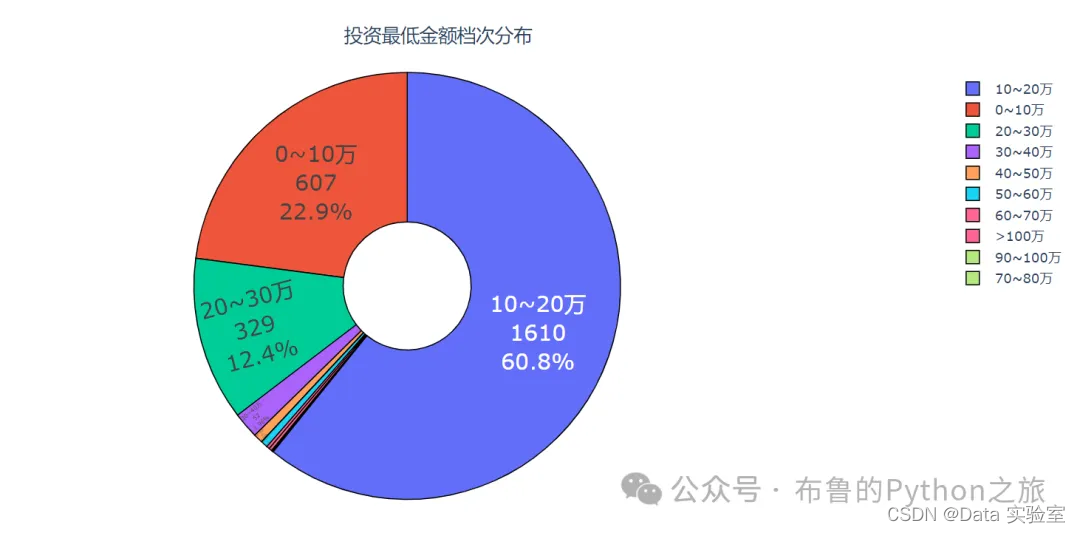
4.1 投资档次分布
def trans(x):
    if x<=10:
        return "0~10万"
    elif 10 < x <= 20:
        return "10~20万"
    elif 20 < x <= 30:
        return "20~30万"
    elif 30 < x <= 40:
        return "30~40万"
    elif 40 < x <= 50:
        return "40~50万"
    elif 50 < x <= 60:
        return "50~60万"
    elif 60 < x <= 70:
        return "60~70万"
    elif 70 < x <= 80:
        return "70~80万"
    elif 80 < x <= 90:
        return "80~90万"
    elif 90 < x <= 100:
        return "90~100万"
    elif x>100:
        return ">100万"
filtered_df["投资档次"] = filtered_df["投资最低金额"].apply(lambda x: trans(x))
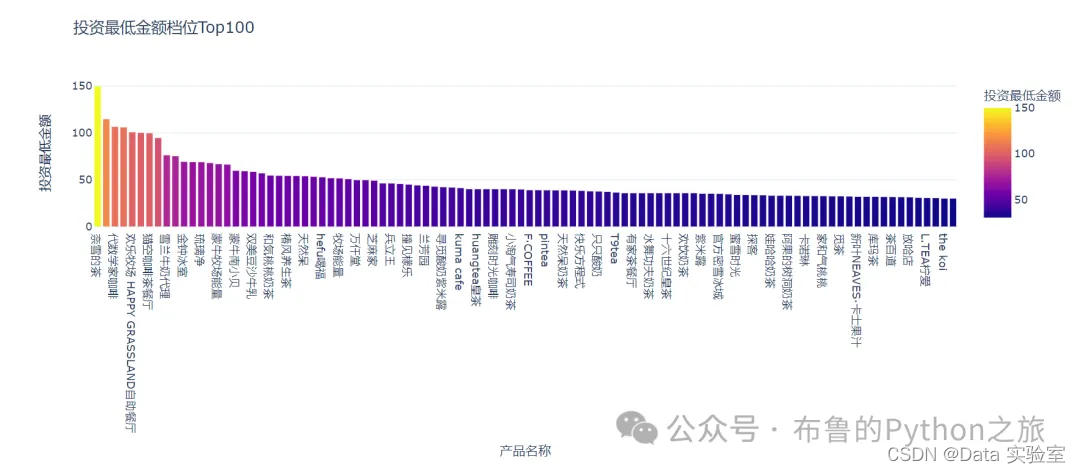
4.2 投资金额Top榜单
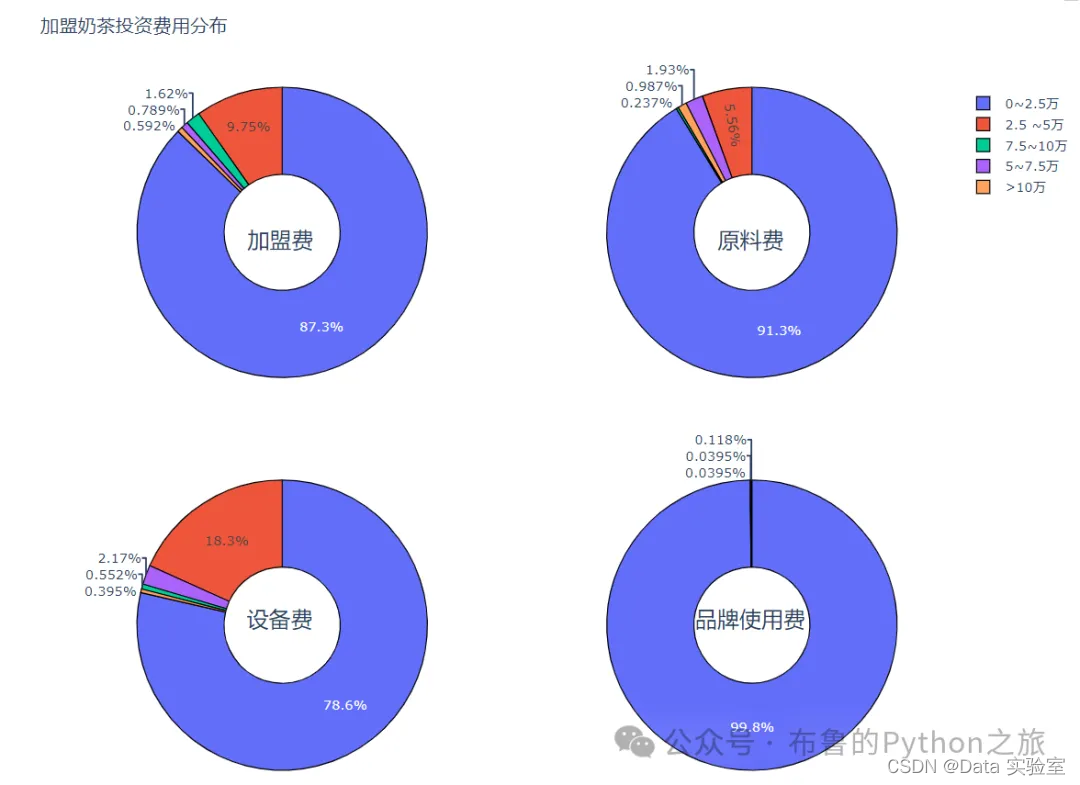
4.3 加盟奶茶投资费用分布
def trans_1(x):
    x = float(x)
    if x<=2.5:
        return "0~2.5万"
    elif 2.5 < x <= 5:
        return "2.5 ~5万"
    elif 5 < x <= 7.5:
        return "5~7.5万"
    elif 7.5 < x <= 10:
        return "7.5~10万"
    elif x>10:
        return ">10万"
filtered_df["加盟费档次"] = filtered_df["加盟费"].apply(lambda x: trans_1(x))
filtered_df["原料费档次"] = filtered_df["原料费"].apply(lambda x: trans_1(x))
filtered_df["设备费档次"] = filtered_df["设备费"].apply(lambda x: trans_1(x))
filtered_df["品牌使用费档次"] = filtered_df["品牌使用费"].apply(lambda x: trans_1(x))
jmf = filtered_df["加盟费档次"].value_counts()
ylf = filtered_df["原料费档次"].value_counts()
sbf = filtered_df["设备费档次"].value_counts()
ppssyf = filtered_df["品牌使用费档次"].value_counts()
输出结果:
4.4 加盟扶持标语词云图
import ast

jmComments = df1["加盟扶持"].tolist()

hots = []
for jmComment in jmComments:
    Comment = ast.literal_eval(jmComment)
    for h in Comment:
        hots.append(h)
title_content = ','.join(hots)
cut_text = jieba.cut(title_content)
result = ' '.join(cut_text)

# 读入停用词表
exclude = []

with open(r"/home/mw/中文停用词库.txt", 'r', encoding='gbk') as f:
    lines = f.readlines()
    for line in lines:
        exclude.append(line.strip())
 # 添加停用词
exclude.extend([""])
输出结果:

4.5 产品标签词云图
title_content = ','.join(df1["产品标签"].tolist())
cut_text = jieba.cut(title_content)
result = ' '.join(cut_text)

# 读入停用词表
exclude = []

with open(r"/home/mw/中文停用词库.txt", 'r', encoding='gbk') as f:
    lines = f.readlines()
    for line in lines:
        exclude.append(line.strip())
 # 添加停用词
exclude.extend([""])

完整代码👇
https://www.heywhale.com/mw/project/657c006b3a9aa28a45bfdedf
ps:访问链接点击【在线运行】即可查看完整代码,且不需要担心环境配置问题
数据集下载
关注公众号,回复关键字获取
- END -
以上就是本期为大家整理的全部内容了,喜欢的朋友可以点赞、点在看也可以分享让更多人知道。

👆 关注**「布鲁的Python之旅」**第一时间收到更新


 3万+
3万+

 被折叠的 条评论
为什么被折叠?
被折叠的 条评论
为什么被折叠?
 到【灌水乐园】发言


