


论文全名:Graph neural network and machine learning analysis of functional neuroimaging for understanding schizophrenia
数据集:UCLA Consortium for Neuropsychiatric Phenomics LA5c (UCLA Consortium for Neuropsychiatric Phenomics LA5c Study - OpenNeuro)
论文代码:SUPPLEMENTARY CODE - Google 云端硬盘
英文是纯手打的!论文原文的summarizing and paraphrasing。可能会出现难以避免的拼写错误和语法错误,若有发现欢迎评论指正!文章偏向于笔记,谨慎食用
目录
2.3.3. Creation of brain network
2.3.6. Comparison of binarizing thresholds
2.3.9. Graph neural networks (GNN)
2.4.3. Interpretability of models
2.5.1. Optimal binarizing threshold to represent functional networks
2.5.2. Comparison of ML models and GNN
2.5.3. Biomarkers for schizophrenia
3.2. Grid Search Cross Validation
3.3. SHAP (SHapley Additive exPlanations)
3.4. Univariate Feature Selection
1. 省流版
1.1. 心得
(1)虽然FC直接做和弦图很漂亮,但是感觉就是比FC矩阵差了点直观性(计算性能)
(2)没太必要给FC和邻接矩阵的例子吧我丢
(3)评估的标准好多
1.2. 论文总结图

2. 论文逐段精读
2.1. Abstract
2.1.1. Background
①They use both GNN and ML in SCZ rs-fMRI analysis
②Only one site is used in this paper to aviod cross-site influence
2.1.2. Results
①69 graph theory metrics are used for measurements
②Your "deep graph convolutional neural network (DGCNN)"?
on par with 与…不相上下;与...同等水平;与……平分秋色
2.1.3. Conclusions
①They tested the SCZ detection and biomarker finding
2.2. Background
①They aim to comprehend and identify SCZ
②⭐Proposing 2 feature selection methods: a) RLF feature selection, b) SpeCo
③Overall workflow:

2.3. Materials and methods
2.3.1. Data
①Dataset: UCLA Consortium for Neuropsychiatric Phenomics LA5c
②Sample: 50 SCZ and 122 NC (imbalanced, hence ⭐augments it)
2.3.2. Preprocessing
①Voxel:
②Preprocessing steps: functional realignment, slice timing correction, outlier detection, segmentation and normalization, functional smoothing, and temporal bandpass filtering
③AAL3 and Harvard-Oxford Cortical Atlas(为什么是两个?还都是164?所以是作者自己提出来的结合版本?)
④Visualized preprocessing steps:

2.3.3. Creation of brain network
①Introducing Pearson correlation after Fisher transforming:
②Correlations between each ROI (164):
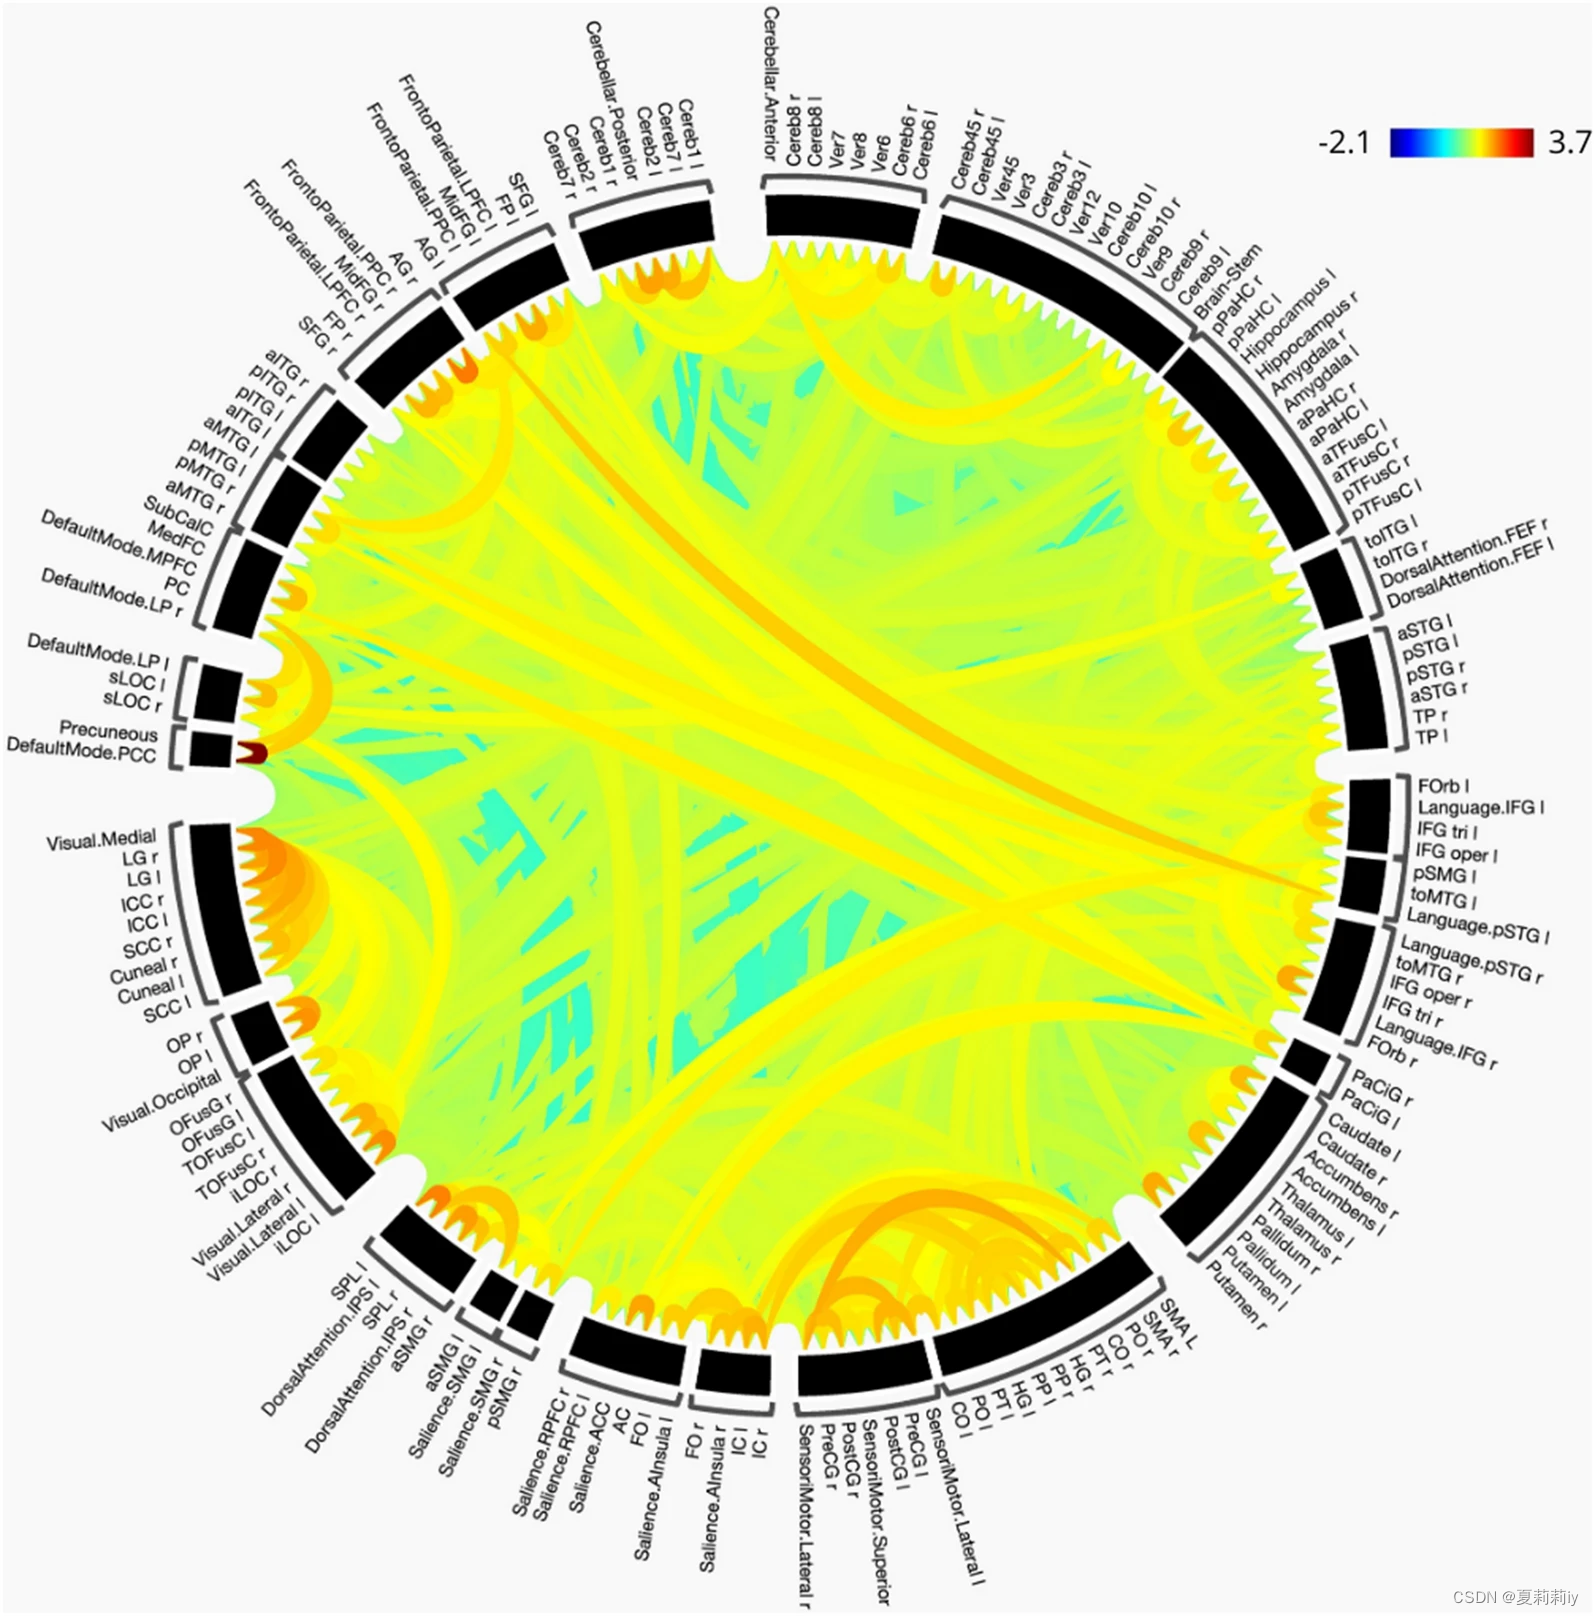
(好漂亮的图...)
(1)Binarization of brain network
①They reconstruct the connections (adjacency matrix with 0 or 1) by hard threshold 0.00、0.05、0.10、0.15、0.20、0.25、0.30、0.35、0.40
②Original FC:

③Adjacency matrix generated by threshold constraint:

2.3.4. Feature generation
①⭐Abstract of generated feature(whaaaaaaat?啊??):

2.3.5. Preliminary analysis
①The average weighted matrices of NC and SCZ:

(首先我想问的是这差别真有这么大?其次,右边的颜色衡量度不一样那你在比什么啊???我哪里看得出来啊?)
②The average maximal cliques of SCZ are 2.5-3 times higher than NC
③The average clustering coefficient of SCZ is lower than NC
④The average shortest path length of SCZ is higher than NC
⑤不行了这哥们儿统计学太好了我要晕了。“通过首先对属于这两个类别中每个类别的所有主题的每个 ROI 的每个节点特征进行平均来进行比较。这导致26×164即精神分裂症和对照组受试者分别有 4, 264 个特征。然后,对每个 ROI 所属的平均集团数量进行了比较。与对照组相比,精神分裂症受试者的 46 个 ROI 包含在超过 220% 的集团中。与对照组相比,精神分裂症受试者的 90 个 ROI 包含在超过 170% 的集团中。”
2.3.6. Comparison of binarizing thresholds
①⭐⭐Isolated nodes hinder feature aggregation
| Threshold value | subjects of isolated node |
| 0.35 | 42/172 |
| 0.4 | 115/172 |
②Comparison table of 3 ML models (Random Forest, XGBoost, and AdaBoost) with 0.3 threshold value ceilling and 10-fold Grid Search Cross Validation:

they perform best when threshold equals to 0.2 (on average)
hindrance n.妨碍;阻挠;造成妨碍的人(或事物)
2.3.7. Data augmentation
①Data augmentation: randomly selecting 5 ROIs in each subject, and adding noise between 0-0.3
②Label generation: the collective decision of RF and XGBoost(生成多少个啊?), "and the synthetic matrices having a tie in the votes are dropped"
2.3.8. Machine learning
①ML: AdaBoost, Decision Tree, K Nearest Neighbours (KNN), Support Vector Machine (SVM), and Logistic Regression
2.3.9. Graph neural networks (GNN)
①Inputs: "binary graphs along with binary and weighted nodal properties"(二值化的图和二值化并且带权节点特征?二值化的图是01邻接矩阵吗?节点特征是什么?你说输入是节点特征有d用啊???我写论文也写输入是边缘特征和节点特征算了)
②Optimizer: early stop with Adam and supervised learning
(1)Graph convolutional network
①GCN model:

(八层GCN...............................吗...........)
(2)Deep graph convolutional neural network
①DGCNN:

(“DGCNN使用一种独特的SortPooling技术,该技术在卷积操作中以一致的顺序对节点进行排序,将同构图映射到相同的输出标签,这在训练具有结构差异的图时很有用”。作者凭什么认为脑图的结构差异会很大?分子可能有这样的:
| 区分类型 | 节点特征 | 边缘特征 | 结构特征 |
| 同分异构体 | 相同 | 可能不同 | 不同 |
| 同素异形体/同位素(不懂) | 相同 | 好像不一样 | 一定不同 |
| 同构体 | 不同 | 不同 | 相同 |
| 普通分子差异 | 不同 | 不同 | 不同 |
按理来说分子有结构差异可能性蛮高的。但是脑图结构差异大概率看模型作者怎么去构建图,如果是取全连接那就纯纯没差异了)
2.3.10. Biomarker detection
(1)Method 1: ROI, local feature pair (RLF) feature selection
①There are 164 (ROIs) * 26 (local features, 21+5) = 4264 features for each subject
②Combining SHAP and uni-variate feature selection (你又来了,结合这俩是怎么结合?对俩取平均?), they choose top 100 RLF
(2)Method 2: Spectral clustering and co-occurrence detection (SpeCo)
①“使用 SpeCo,利用光谱聚类将 ROI 分离到聚类中。然后,分别为精神分裂症和对照受试者创建一个共现矩阵。这些矩阵的维度为164×164,分别记录每个精神分裂症患者和对照受试者在同一集群中所有 ROI 对的共同出现。然后,通过采用统计多数对值进行归一化,即,如果聚类中某个对的共现超过预定义的阈值,则该对将被标记为共现对。该方法已在范围 (2, 5) 中具有不同数量的聚类和范围内统计多数 (90–95%) 的不同阈值运行。精神分裂症或对照组受试者同时出现但两者不同时发生的对被认为有助于区分精神分裂症和非精神分裂症受试者。”
2.4. Results
2.4.1. Classifier performance
①“SVM 的高特异性对于确保健康个体不会被错误地归类为患有疾病非常重要,因为假阳性会导致不必要的医疗程序”。这句话敢写?我超。宁愿十个正常人被错误地诊断为有病,都不愿意一个患病被诊断为没病,吧?。
②Comparison table:

2.4.2. Salient brain regions
(1)RLF pairwise feature selection
①Selected prominent regions:
| Supramarginal Gyrus (anterior division) | "relevant to language-related disorders, working memory deficits, or phonological processing impairments" |
| Inferior Temporal Gyrus (posterior, temporooccipital, anterior division) | "relate to visual processing disorders, object recognition deficits, or semantic memory impairments" |
| Superior Temporal Gyrus (posterior division, Left) | "auditory processing disorders, speech perception difficulties, or language comprehension deficits" |
| Superior Parietal Lobule (Right) | "relevant to attention deficits, spatial cognition impairments, or motor planning difficulties" |
| Middle Temporal Gyrus (temporooccipital part, Right) | "relate to semantic processing disorders, language comprehension impairments, or difficulties in integrating visual and linguistic information" |
(2)SpeCo detection
①Selected prominent pairwise regions:
| left one | right one | |
| Frontoparietal Right (Posterior Parietal Cortex) and Angular Gyrus Right | "attentional processes, spatial awareness, or executive functions" | "language-related disorders, spatial cognition deficits, or multi-sensory integration impairments" |
| Central Opercular Cortex Right and Planum Temporale Left, and Dorsal Attention Left (IPS) | voluntary motor movement | auditory processing |
| Superior Parietal Lobule Left | spatial attention | |
②Significant regions in two methods:

2.4.3. Interpretability of models
(1)SHAP values
①Importance level of edge features by SHAP:

(2)GNNExplainer
①Important features: page rank centrality, effective size, greedy coloring, local reaching centrality, and number of cliques
2.5. Discussion
2.5.1. Optimal binarizing threshold to represent functional networks
①They test 9 thresholds from 0.0-0.3
②⭐They did not consider negative edges
2.5.2. Comparison of ML models and GNN
①ML models (except DT) judge and weigh SPE and SEN, yet GNN balances them
2.5.3. Biomarkers for schizophrenia
①Their results of biomarkers
3. 知识补充
3.1. Average maximal cliques
"Average maximal cliques" 这个短语可以翻译为“平均最大团”。在图论中,一个团(clique)指的是一个图中的完全子图,即子图中任意两个顶点之间都存在一条边。而最大团(maximal clique)指的是一个团,它不能通过添加图中已存在的顶点来扩展成一个更大的团。
"平均最大团" 通常指的是在一个图中所有最大团的大小(即包含的顶点数)的平均值。这个度量在某些图的分析中可能很有用,例如在社会网络分析中,团可能代表紧密联系的群体,而平均最大团的大小可能反映了网络中这种紧密联系群体的平均规模。
要计算平均最大团,通常需要先找出图中的所有最大团,然后计算它们的平均大小。这通常是一个计算密集型的任务,因为找出所有最大团本身就是一个NP-hard问题,即没有已知的快速算法可以在所有情况下都有效地解决这个问题。因此,对于大型图,可能需要采用近似算法或启发式方法来估计平均最大团的大小。
3.2. Grid Search Cross Validation
(1)定义:网格搜索交叉验证是一种结合了网格搜索和交叉验证的技术,用于机器学习模型的超参数调优和模型选择。
(2)例子:
网格搜索交叉验证在网格搜索的每一轮中都会使用交叉验证来评估超参数组合的性能。具体来说,对于每个超参数组合,都会使用交叉验证来评估模型的性能,通常是通过计算验证集上的平均性能得分。最终,选择性能得分最高的超参数组合作为最优组合,并使用这组超参数建立最终的模型。
举个例子,假设我们有一个支持向量机(SVM)模型,需要调优的超参数是C(正则化强度)和gamma(核函数的系数)。我们可以为这两个参数设定一系列的候选值,形成一个网格。然后,对于网格中的每一组(C,gamma)组合,我们都使用交叉验证(比如5折交叉验证)来评估模型在验证集上的性能。最后,我们选择性能最好的那组(C,gamma)作为最优参数组合,并使用这组参数来训练最终的SVM模型。
3.3. SHAP (SHapley Additive exPlanations)
SHAP是一种基于博弈论的可解释性方法,用于评估每个特征对预测结果的贡献。它基于Shapley值,这是一种经济学家Lloyd Shapley提出的博弈论概念,用于确定个体在合作中的贡献。SHAP将Shapley值解释为一种加性特征归因方法,将模型的预测值解释为二元变量的线性函数。这种方法不仅提供纯粹的预测结果,还可以解释每个预测的因素,为数据科学家和机器学习从业者提供了审查和验证模型预测的框架。
3.4. Univariate Feature Selection
单变量特征选择是一种基于一些单变量的统计度量方法来选择最好的特征的方法,比如卡方检测等。这种方法主要关注每个特征与目标变量之间的关联强度,而不是特征之间的相互作用。Scikit-learn等机器学习库提供了多种单变量特征选择的方法,例如SelectKBest、SelectPercentile等,这些方法可以根据特定的评分准则来选择特征。
4. Reference List
Sunil, G. et al. (2024) 'Graph neural network and machine learning analysis of functional neuroimaging for understanding schizophrenia', BMC Neuroscience, 25. doi: Graph neural network and machine learning analysis of functional neuroimaging for understanding schizophrenia | BMC Neuroscience | Full Text


 1万+
1万+


 被折叠的 条评论
为什么被折叠?
被折叠的 条评论
为什么被折叠?
 到【灌水乐园】发言


