


前面发表了Javascript加载AGV地图的文章,虽然用的是原生JS,但是绘图用的是WebGL,对于没有WebGL基础的同学来讲是有一定难度的,所以这里特地将webGL对应的代码转成2D画布,大家应用起来会更容易些。
首先还是看下效果图,做了一些简单的修改。增加了曲线的绘制。
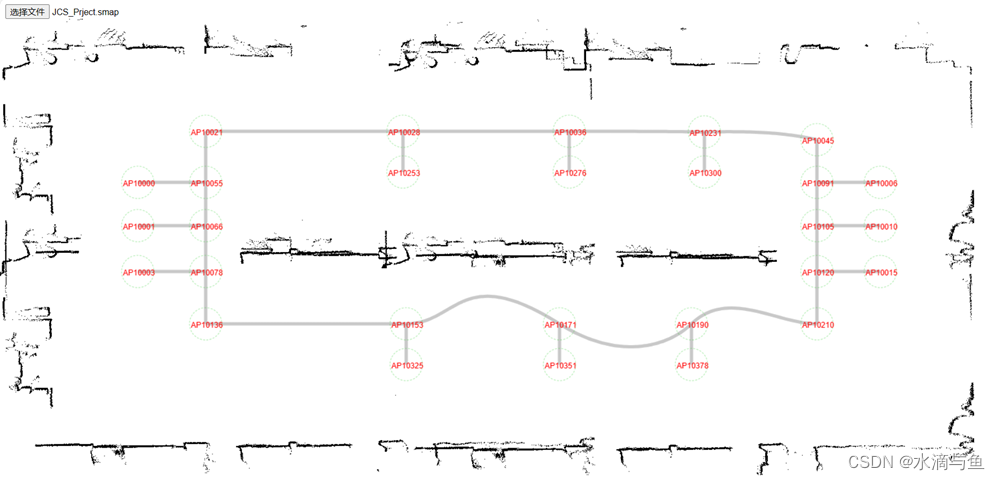
代码也是超级简单,一个html文件打包带走。
<!DOCTYPE html>
<html lang="en">
    <head>
        <title>加载地图</title>
        <meta charset="utf-8">
        <meta name="viewport" content="width=device-width, initial-scale=1">
        <style type="text/css">
            #canvasbtm{
                position:absolute;
                left:0;
                top:25;
                width:500;
                height:400;
            }
            #canvastop{
                position:absolute;
                left:0;
                top:25;
                width:500;
                height:400;
            }
        </style>
    </head>
    <body>
        <a><input aria-label="Search" type="file" id="selectFiles" onchange="LoadMap()"  value="加载smap文件" /></a>
        <div id="container">
            <div id="btmdiv">
                <canvas id="canvasbtm"></canvas>
            </div>
            <div id="topdiv">
                <canvas id="canvastop"></canvas>
            </div>
        </div>
        <script type="text/javascript">
            //底部画布,用来画点
            const canvasbtm = document.getElementById('canvasbtm');
            const ctxbtm = canvasbtm.getContext('2d');
            let scale = 1; // 初始缩放比例为1
            //画个图形,也可以是LOGO
            ctxbtm.fillStyle = 'blue';
            ctxbtm.fillRect(50, 50, 100, 100);

            //顶部画布,用来画线条
            const canvastop = document.getElementById('canvastop');
            const ctxtop = canvastop.getContext('2d');
            ctxtop.fillStyle = 'blue';
            ctxtop.fillRect(50, 50, 100, 100);
            //临时画布,先在上面画好后再画到正式画布上可以减少闪烁
            const tempcanvas = document.createElement('canvas')
            tempcanvas.width = document.getElementById("canvastop").clientWidth
            tempcanvas.height = document.getElementById("canvastop").clientHeight
            tempcanvas.id = 'tempcanvas'
            let tempctx = tempcanvas.getContext('2d') //画笔

            function LoadMap() {
                var file = document.getElementById("selectFiles").files[0];
                var name = file.name;//读取选中文件的文件名
                var path = document.getElementById("selectFiles").value;//读取选中文件的路径
                console.log("文件名:"+name+"大小:"+path);
                var reader = new FileReader();//这是核心,读取操作就是由它完成.
                reader.readAsText(file,'UTF-8');//读取文件的内容,也可以读取文件的URL
                reader.onload = function (event) {
                    //当读取完成后回调这个函数,然后此时文件的内容存储到了result中,直接操作即可
                    var res=event.target.result;
                    var strjson=JSON.parse(res);
                    //将地图缩放到最大比例
                    xmin=strjson['header']['minPos']['x'];
                    ymin=strjson['header']['minPos']['y'];

                    xmax=strjson['header']['maxPos']['x'];
                    ymax=strjson['header']['maxPos']['y'];
                    var resg=strjson['header']['resolution'];
                    //地图缩放到最大时画布的尺寸
                    var w_map=(xmax-xmin)/resg;
                    var h_map=(ymax-ymin)/resg;
                    console.log("width+height:"+w_map+"/"+h_map);

                    canvastop.width=canvasbtm.width=tempcanvas.width=w_map;
                    canvastop.height=canvasbtm.height=tempcanvas.height=h_map;

                    //画点
                    for(var m=0;m<strjson['normalPosList'].length;m++)
                    {
                        //解析出的x,y值
                        var resx=strjson['normalPosList'][m]['x'];
                        var resy=strjson['normalPosList'][m]['y'];
                        //最小值移动到0,0
                        resx=(resx-xmin)/resg;
                        resy=(resy-ymin)/resg;
                        //y轴方向由向下转为向上.
                        resy=tempcanvas.height-resy;

                        tempctx.fillStyle="rgba(0, 0, 0, 1)";
                        tempctx.fillRect(Math.round(resx), Math.round(resy),1,1);
                    }
                    ctxbtm.clearRect(0,0, canvasbtm.width, canvasbtm.height);
                    ctxbtm.drawImage(tempcanvas,0,0);
                    tempctx.clearRect(0,0, tempcanvas.width, tempcanvas.height);

                    function drawDashedCircle(ctx, x, y, radius, dashArray) {
                        ctx.beginPath();
                        tempctx.strokeStyle = "rgba(50, 205, 50, 0.4)";
                        ctx.arc(x, y, radius, 0, 2 * Math.PI);
                        ctx.setLineDash(dashArray);
                        ctx.stroke();
                    }

                    //画实线
                    tempctx.strokeStyle = "rgba(169, 169, 169, 0.4)";
                    tempctx.lineWidth = 5;
                    const lineArray = [5, 0];
                    for(var m=0;m<strjson['advancedCurveList'].length;m++)
                    {
                        //最小值移动到0,0
                        var res_sx=strjson['advancedCurveList'][m]['startPos']['pos']['x']-xmin;
                        var res_sy=strjson['advancedCurveList'][m]['startPos']['pos']['y']-ymin;
                        var res_ex=strjson['advancedCurveList'][m]['endPos']['pos']['x']-xmin;
                        var res_ey=strjson['advancedCurveList'][m]['endPos']['pos']['y']-ymin;
						var ctl1_x,ctl1_y,ctl2_x,ctl2_y
						if(strjson['advancedCurveList'][m].hasOwnProperty('controlPos1') && strjson['advancedCurveList'][m]['controlPos1'].hasOwnProperty('x'))
						{
							ctl1_x=strjson['advancedCurveList'][m]['controlPos1']['x']-xmin;
							ctl1_y=strjson['advancedCurveList'][m]['controlPos1']['y']-ymin;
							ctl2_x=strjson['advancedCurveList'][m]['controlPos2']['x']-xmin;
							ctl2_y=strjson['advancedCurveList'][m]['controlPos2']['y']-ymin;
							res_sx=res_sx/resg;
							res_sy=res_sy/resg;
							res_sy=canvastop.height-res_sy;
							res_ex=res_ex/resg;
							res_ey=res_ey/resg;
							res_ey=canvastop.height-res_ey;
							ctl1_x=ctl1_x/resg;
							ctl1_y=ctl1_y/resg;
							ctl1_y=canvastop.height-ctl1_y;
							ctl2_x=ctl2_x/resg;
							ctl2_y=ctl2_y/resg;
							ctl2_y=canvastop.height-ctl2_y;
							// 开始绘制路径
							tempctx.beginPath();
							// 移动到起点
							tempctx.moveTo(Math.round(res_sx), Math.round(res_sy));
							// 画一条线到终点,第一第二个点是控制点,第三个点是终点
							tempctx.bezierCurveTo(Math.round(ctl1_x), Math.round(ctl1_y), Math.round(ctl2_x), Math.round(ctl2_y), Math.round(res_ex), Math.round(res_ey));
							tempctx.setLineDash(lineArray);
							// 绘制线条
							tempctx.stroke();
						}
						else
						{
							res_sx=res_sx/resg;
							res_sy=res_sy/resg;
							res_sy=canvastop.height-res_sy;
							res_ex=res_ex/resg;
							res_ey=res_ey/resg;
							res_ey=canvastop.height-res_ey;
							// 开始绘制路径
							tempctx.beginPath();
							// 移动到起点
							tempctx.moveTo(Math.round(res_sx), Math.round(res_sy));
							tempctx.lineTo(Math.round(res_ex), Math.round(res_ey));
							tempctx.setLineDash(lineArray);
							// 绘制线条
							tempctx.stroke();
						}

                    }

                    const radius = 25;
                    tempctx.lineWidth = 1;
                    const dashArray = [3, 2];
                    //画虚线圆,写字
                    var counter=10000;
                    for(var m=0;m<strjson['advancedPointList'].length;m++)
                    {
                        //最小值移动到0,0
                        var res_x=strjson['advancedPointList'][m]['pos']['x']-xmin;
                        var res_y=strjson['advancedPointList'][m]['pos']['y']-ymin;

                        res_x=res_x/resg;
                        res_y=res_y/resg;
                        res_y=canvastop.height-res_y;
                        tempctx.fillStyle="rgba(225, 255, 255, 0.4)";
                        drawDashedCircle(tempctx, Math.round(res_x), Math.round(res_y), radius, dashArray);
                        //tempctx.fillRect(Math.round(res_x)-30, Math.round(res_y)-12,60,24);
                        console.log("x+y:"+res_x+"/"+res_y);
                        //写字
                        // 设置字体样式
                        tempctx.font = '12px Arial';
                        // 设置字体颜色
                        tempctx.fillStyle = '#FF0000';
                        // 写字
                        counter=counter+m;
                        tempctx.fillText("AP"+String(counter), Math.round(res_x)-23, Math.round(res_y)+6);
                    }


                    ctxtop.clearRect(0,0, canvastop.width, canvastop.height);
                    ctxtop.drawImage(tempcanvas,0,0);
                    tempctx.clearRect(0,0, tempcanvas.width, tempcanvas.height);
                }
            }

        </script>
    </body>
</html>


 2039
2039


 被折叠的 条评论
为什么被折叠?
被折叠的 条评论
为什么被折叠?
 到【灌水乐园】发言


