


今天来简单分享下如何在GEE中利用哨兵1号数据进行水体动态监测
1.SAR数据介绍:
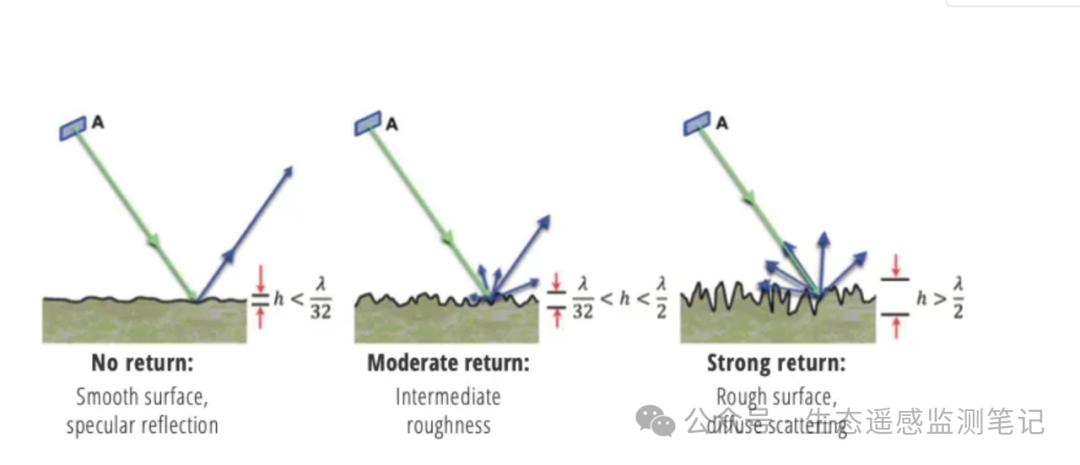
SAR 的工作原理是发射电磁脉冲并监听回波,这些回波被称为反向散射。反向散射的相位和振幅均被记录下来。
相位:反向散射的相位用于确定传感器与目标之间的距离。这是因为波的相位与其传播的距离有关。通过比较发射波的相位与接收波的相位,传感器可以计算出波传播的距离,从而计算出与目标之间的距离。
振幅:反向散射的振幅表示返回传感器的发射信号量。SAR 图像像素振幅的高数字 (DN) 表示强反向散射,而低 DN 表示弱反向散射。振幅测量提供有关目标粗糙度、几何形状、湿度和介电常数的信息。
2.Sentinel-1数据介绍:
Sentinel-1是一项卫星任务,它使用合成孔径雷达 (SAR) 来捕捉地球表面的图像。它工作在 C 波段,即电磁波谱微波部分内4 至 8 GHz 的标称频率范围。Sentinel-1 SAR 系统支持单极化(HH 或 VV)和双极化(HH+HV 或 VV+VH)操作,通过一个发射链(可切换到 H 或 V)和两个用于 H 和 V 极化的并行接收链实现。
VV(垂直-垂直):雷达信号垂直发射并垂直接收。这通常用于检测水体,因为水面提供强大的 VV 响应。它也常用于洪水测绘。
HH(水平-水平):雷达信号水平发射并水平接收。这通常用于检测人造结构,因为这些结构往往会提供强大的 HH 响应。它通常用于城市地区的建筑物检测。
VH(垂直-水平)和 HV(水平-垂直):这些是交叉极化。雷达信号以一种极化(垂直或水平)发射并以另一种极化接收。这些通常用于检测植被,因为植被冠层内的多次散射通常会导致强烈的交叉极化响应。
不同的极化组合提供了有关表面特征的不同且互补的信息。例如,线性定向结构(如建筑物或沙中的涟漪)往往会反射并保持极化信号的相干性(相同的线性方向)。随机定向结构(如树叶)会在信号多次反射时散射并使信号去极化
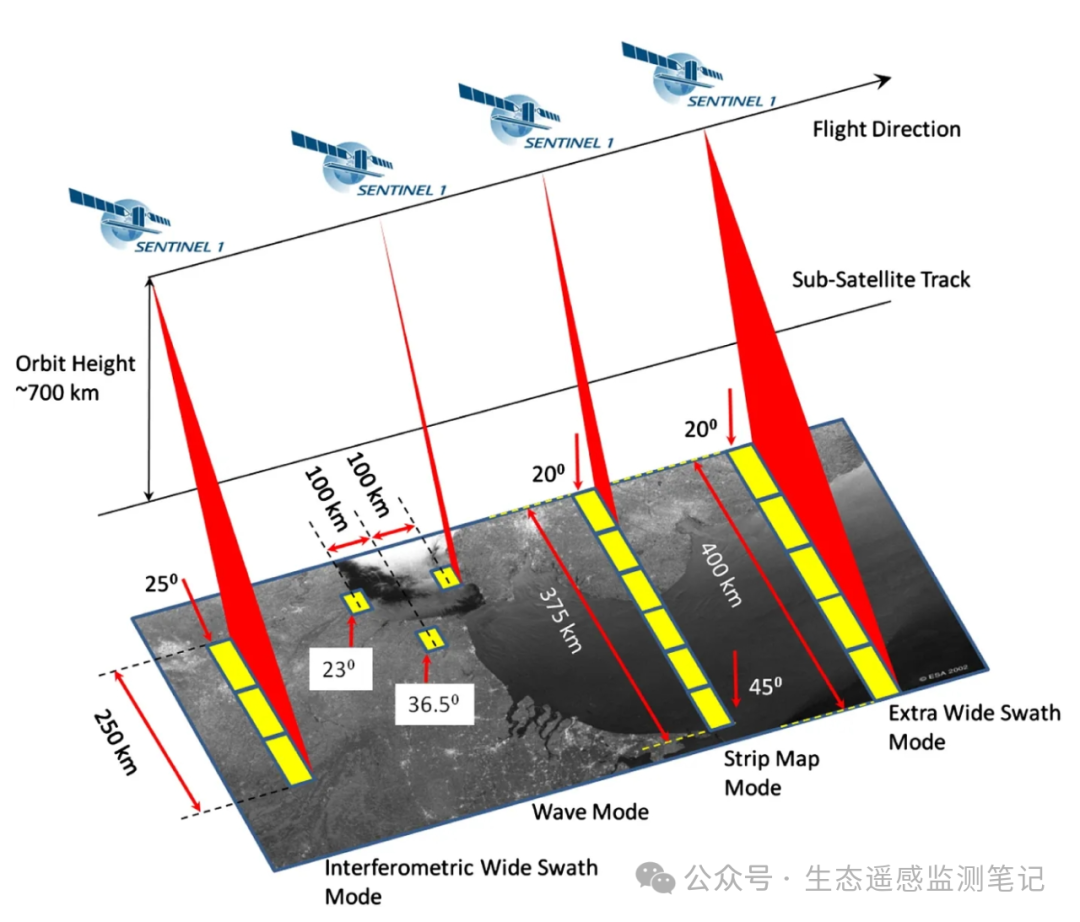
在 Sentinel-1 的背景下,主要的无冲突模式是干涉宽幅 (IW)扫描带,在陆地上采用 VV+VH 极化,以及波浪 (WV) 扫描带,在公海上采用 VV 极化。超宽幅 (EW) 扫描带模式主要用于广域沿海监测,包括船舶交通、漏油和海冰监测。
Sentinel-1 SAR数据的优势
全天候成像: Sentinel-1 可以在所有天气条件下(白天或夜晚)获取数据。这是因为它在不受云层或照明不足影响的波长下运行。
高分辨率:根据成像模式的不同,Sentinel-1 提供不同的分辨率(低至 5 米)和覆盖范围(高达 400 公里)。
变化检测: Sentinel-1可以检测地球表面随时间的变化,可用于监测环境变化、自然灾害和人类活动。
穿透深度:根据频率,SAR 信号可以穿透地面表层,从而可用于地质和考古应用。
多功能性: Sentinel-1数据可用于各种应用,包括环境监测、灾害管理、天气预报、军事和情报、保险业和海事当局。
干涉合成孔径雷达(InSAR):该技术利用两个合成孔径雷达图像之间的相位差来测量地球表面变形,可用于地质学、地震学和土木工程。
可靠、重复的广域监测: Sentinel-1 及其 C-SAR 仪器可以提供可靠、重复的广域监测。
重访时间短、产品交付快: Sentinel-1 的修订时间合理 - S1A 和 S1B 卫星的重复周期总和为 6 天,同时为地面测距产品提供每像素 20 米的高分辨率
2.GEE实现代码:
首先确定研究区和使用的数据集
我选择的研究区为小浪底水库的部分区域,使用的数据集为COPERNICUS/S1_GRD
目标是小浪底水库的部分区域水体的动态监测
以下是实现代码:
var s1 =  ee.ImageCollection('COPERNICUS/S1_GRD')
.filter(ee.Filter.listContains('transmitterReceiverPolarisation', 'VV'))
.filter(ee.Filter.eq('instrumentMode', 'IW'))
.filter(ee.Filter.eq('orbitProperties_pass', 'ASCENDING'))
.filterBounds(roi)
//.filterBounds(Map.getBounds(true))
.filterDate('2020-01-01','2020-12-31')
// Filter partial S1-Images of AOI
//.map(function(image){return image.clip(Map.getBounds(true))})
.map(function(image){return image.addBands(image.select('VV').focal_median(parseFloat('50'),'circle','meters').rename('VV_smoothed'))})// Smooth S1-Images
.map(function(image){
    return image.clip(roi)
  });
print(s1);


// 返回 S1 波段(区域内)类间方差最大的 DN。
var otsu = function(histogram) {
  var counts = ee.Array(ee.Dictionary(histogram).get('histogram'));
  var means = ee.Array(ee.Dictionary(histogram).get('bucketMeans'));
  var size = means.length().get([0]);
  var total = counts.reduce(ee.Reducer.sum(), [0]).get([0]);
  var sum = means.multiply(counts).reduce(ee.Reducer.sum(), [0]).get([0]);
  var mean = sum.divide(total);

  var indices = ee.List.sequence(1, size);

// 计算每个均值分割数据的平方和。
  var bss = indices.map(function(i) {
    var aCounts = counts.slice(0, 0, i);
    var aCount = aCounts.reduce(ee.Reducer.sum(), [0]).get([0]);
    var aMeans = means.slice(0, 0, i);
    var aMean = aMeans.multiply(aCounts)
        .reduce(ee.Reducer.sum(), [0]).get([0])
        .divide(aCount);
    var bCount = total.subtract(aCount);
    var bMean = sum.subtract(aCount.multiply(aMean)).divide(bCount);
    return aCount.multiply(aMean.subtract(mean).pow(2)).add(
           bCount.multiply(bMean.subtract(mean).pow(2)));
  });

// 返回与最大 BSS 对应的平均值。
  return means.sort(bss).get([-1]);
};


// 返回带水掩膜作为附加波段的图像
var add_waterMask = function(image){
  // Compute histogram
  var histogram = image.select('VV').reduceRegion({
    reducer: ee.Reducer.histogram(255, 2)
      .combine('mean', null, true)
      .combine('variance', null, true),
    geometry: roi,
    scale: 10,
    bestEffort: true
  });
  // 通过 otsu 计算阈值
  var threshold = otsu(histogram.get('VV_histogram'));

  // 获取 Watermask
  var waterMask = image.select('VV_smoothed').lt(threshold).rename('waterMask');
  waterMask = waterMask.updateMask(waterMask); //Remove all pixels equal to 0
  return image.addBands(waterMask);
};


s1 = s1.map(add_waterMask);


//计算出水量
var min_occurence = 10;
var water_sum = s1.select('waterMask').reduce(ee.Reducer.sum());
var water_frequency = water_sum.divide(s1.select('waterMask').size()).multiply(100);
var water_frequency_masked = water_frequency.updateMask(water_frequency.gt(min_occurence));


function makeLegend(lowLine, midLine, highLine,lowText, midText, highText, palette) {
  var  labelheader = ui.Label('调查期间出现的水量',{margin: '5px 17px', textAlign: 'center', stretch: 'horizontal', fontWeight: 'bold'});
  var labelLines = ui.Panel(
      [
        ui.Label(lowLine, {margin: '-4px 21px'}),
        ui.Label(midLine, {margin: '-4px 0px', textAlign: 'center', stretch: 'horizontal'}),
        ui.Label(highLine, {margin: '-4px 21px'})
],
      ui.Panel.Layout.flow('horizontal'));
      var labelPanel = ui.Panel(
      [
        ui.Label(lowText, {margin: '0px 14.5px'}),
        ui.Label(midText, {margin: '0px 0px', textAlign: 'center', stretch: 'horizontal'}),
        ui.Label(highText, {margin: '0px 1px'})
],
      ui.Panel.Layout.flow('horizontal'));
    return ui.Panel({
      widgets: [labelheader, ColorBar(palette), labelLines, labelPanel],
      style: {position:'bottom-left'}});
}
Map.add(makeLegend('|', '|', '|', "0 %", '50 %', '100%', ['orange','yellow','lightblue','darkblue']));
Map.addLayer(s1.median(),{bands: ['VV','VV','VV'],min: -20,max: 0,},'S1-image [median]');
Map.addLayer(water_frequency_masked,{min:min_occurence,max:100,palette:['orange','yellow','lightblue','darkblue']},'Percentage of annual water occurence');
Map.add(animation);
print(ui.Thumbnail({image: s1, params: timelapse}));
var ClassChart = ui.Chart.image.series({
  imageCollection: s1.select('waterMask'),
  region: roi,
  reducer: ee.Reducer.sum(),
  scale: 100,
})
  .setOptions({
      title: '确定的水掩模区域',
      vAxis: {'title': 'area'},
      lineWidth: 1.5,
      pointSize: 2
    });
ClassChart.style().set({
    position: 'bottom-right',
    width: '492px',
    height: '300px'
  });


Map.add(ClassChart);
//创建回调函数,在地图上添加与点击的图表数据点相对应的图像
ClassChart.onClick(function(xValue, yValue, seriesName) {
    if (!xValue) return;  // Auswahl zurücksetzen

    // Show the image for the clicked date.
    var equalDate = ee.Filter.equals('system:time_start', xValue);
    //Find image coresponding with clicked data and clip water classification to aoi
    var classification = ee.Image(s1.filter(equalDate).first()).clip(roi).select('waterMask');
    var SARimage = ee.Image(s1.filter(equalDate).first());
        var date_string = new Date(xValue).toLocaleString('de-DE', {dateStyle: 'full', timeStyle: 'short' });
    //Make map layer based on SAR image, reset the map layers, and add this new layer
    var S1Layer = ui.Map.Layer(SARimage, {
      bands: ['VV'],
      max: 0,
      min: -20
    },'S1-Image ['+ new Date(xValue).toLocaleString('de-DE')+']');
    Map.layers().reset([S1Layer]);
    var visParamsS1Layer = {
      min: 0,
      max: 1,
      palette: ['#FFFFFF','#0000FF']
    };

    //Add water classification on top of SAR image
    Map.addLayer(classification,visParamsS1Layer,'water mask ['+date_string+']');
});
}
结果显示:
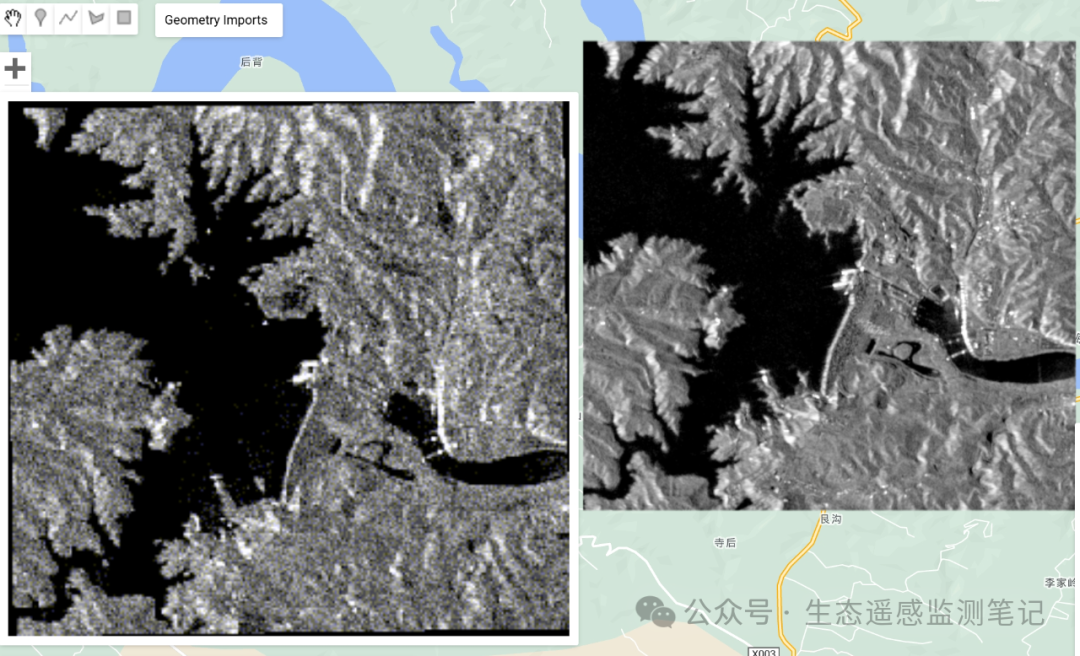
研究区S1_GRD显示
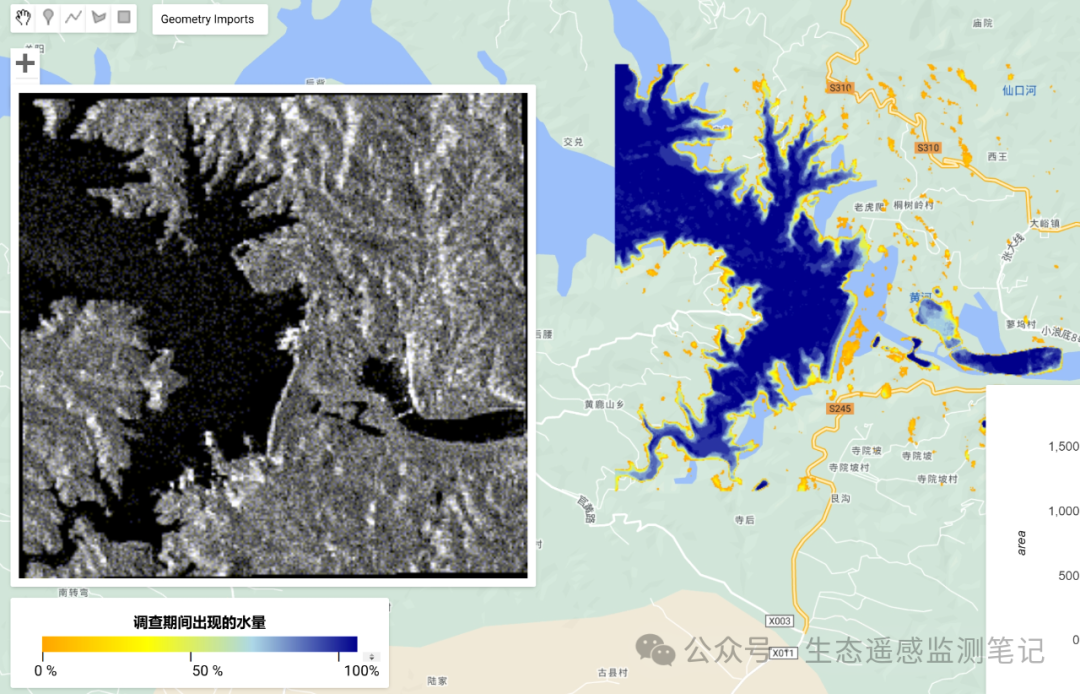
调查期间水量显示
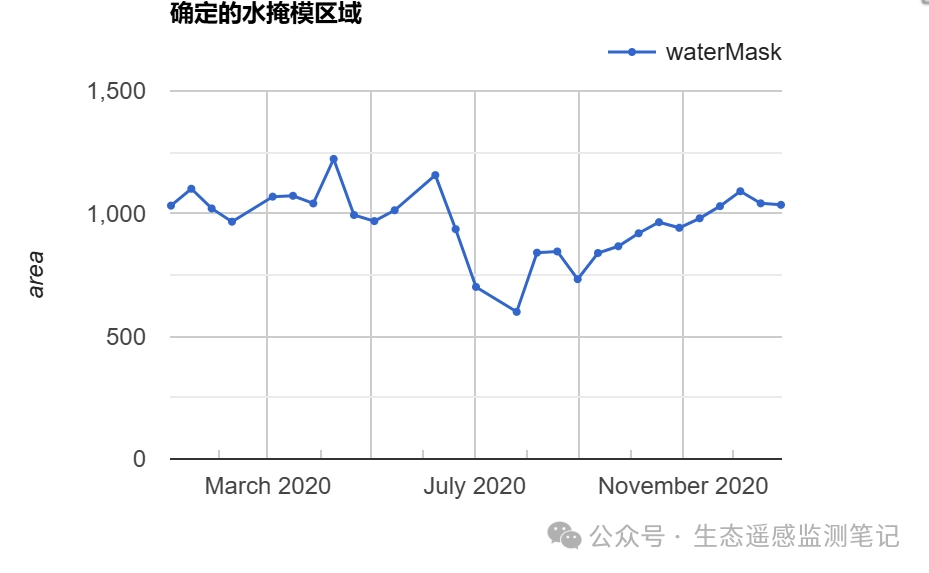
2020年研究区水体面积

水域动态监测
感谢关注,欢迎转发!
声明:仅供学习使用!
希望关注的朋友们转发,如果对你有帮助的话记得给小编点个赞或者在看!


 2412
2412

 被折叠的 条评论
为什么被折叠?
被折叠的 条评论
为什么被折叠?
 到【灌水乐园】发言


