


 本文介绍了如何将COCO数据集的关键点转换为H36M格式,并使用OpenCV进行2D关键点可视化,展示了如何处理关键点数据并生成带有标签的人体图像。
目录
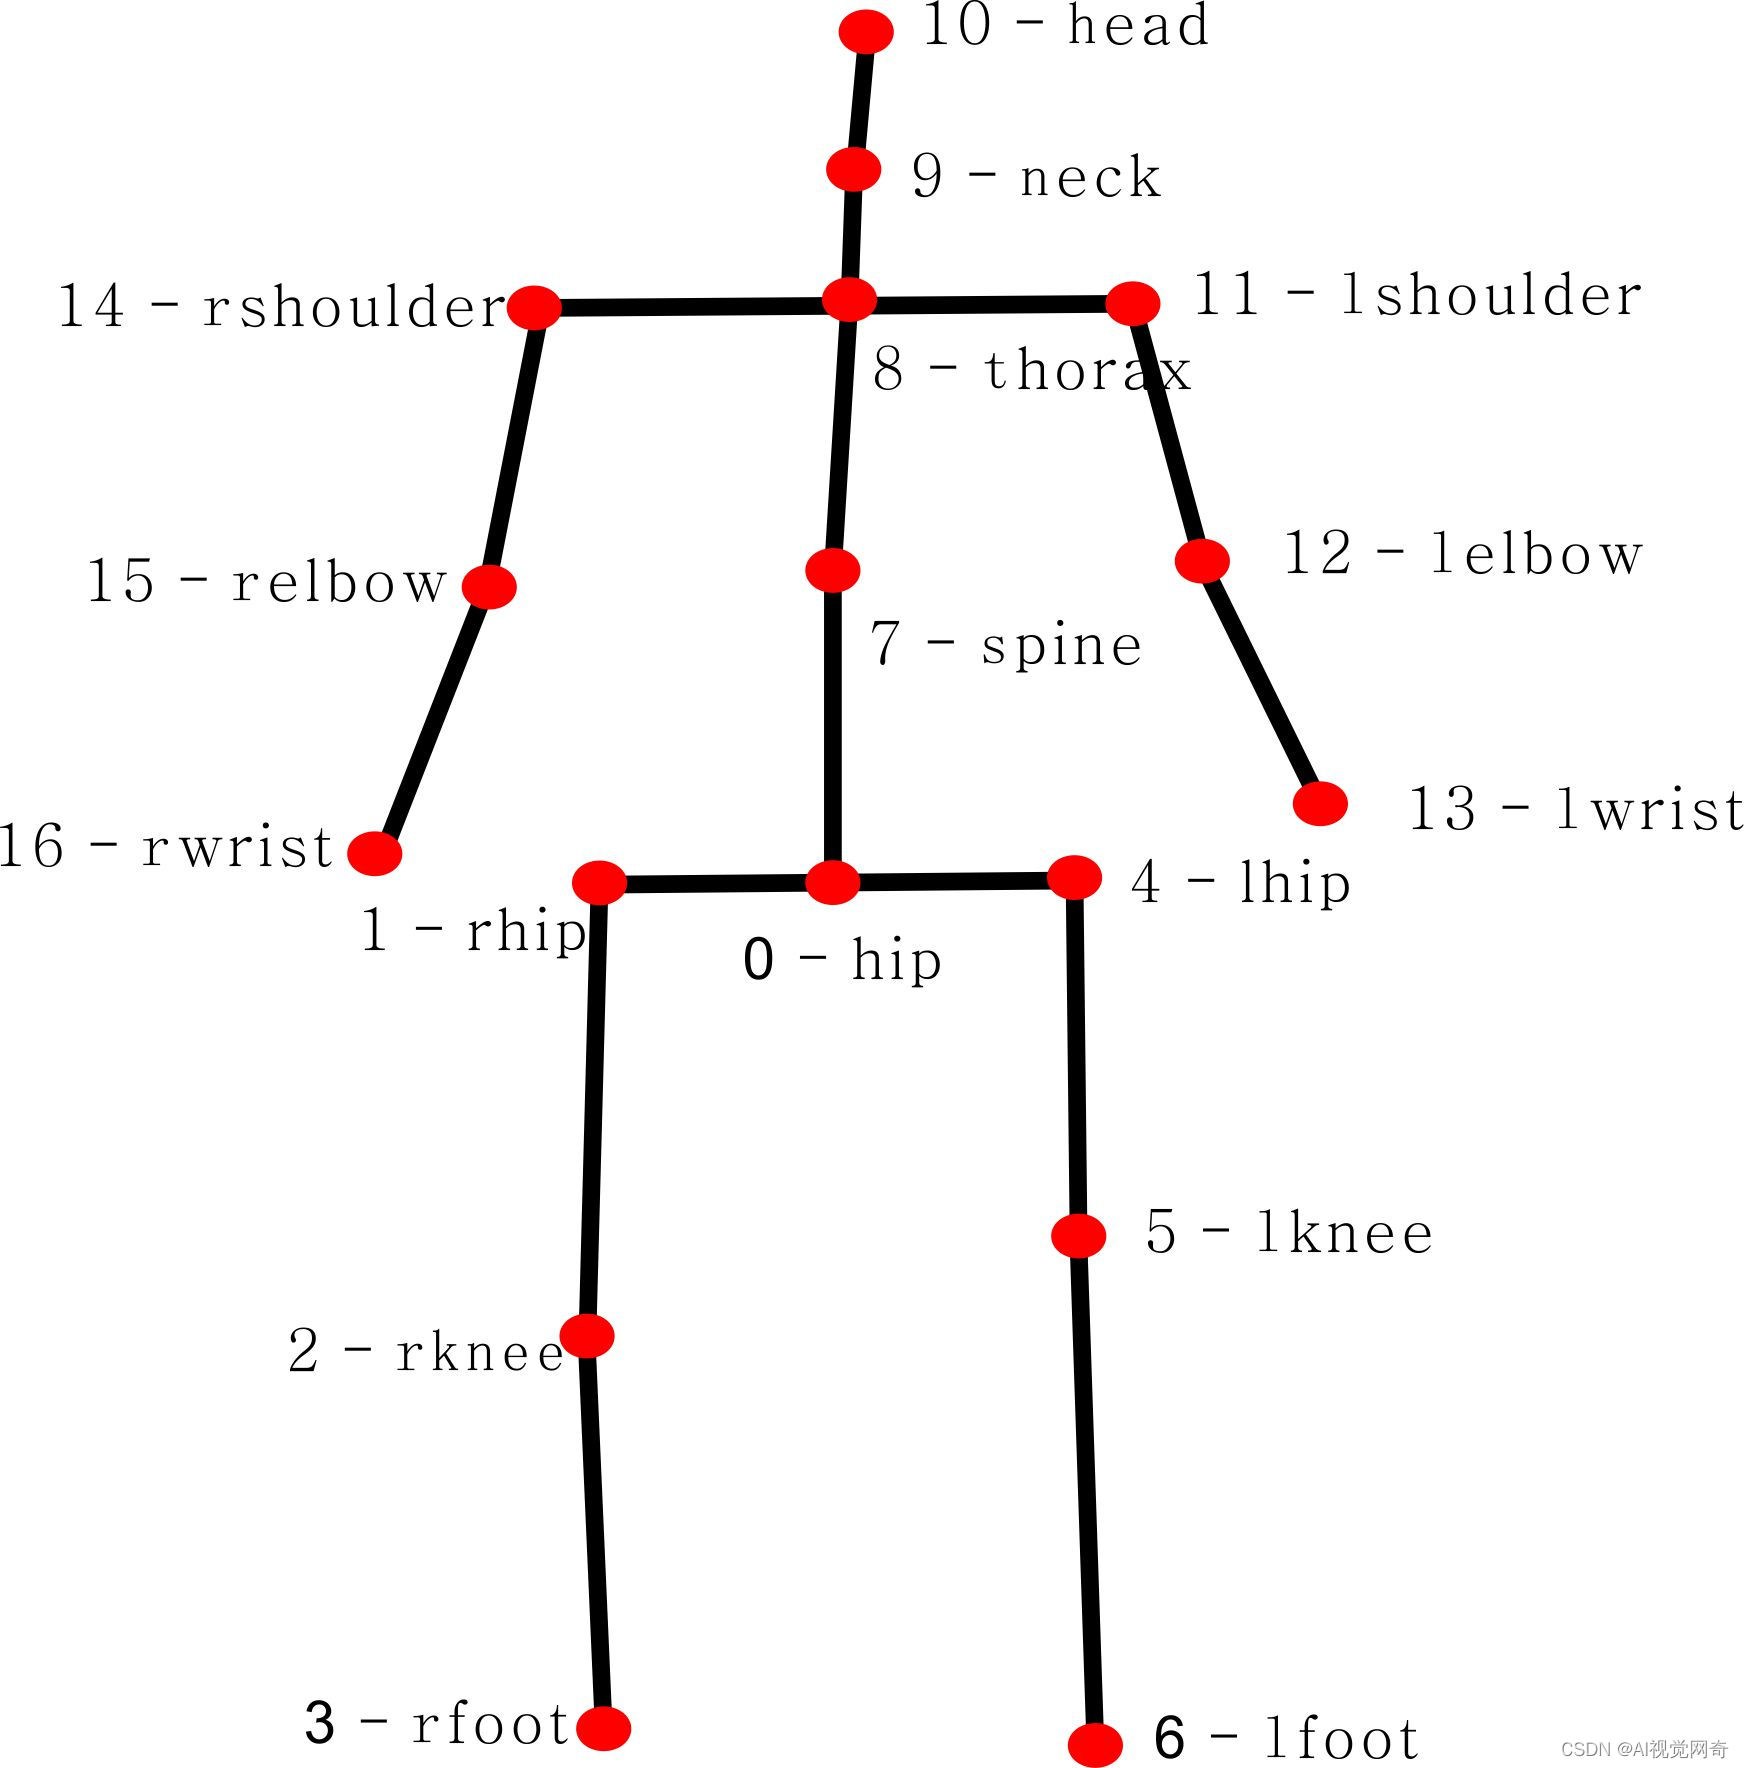
h36m人体关键点示意图:
| 序号 | 数据集标注顺序 | 关节名 | 中文名 |
|---|---|---|---|
| 0 | 0 | hip | 臀部 |
| 1 | 1 | rhip | 右臀部 |
| 2 | 2 | rknee | 右膝盖 |
| 3 | 3 | rfoot | 右脚踝 |
| 4 | 6 | lhip | 左臀部 |
| 5 | 7 | lknee | 左膝盖 |
| 6 | 8 | lfoot | 左脚踝 |
| 7 | 12 | spine | 脊柱 |
| 8 | 13 | thorax | 胸部 |
| 9 | 14 | neck | 颈部 |
| 10 | 15 | head | 头部 |
| 11 | 17 | lshoulder | 左肩 |
| 12 | 18 | lelbow | 左手肘 |
| 13 | 19 | lwrist | 左手腕 |
| 14 | 25 | rshoulder | 右肩 |
| 15 | 26 | relbow | 右手肘 |
| 16 | 27 | rwrist | 右手腕 |
human3.6m可视化
joint_name={
'Hips(髋部)': 0,
'RightUpLeg(右大腿)': 1,
'RightLeg(右小腿)': 2,
'RightFoot(右脚)': 3,
'LeftUpLeg(左大腿)': 4,
'LeftLeg(左小腿)': 5,
'LeftFoot(左脚)': 6,
'Spine(脊柱)': 7,
'Spine1(脊柱1)': 8,
'Neck(颈部)': 9,
'Neck1(颈部1)': 10,
'LeftArm(左臂)': 11,
'LeftForeArm(左前臂)': 12,
'LeftHand(左手)': 13,
'RightArm(右臂)': 14,
'RightForeArm(右前臂)': 15,
'RightHand(右手)': 16
}
https://github.com/gauraviiita/Visualization-of-Human3.6M-Dataset/
coco转h36m人体关键点
mhformer中有
def h36m_coco_format(keypoints, scores):
    assert len(keypoints.shape) == 4 and len(scores.shape) == 3

    h36m_kpts = []
    h36m_scores = []
    valid_frames = []

    for i in range(keypoints.shape[0]):
        kpts = keypoints[i]
        score = scores[i]

        new_score = np.zeros_like(score, dtype=np.float32)

        if np.sum(kpts) != 0.:
            kpts, valid_frame = coco_h36m(kpts)
            h36m_kpts.append(kpts)
            valid_frames.append(valid_frame)

            new_score[:, h36m_coco_order] = score[:, coco_order]
            new_score[:, 0] = np.mean(score[:, [11, 12]], axis=1, dtype=np.float32)
            new_score[:, 8] = np.mean(score[:, [5, 6]], axis=1, dtype=np.float32)
            new_score[:, 7] = np.mean(new_score[:, [0, 8]], axis=1, dtype=np.float32)
            new_score[:, 10] = np.mean(score[:, [1, 2, 3, 4]], axis=1, dtype=np.float32)

            h36m_scores.append(new_score)

    h36m_kpts = np.asarray(h36m_kpts, dtype=np.float32)
    h36m_scores = np.asarray(h36m_scores, dtype=np.float32)

    return h36m_kpts, h36m_scores, valid_frames
opencv 2d关键点可视化
import numpy as np


import cv2
import numpy as np
import json


kpt_color_map = {'h': {'id': 0, 'color': [255, 0, 0], 'radius': 3, 'thickness': -1}, 'tail': {'id': 1, 'color': [0, 255, 0], 'radius': 2, 'thickness': -1}}

# 点类别文字
kpt_labelstr = {'font_size': 1,  # 字体大小
    'font_thickness': 3,  # 字体粗细
    'offset_x': 20,  # X 方向,文字偏移距离,向右为正
    'offset_y': 10,  # Y 方向,文字偏移距离,向下为正
}

labelme_path = r'E:\data\new_path\635_5225_02-1\input\0000.json'
with open(labelme_path, 'r', encoding='utf-8') as f:
    labelme = json.load(f)

img_bgr=cv2.imread(r'E:\data\new_path\635_5225_02-1\input\0000.png')

for each_ann in labelme['shapes']:  # 遍历每一个标注


    kpt_label = each_ann['label']  # 该点的类别

    for point in each_ann['points']:
        kpt_xy = point
        kpt_x, kpt_y = int(kpt_xy[0]), int(kpt_xy[1])

        # 该点的可视化配置
        kpt_color = kpt_color_map[kpt_label]['color']  # 颜色
        kpt_radius = kpt_color_map[kpt_label]['radius']  # 半径
        kpt_thickness = kpt_color_map[kpt_label]['thickness']  # 线宽(-1代表填充)

        # 画圆:画该关键点
        img_bgr = cv2.circle(img_bgr, (kpt_x, kpt_y), kpt_radius, kpt_color, kpt_thickness)

        # 写该点类别文字:图片,文字字符串,文字左上角坐标,字体,字体大小,颜色,字体粗细
        img_bgr = cv2.putText(img_bgr, kpt_label, (kpt_x + kpt_labelstr['offset_x'], kpt_y + kpt_labelstr['offset_y']), cv2.FONT_HERSHEY_SIMPLEX, kpt_labelstr['font_size'], kpt_color, kpt_labelstr['font_thickness'])

cv2.imshow('img',img_bgr)
cv2.waitKey(0)


 1万+
1万+


 被折叠的 条评论
为什么被折叠?
被折叠的 条评论
为什么被折叠?
 到【灌水乐园】发言


