


数据源:akshare
策略:双均线策略购买股票,卖出50指数期货对冲
导包:
#导包
import akshare as ak
import pandas as pd
import numpy as np
import matplotlib
import matplotlib.pyplot as plt
import numpy as np
import matplotlib.pyplot as plot
import datetime
import talib    #计算均线的库,随便学一下,几分钟就懂
matplotlib.rcParams['axes.unicode_minus']=False  #调整图像,可以注释掉,一般还是可以运行
plt.rcParams['font.sans-serif']=['SimHei'] #用来正常显示中文标签
plt.rcParams['axes.unicode_minus']=False #用来正常显示负号
获取50成分股票:
#股票列表
import akshare as ak
index_stock_info_df = ak.index_stock_cons('000016')
根据每个股票数据构建策略,并计算策略收益率:
star='20170117'
end="20230810"
last = pd.DataFrame()
last['trade_date'] = 0
last['strategy'] = 0
for i in stock_list:
    #print(i)
    try:
        df = ak.stock_zh_a_hist(symbol=i, period="daily", start_date=star, end_date=end, adjust="")
        df.rename(columns={"日期":'trade_date',"开盘":'open',"收盘":'close',"最高":'high',"最低":'low',"涨跌幅":'change'},inplace = True)
        df = df.sort_index()   #建立索引
        df['ma10'] = df['close'].rolling(5).mean()
        df['ma20'] = df['close'].rolling(10).mean()
        #计算股票收益,有两种计算收益率方法:1.离散收益率  2.连续收益率
        df['position'] = np.where(df['ma10'] > df['ma20'], 1, 0)  #当20日均线大于60日均线时记录1,反之记录-1
        df['returns'] = df['close']/df['close'].shift(1)-1  #连续收益率计算
        #data['returns_dis'] = data['close']/data['close'].shift(1) - 1  #离散收益率计算
        df['strategy'] = df['position'].shift(1)*df['returns']
        df['trade_date']=pd.to_datetime(df.trade_date,format="%Y-%m-%d")
        #print(df.head())
        #df['code'] = i
        #下面需将得到的收益ret序列变成按日期由低到高排列
        #cum=df['strategy']+cum#等权重配置一篮子股票,计算权重和
        last = pd.merge(df[['trade_date','strategy']],last,on='trade_date',how= 'left')
        #last = last.set_index('trade_date')
        #print(cum)
        #print(last)
    except:
        continue
#(cum/len(stock_list)).cumsum().apply(np.exp).plot(figsize=(10, 6))
last = last.set_index('trade_date')
last = last.fillna(0)
last['Row_sum'] = last.apply(lambda x: x.sum(), axis=1)/len(stock_list)
last = last.reset_index()
last
获取期货数据,并计算收益:
#获取股指期货数据
df3 = ak.futures_main_sina(symbol="IF0")
df3.rename(columns={"日期":'trade_date',"开盘价":'open',"收盘价":'close',"最高价":'high',"最低价":'low'},inplace = True)
df3.sort_index()
#df3.index=pd.to_datetime(df3.trade_date,format="%Y-%m-%d")
df3 = df3[(df3['trade_date']>=datetime.date(2017,1,17))&(df3['trade_date']<=datetime.date(2023,8,13))]
df3['returns'] = df3['close']/df3['close'].shift(1)-1  #连续收益率计算
#data['returns_dis'] = data['close']/data['close'].shift(1) - 1  #离散收益率计算
df3['returns'].cumsum()
df3.trade_date=pd.to_datetime(df3.trade_date,format="%Y-%m-%d")
df3
计算组合收益:
la = pd.merge(last,df3,on='trade_date')
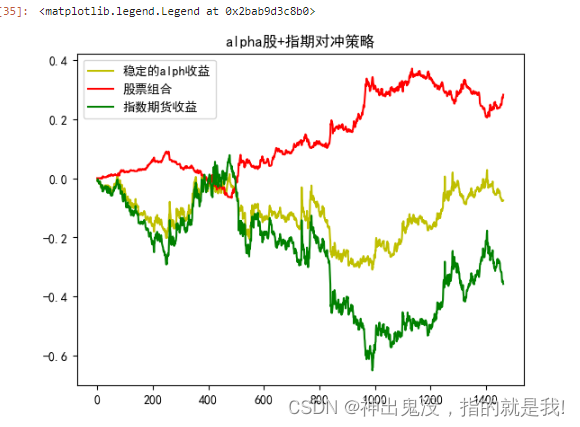
plt.plot(la.Row_sum.cumsum()-la.returns.cumsum(),label="稳定的alph收益",color="y")
plt.plot(la.Row_sum.cumsum(),label="股票组合",color='r')
plt.plot(-la.returns.cumsum(),label="指数期货收益",color='g')
plt.title("alpha股+指期对冲策略")
plt.legend()结果图:


 9691
9691


 被折叠的 条评论
为什么被折叠?
被折叠的 条评论
为什么被折叠?
 到【灌水乐园】发言


