


很多时候我们可以直接进行影像图表的加载,但是如何获取不同天数,或者给了指定的时间节点,如何获取这个指定时间范围内的月或者日的结果,从而正确的加载影像波段值的图表。我们需要了解几个函数:
difference(start, unit)
Returns the difference between two Dates in the specified units; the result is floating-point and based on the average length of the unit.
返回两个Date在指定单位中的差值;结果是浮点的,基于单位的平均长度。
Arguments:
this:date (Date)
start (Date)
unit (String):
One of 'year', 'month' 'week', 'day', 'hour', 'minute', or 'second'.
Returns: Float
advance(delta, unit, timeZone)//这个是进行日期的设定,按照年月日等格式
Create a new Date by adding the specified units to the given Date.
通过向给定的日期添加指定的单位来创建一个新的日期。
Arguments:
this:date (Date)
delta (Float)
unit (String):
One of 'year', 'month' 'week', 'day', 'hour', 'minute', or 'second'.
timeZone (String, default: null):
The time zone (e.g. 'America/Los_Angeles'); defaults to UTC.
Returns: Date
ui.Chart.image.series(imageCollection, region, reducer, scale, xProperty)
Generates a Chart from an ImageCollection. Plots derived values of each band in a region across images. Usually a time series.
-
X-axis: Image, labeled by xProperty value.
-
Y-axis: Band value.
-
Series: Band names.
Returns a chart.
Arguments:
imageCollection (ImageCollection):
An ImageCollection with data to be included in the chart.
region (Feature|FeatureCollection|Geometry):
The region to reduce.
reducer (Reducer, optional):
Reducer that generates the values for the y-axis. Must return a single value. Defaults to ee.Reducer.mean().
scale (Number, optional):
Scale to use with the reducer in meters.
xProperty (String, optional):
Property to be used as the label for each image on the x-axis. Defaults to 'system:time_start'.
Returns: ui.Chart
代码:
var startDate = ee.Date('2022-01-01'); // set start time for analysis
var endDate = ee.Date('2022-12-31'); // set end time for analysis
var nDays = ee.Number(endDate.difference(startDate,'day')).round();
// coordinate Arpat Ponte alle Mosse
//var point = ee.Geometry.Point([11.230520538799576, 43.78480193916678]);
// Signa 11.097849 43.793234
//https://www.arpat.toscana.it/temi-ambientali/aria/qualita-aria/rete_monitoraggio/scheda_stazione/FI-SIGNA
var point = ee.Geometry.Point([11.097849, 43.793234]);
Map.setCenter(11.097849, 43.793234,14);
var chirps = ee.ImageCollection('COPERNICUS/S5P/NRTI/L3_O3')
.select('O3_column_number_density')
.filterBounds(point)
.filterDate(startDate, endDate)
.map(function(image){return image.clip(point)}) ;
//这个关键地方,,是需要我们建立一个时序,然后获取每一天的值,这里最主要的时间函数的运用,以及影像系统时间的设定
var byday = ee.ImageCollection(
// map over each day
ee.List.sequence(0,nDays).map(function (n) {
var ini = startDate.advance(n,'day');
// advance just one day
var end = ini.advance(1,'day');
return chirps.filterDate(ini,end)
.select(0).mean()
.set('system:time_start', ini);
}));
// plot full time series
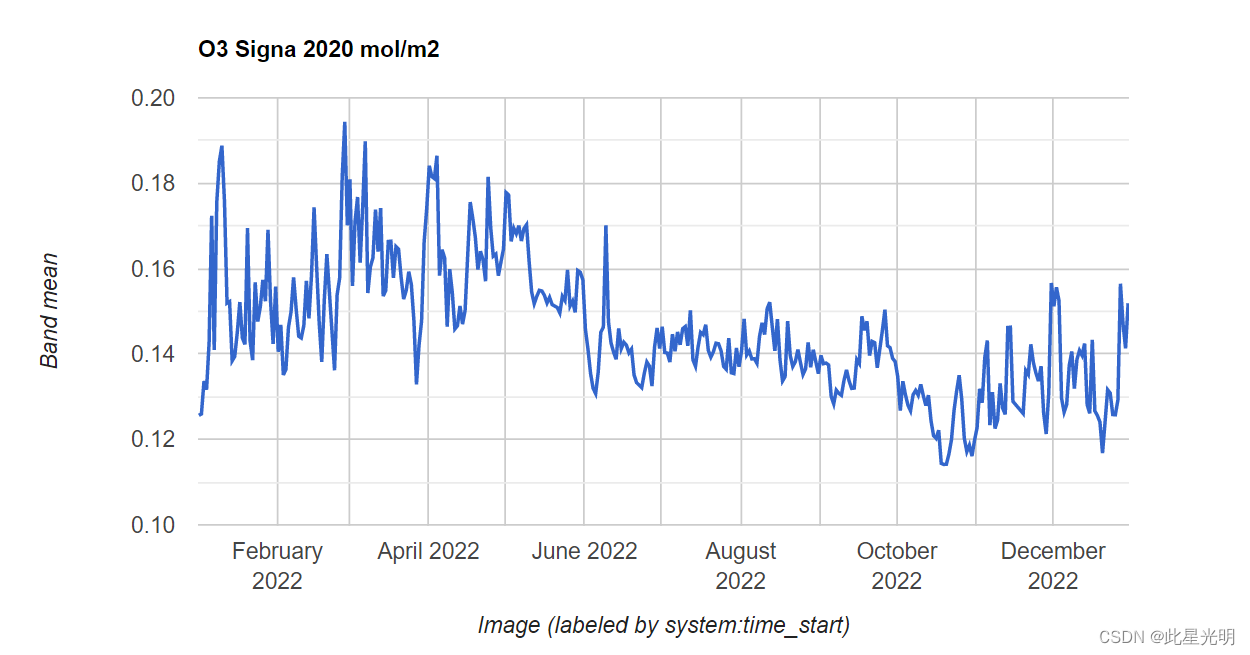
print(
ui.Chart.image.series({
imageCollection: byday,
region: point,
scale: 1
}).setOptions({title: 'O3 Signa 2020 mol/m2'})
);
Export.table.toDrive({
collection: chirps,
description: 'O3',
fileNamePrefix: 'O3',
fileFormat: 'CSV'
});


 1354
1354

 被折叠的 条评论
为什么被折叠?
被折叠的 条评论
为什么被折叠?
 到【灌水乐园】发言


