


简介
ABoVE: Atmospheric Profiles of CO, CO2 and CH4 Concentrations from Arctic-CAP, 2017
文件修订日期:2019-05-01
数据集版本: 1
数据集摘要
本数据集提供了 2017 年 4 月至 11 月北极碳飞机剖面(Arctic-CAP)月度采样活动期间阿拉斯加和加拿大育空及西北地区上空大气一氧化碳 (CO)、二氧化碳 (CO2)、甲烷 (CH4) 和水蒸气浓度的原位机载测量值,以及气温、气压、相对湿度和风速值。观测数据以 10 秒为间隔取平均值,并报告样本数(N)和标准偏差。在这六次月度活动中的每一次活动中,飞越北极-北方脆弱性实验(ABoVE)区域的飞行都包括从地表到 6 千米高度的 25 个垂直剖面,所选位置是对常规长期垂直剖面、遥感数据和地面通量塔测量结果的补充。
这些数据是为北极-CAP 项目收集的,以捕捉北部高纬度碳循环的时空动态,作为 ABoVE 的一部分。
该数据集有一个 NetCDF (.nc) 格式的数据文件。
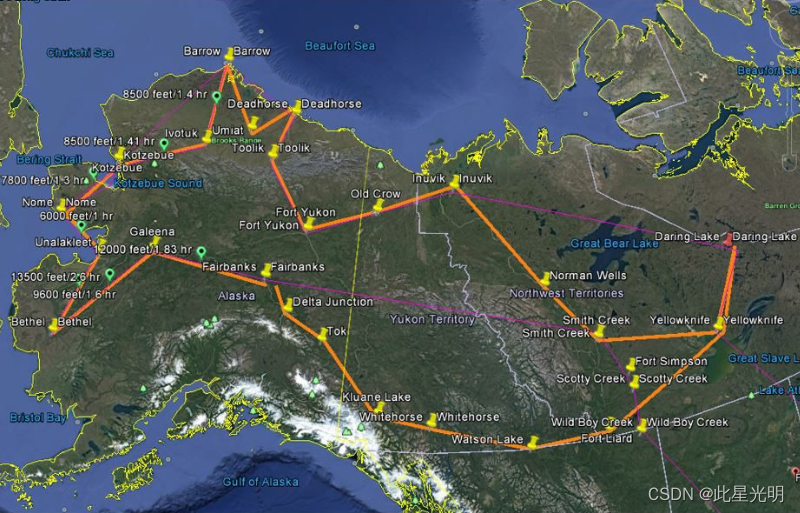
Arctic-CAP 飞行线路(橙色)对阿拉斯加的北极和北方地区以及加拿大的育空地区和西北地区进行了采样。月度活动从 4 月持续到 11 月,捕捉了 2017 年生长季节的碳动态。图钉标出了每个月活动期间获取的 25 个垂直剖面的位置。
作为 ABoVE 的一部分,收集这些数据是为了捕捉北部高纬度碳循环的时空动态。
项目:北极-北方脆弱性实验
北极-北方脆弱性实验(ABoVE)是美国国家航空航天局(NASA)陆地生态计划的一项野外活动,于 2016 年至 2021 年期间在阿拉斯加和加拿大西部进行。ABoVE 的研究将基于实地的过程级研究与机载和卫星传感器获得的地理空间数据产品联系起来,为提高分析和建模能力奠定了基础,而分析和建模能力是了解和预测生态系统反应及社会影响所必需的。
空间覆盖范围: 阿拉斯加和加拿大
上图 参考地点:
域:核心和扩展
州/地区: 加拿大阿拉斯加州、育空地区和西北地区阿拉斯加和加拿大育空及西北地区
网格单元:Ah000v000, Ah000v001, Ah001v001, Ah002v001
空间分辨率: 点位置。飞机速度为 170 海里/秒(87.5 米/秒)时,一个 10 秒平均间隔覆盖约 875 米的距离。
| Site | Westernmost Longitude | Easternmost Longitude | Northernmost Latitude | Southernmost Latitude |
|---|---|---|---|---|
| Alaska and Canada | -166.04539 | -104.1124 | 71.287399 | 40.0387 |
数据文件信息
该数据集有一个 NetCDF (.nc) 格式的数据文件。
对于每个变量,在 2017-04-26 至 2017-11-05 期间的 55 次单独飞行中收集了 107 400 个观测值(10 秒平均值)。
表 1. 列出 55 次独特飞行及其各自活动和起止地点的汇总表。Flight_ID 格式为飞行开始的日期(YYYYMMDD)。请注意,开始和结束地点并不一定表示当天的完整飞行路径。
| Campaign | Flight ID | lat_start | lon_start | Start_loc | lat_end | lon_end | End_loc |
|---|---|---|---|---|---|---|---|
| Transit flight | 20170426 | 40.0391 | -105.2322 | Colorado | 62.4684 | -114.4433 | Yellowknife |
| April-May | 20170427 | 62.4702 | -114.4493 | Yellowknife | 62.469 | -114.4441 | Yellowknife |
| 20170428 | 62.4707 | -114.4517 | Yellowknife | 68.3039 | -133.4776 | Inuvik | |
| 20170429 | 68.3033 | -133.5016 | Inuvik | 64.8053 | -147.8663 | Fairbanks | |
| 20170430 | 64.805 | -147.8816 | Fairbanks | 64.5093 | -165.3624 | Nome | |
| 20170501 | 64.5078 | -165.4506 | Nome | 64.8219 | -147.8505 | Fairbanks | |
| 20170503 | 64.8044 | -147.8827 | Fairbanks | 60.7129 | -135.0704 | Whitehorse | |
| 20170504 | 60.7172 | -135.0731 | Whitehorse | 62.4704 | -114.4502 | Yellowknife | |
| June | 20170606 | 62.4657 | -114.4295 | Yellowknife | 68.3039 | -133.4776 | Inuvik |
| 20170607 | 68.3033 | -133.5 | Inuvik | 64.806 | -147.8651 | Fairbanks | |
| 20170608 | 64.8032 | -147.8849 | Fairbanks | 64.5114 | -165.443 | Nome | |
| 20170609 | 64.5083 | -165.4497 | Nome | 64.8051 | -147.8667 | Fairbanks | |
| 20170613 | 64.8131 | -147.8667 | Fairbanks | 64.8064 | -147.8643 | Fairbanks | |
| 20170614 | 64.8135 | -147.866 | Fairbanks | 60.5655 | -151.2556 | Anchorage | |
| 20170618 | 59.6415 | -151.4882 | Anchorage | 60.7152 | -135.0678 | Whitehorse | |
| 20170619 | 60.7121 | -135.0692 | Whitehorse | 62.4681 | -114.4402 | Yellowknife | |
| July | 20170709 | 62.4708 | -114.4522 | Yellowknife | 62.4697 | -114.4434 | Yellowknife |
| 20170710 | 62.4704 | -114.4504 | Yellowknife | 68.3035 | -133.4927 | Inuvik | |
| 20170712 | 68.3033 | -133.4994 | Inuvik | 64.8215 | -147.8513 | Fairbanks | |
| 20170713 | 64.8035 | -147.8843 | Fairbanks | 64.5127 | -165.4405 | Nome | |
| 20170714 | 64.508 | -165.4503 | Nome | 64.8096 | -147.8584 | Fairbanks | |
| 20170717 | 64.8135 | -147.866 | Fairbanks | 64.811 | -147.8705 | Fairbanks | |
| 20170718 | 64.8266 | -147.8419 | Fairbanks | 64.8205 | -147.8531 | Fairbanks | |
| 20170719 | 64.2617 | -146.0123 | Fairbanks | 60.7157 | -135.0721 | Whitehorse | |
| 20170721 | 60.7175 | -135.0734 | Whitehorse | 62.4701 | -114.4435 | Yellowknife | |
| August | 20170817 | 56.6532 | -111.2097 | Fort McMurray | 68.3038 | -133.4824 | Inuvik |
| 20170818 | 68.3034 | -133.4991 | Inuvik | 64.8203 | -147.8535 | Fairbanks | |
| 20170821 | 64.8134 | -147.8662 | Fairbanks | 64.8082 | -147.8609 | Fairbanks | |
| 20170823 | 64.826 | -147.8429 | Fairbanks | 64.5106 | -165.444 | Nome | |
| 20170824 | 64.7501 | -164.3066 | Quartz Creek | 65.4121 | -164.6727 | Quartz Creek | |
| 20170826 | 64.5178 | -165.43 | Nome | 64.5125 | -165.441 | Nome | |
| 20170827 | 64.5085 | -165.4491 | Nome | 64.8219 | -147.8504 | Fairbanks | |
| 20170828 | 64.8121 | -147.8686 | Fairbanks | 60.7146 | -135.0712 | Whitehorse | |
| 20170829 | 60.7179 | -135.0737 | Whitehorse | 62.4699 | -114.4435 | Yellowknife | |
| 20170830 | 62.4702 | -114.4493 | Yellowknife | 62.4691 | -114.4448 | Yellowknife | |
| September | 20170908 | 62.4656 | -114.4292 | Yellowknife | 60.7135 | -135.0665 | Whitehorse |
| 20170910 | 60.7186 | -135.0742 | Whitehorse | 60.9571 | -137.4537 | Whitehorse | |
| 20170913 | 60.7178 | -135.0737 | Whitehorse | 64.8206 | -147.8529 | Fairbanks | |
| 20170915 | 64.8128 | -147.8672 | Fairbanks | 70.1957 | -148.4543 | Deadhorse | |
| 20170917 | 64.8137 | -147.8656 | Fairbanks | 64.5112 | -165.4482 | Nome | |
| 20170918 | 64.5094 | -165.4366 | Nome | 64.8093 | -147.859 | Fairbanks | |
| 20170921 | 64.8131 | -147.8667 | Fairbanks | 64.8091 | -147.8593 | Fairbanks | |
| 20170924 | 64.8134 | -147.8661 | Fairbanks | 64.8112 | -147.8702 | Fairbanks | |
| 20170927 | 64.8124 | -147.868 | Fairbanks | 62.4685 | -114.4421 | Yellowknife | |
| 20170928 | 62.471 | -114.4527 | Yellowknife | 55.1845 | -118.8811 | Grand Prairie | |
| October-November | 20171018 | 56.6532 | -111.2067 | Fort McMurray | 62.4604 | -114.442 | Yellowknife |
| 20171021 | 62.4658 | -114.4297 | Yellowknife | 68.3036 | -133.4895 | Inuvik | |
| 20171022 | 68.3042 | -133.4667 | Inuvik | 64.8215 | -147.8512 | Fairbanks | |
| 20171023 | 64.8126 | -147.8676 | Fairbanks | 64.8077 | -147.8766 | Fairbanks | |
| 20171025 | 64.8039 | -147.8836 | Fairbanks | 64.8091 | -147.874 | Fairbanks | |
| 20171031 | 64.8036 | -147.8842 | Fairbanks | 64.8082 | -147.8757 | Fairbanks | |
| 20171101 | 64.8264 | -147.8423 | Fairbanks | 64.8099 | -147.8726 | Fairbanks | |
| 20171102 | 64.8041 | -147.8832 | Fairbanks | 60.7151 | -135.0716 | Whitehorse | |
| 20171104 | 60.7029 | -135.0622 | Whitehorse | 55.1845 | -118.8797 | Grand Prairie | |
| Transit flight | 20171105 | 55.1845 | -118.874 | Grand Prairie | 40.209 | -104.9237 | Colorado |
数据文件变量
| Variable | Units/format | Description |
|---|---|---|
| altitude | m.a.s.l. | Sample altitude (GPS altitude) in meters above sea level |
| flight_id | YYYYMMDD | A unique number identifying each flight. The format is the date in YYYYMMDD on which the flight began. See Table 1. |
| CH4 | nmol per mol | Mole fraction of methane in dry air. Average of all measurements made in the time interval. Mole fraction reported in units of nanomole per mol (1e-9 mol per mol of dry air); equivalent to ppb (parts per billion). Fill value: -9999 |
| CH4_nvalue | Number of individual measurements used to compute reported value. Fill value: -9 | |
| CH4_stdv | nmol per mol | Standard deviation of all measurements made in the time interval. A value of 0 occurs when nvalue is equal to 1. The mole fraction reported in units of nanomole per mol (1e-9 mol per mol of dry air). Fill value: -9999 |
| CH4_unc | nmol per mol | Estimated uncertainty of the reported value. May be a single average uncertainty value for the whole dataset. The mole fraction reported in units of nanomole per mol (1e-9 mol per mol of dry air). Fill value: -9999 |
| CO2 | umol per mol | Mole fraction of carbon dioxide in dry air; average of all measurements made in the time interval. Mole fraction reported in units of micromole per mole (1e-6 mol per mol of dry air); equivalent to ppm (parts per million). Fill value: -9999 |
| CO2_nvalue | Number of individual measurements used to compute reported value. Fill value: -9 | |
| CO2_stdv | umol per mol | Standard deviation of all measurements made in the time interval. A value of 0 occurs when nvalue is equal to 1. The mole fraction reported in units of micromole per mole (1e-6 mol per mol of dry air); equivalent to ppm (parts per million). Fill value: -9999 |
| CO2_unc | umol per mol | Estimated uncertainty of the reported value. May be a single average uncertainty value for the whole dataset. The mole fraction reported in units of micromole per mole (1e-6 mol per mol of dry air); equivalent to ppm (parts per million).Fill value: -9999 |
| CO | nmol per mol | Mole fraction of carbon monoxide in dry air; average of all measurements made in the time interval. Mole fraction reported in units of nanomole per mol (1e-9 mol per mol of dry air); equivalent to ppb (parts per billion). |
| CO_nvalue | Number of individual measurements used to compute reported value. Fill value: -9 | |
| CO_stdv | nmol per mol | Standard deviation of all measurements made in the time interval. A value of 0 occurs when nvalue is equal to 1. The mole fraction reported in units of nanomole per mol (1e-9 mol per mol of dry air). Fill value: -9999 |
| CO_unc | nmol per mol | Estimated uncertainty of the reported value. May be a single average uncertainty value for the whole dataset. The mole fraction reported in units of nanomole per mol (1e-9 mol per mol of dry air). Fill value: -9999 |
| H2O | % | Water vapor; Average of all measurements made in the time interval. Fill value: -9999 |
| H20_nvalue | Number of individual measurements used to compute reported value. Fill value: -9 | |
| H20_stdv | % | Standard deviation of all measurements made in the time interval. A value of 0 occurs when nvalue is equal to 1. Fill value: -9999 |
| H2O_unc | % | Estimated uncertainty of the reported value. May be a single average uncertainty value for the whole dataset |
| latitude | Decimal degrees | Latitude at which air sample was collected |
| longitude | Decimal degrees | Longitude at which air sample was collected |
| T | Degrees K | Air temperature from the Vaisala instrument; average of all measurements made in the time interval. Not calibrated |
| T_nvalue | Number of individual measurements used to compute reported value. Fill value: -9 | |
| T_stdv | Degrees K | Standard deviation of all measurements made in the time interval. A value of 0 occurs when nvalue is equal to 1 |
| T_unc | Degrees K | Estimated uncertainty of the reported value. May be a single average uncertainty value for the whole dataset. Fill value: -9999 |
| P | Pa | Air pressure; average of all measurements made in the time interval. Not calibrated. Measuring instrument: Picarro G2401 |
| P_nvalue | Pa | Number of individual measurements used to compute reported value. Fill value: -9 |
| P_stdv | Pa | Standard deviation of all measurements made in the time interval. A value of 0 occurs when nvalue is equal to 1. Fill value: -9999 |
| P_unc | Pa | Estimated uncertainty of the reported value. May be a single average uncertainty value for the whole dataset. Fill value: -9999 |
| profile_id | A unique integer greater than 0 for each profile on each flight number; a value of 0 means that those data are not part of a profile | |
| RH | % | Relative humidity; average of all measurements made in the time interval. Not calibrated |
| RH_nvalue | % | Number of individual measurements used to compute reported value. Fill value: -9 |
| RH_stdv | % | Standard deviation of all measurements made in the time interval. A value of 0 occurs when nvalue is equal to 1. Fill value: -9999 |
| RH_unc | % | Estimated uncertainty of the reported value. May be a single average uncertainty value for the whole dataset. Fill value: -9999 |
| time | seconds since 1970-01-01T00:00:00Z | Number of seconds since January 1, 1970 in UTC. Time-averaged values are reported at the beginning of the averaging interval |
| time_components | YMDHMS | Calendar time components as integers. Times and dates are UTC. Time-averaged values are reported at the beginning of the averaging interval. Provided in the order: year, month, day, hour, minute, second |
| time_decimal | Decimal year in UTC. Time-averaged values are reported at the beginning of the averaging interval | |
| u | m/s | Eastward wind (Aspen instrument); Average of all measurements made in the time interval. Aircraft calibrated. Fill value: -9999 |
| u_nvalue | m/s | Number of individual measurements used to compute reported value. Fill value: -9 |
| u_stdv | m/s | Standard deviation of all measurements made in the time interval. A value of 0 occurs when nvalue is equal to 1. Fill value: -9999 |
| u_unc | m/s | Estimated uncertainty of the reported value. May be a single average uncertainty value for the whole dataset. Fill value: -9999 |
| v | m/s | Northward wind (Aspen instrument); Average of all measurements made in the time interval. Aircraft calibrated. Fill value: -9999 |
| v_nvalue | m/s | Number of individual measurements used to compute reported value. Fill value: -9 |
| v_stdv | m/s | Standard deviation of all measurements made in the time interval. A value of 0 occurs when nvalue is equal to 1. Fill value: -9999 |
| v_unc | m/s | Estimated uncertainty of the reported value. May be a single average uncertainty value for the whole dataset. Fill value: -9999 |
用户说明:变量 "profile_id "用于识别飞行过程中属于垂直剖面的观测数据。大于 0 的唯一整数标识每次飞行的每个剖面(flight_id)。数值为 0 表示这些数据不属于垂直剖面的一部分。
应用与推导
北极北方生态系统(ABE)的地表气温、海冰覆盖率和永久冻土的巨大变化可能会对关键生态系统服务和依赖于北极北方生态系统的人类社会产生重大影响。为了预测北极地区气候系统持续变化的结果,有必要通过了解空间变化和年际变化的驱动过程来了解北极地区生态系统的脆弱性。
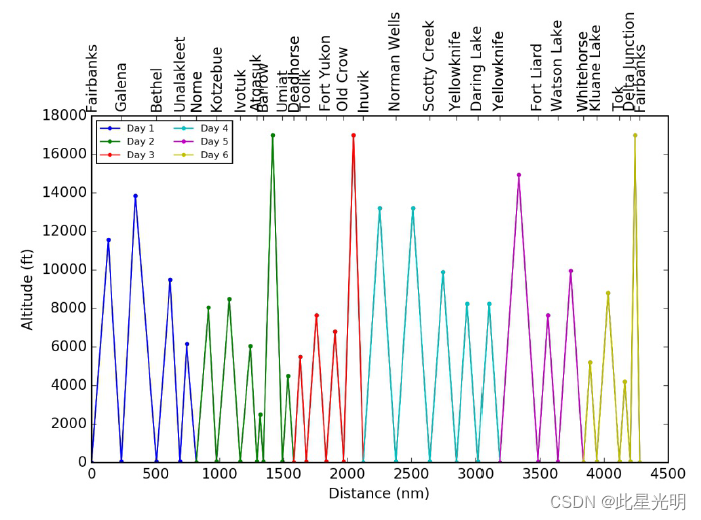
这些数据有助于我们理解和预测二氧化碳和甲烷的陆地-大气交换模型,从而更好地理解这些温室气体对 ABE 的反馈作用。每次活动都在本图上方列出的约 25 个地点中的每个地点进行垂直剖面飞行。完成所有剖面图需要 6 个飞行日。
机载原位仪器
| Instrument | Measurement frequency | Measurement |
|---|---|---|
| Picarro G2401 | 2.4 seconds | CH4, CO, CO2, and water vapor (H20), Air pressure (P) |
| Vaisala | 1 Hz | Relative humidity (RH), air temperature (T) |
| Aspen | 1 Hz | Eastward wind (u) and northward wind (v) speeds |
代码
!pip install leafmap
!pip install pandas
!pip install folium
!pip install matplotlib
!pip install mapclassify

import pandas as pd
import leafmap

url = "https://github.com/opengeos/NASA-Earth-Data/raw/main/nasa_earth_data.tsv"
df = pd.read_csv(url, sep="\t")
df

leafmap.nasa_data_login()


results, gdf = leafmap.nasa_data_search(
    short_name="ABoVE_Arctic_CAP_1658",
    cloud_hosted=True,
    bounding_box=(-166.04, 40.04, -104.11, 71.29),
    temporal=("2017-04-26", "2017-11-05"),
    count=-1,  # use -1 to return all datasets
    return_gdf=True,
)


gdf.explore()

#leafmap.nasa_data_download(results[:5], out_dir="data")
数据连接
ABoVE: Atmospheric Profiles of CO, CO2 and CH4 Concentrations from Arctic-CAP, 2017
引用
Sweeney, C., and K. McKain. 2019. ABoVE: Atmospheric Profiles of CO, CO2 and CH4 Concentrations from Arctic-CAP, 2017. ORNL DAAC, Oak Ridge, Tennessee, USA. ABoVE: Atmospheric Profiles of CO, CO2 and CH4 Concentrations from Arctic-CAP, 2017, https://doi.org/10.3334/ORNLDAAC/1658
网址推荐
0代码在线构建地图应用
Mapmost login https://sso.mapmost.com/#/login?source_inviter=nClSZANO


 被折叠的 条评论
为什么被折叠?
被折叠的 条评论
为什么被折叠?
 到【灌水乐园】发言


