


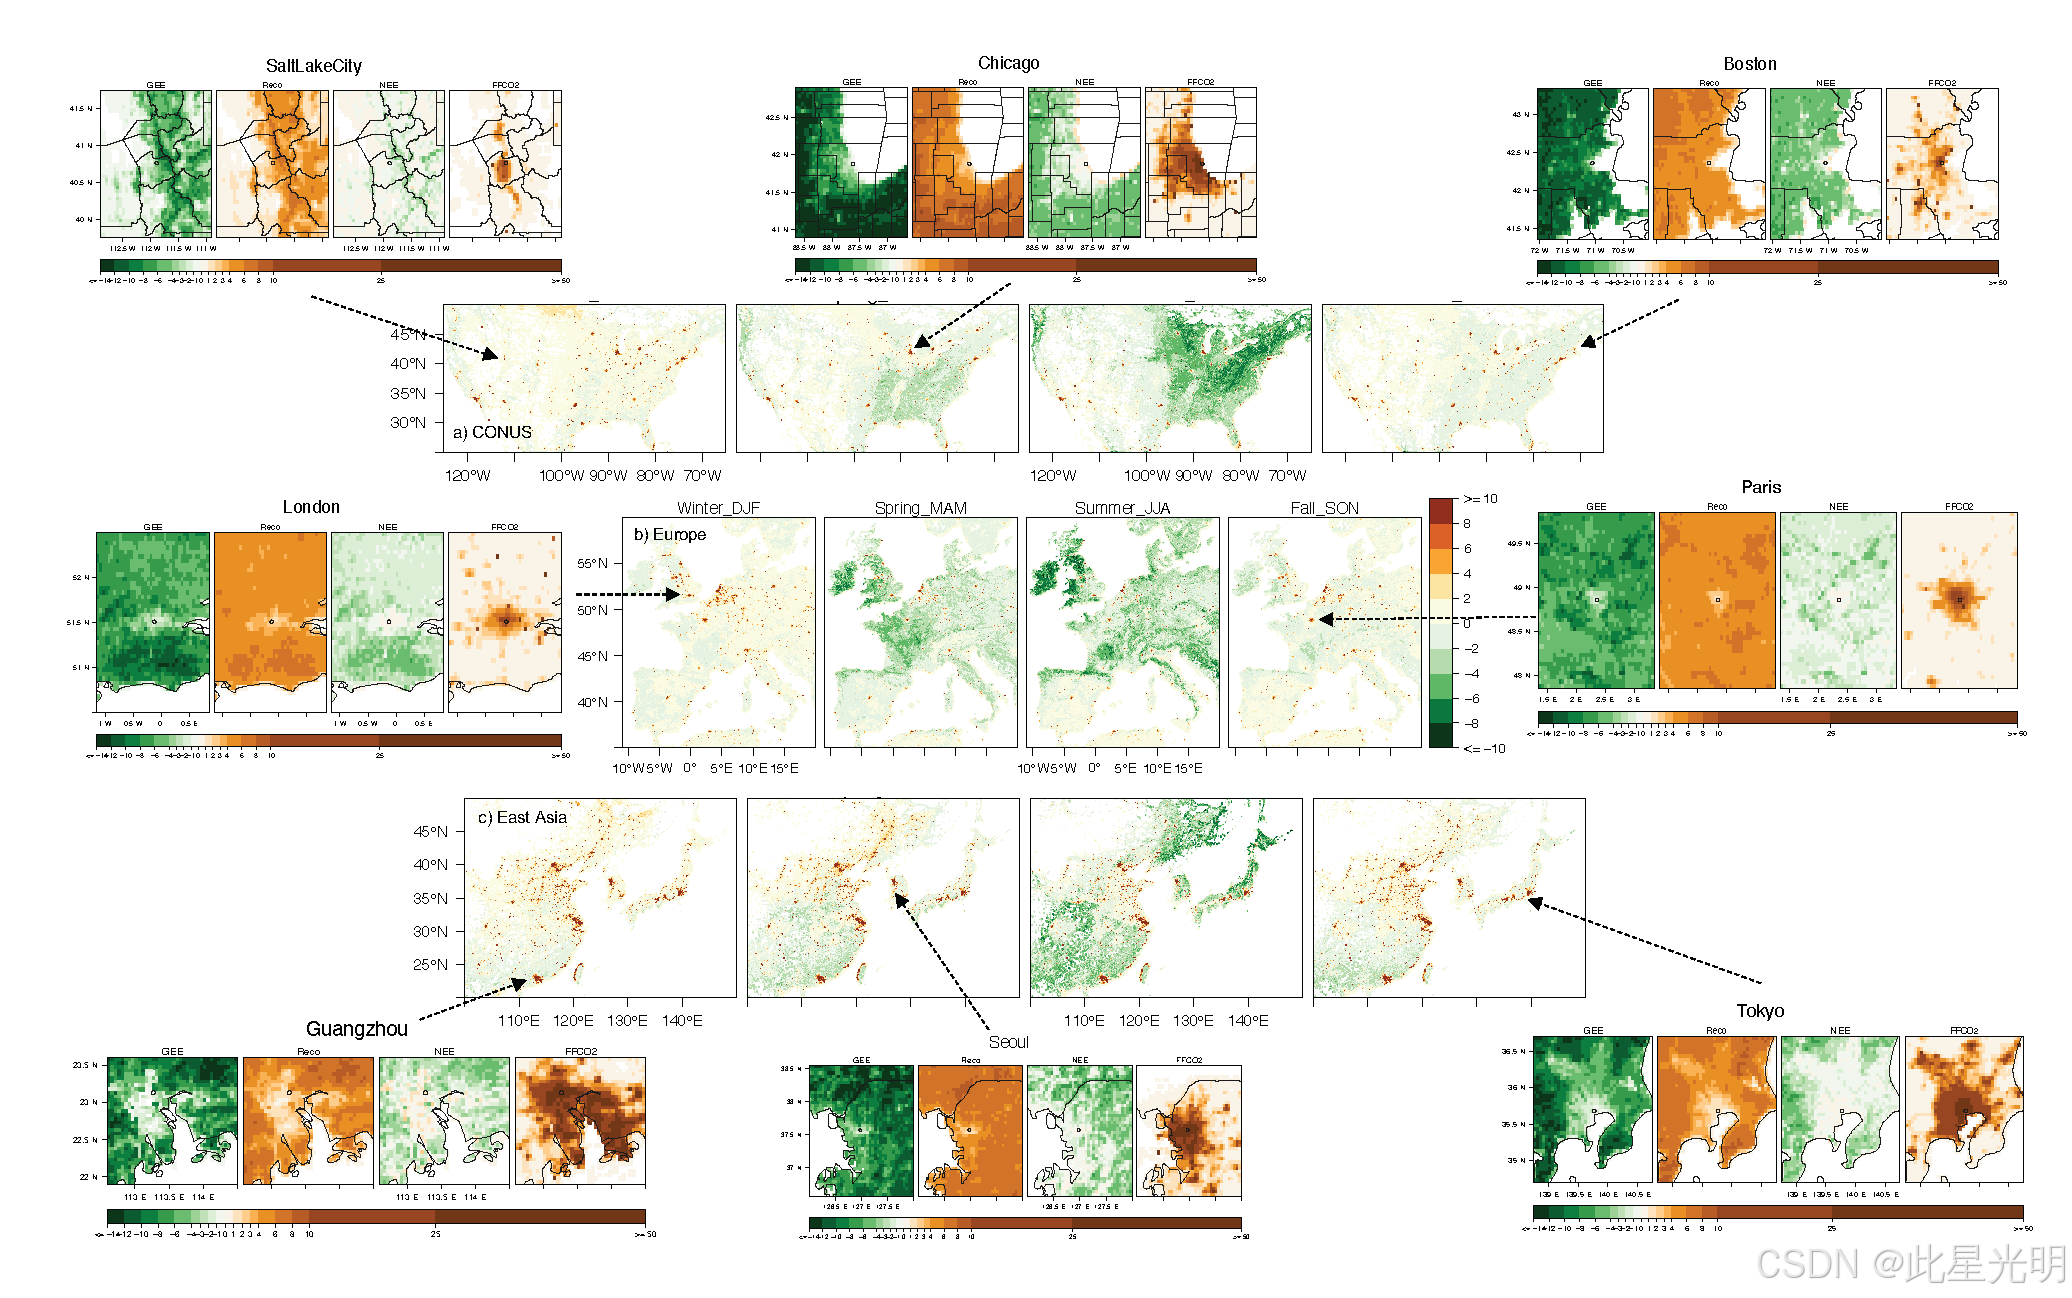
Urban Biogenic CO2 fluxes: GPP, Reco and NEE Estimates from SMUrF, 2010-2019
简介
这个数据集记录了2010年至2019年期间,城市中生物源碳排放的GPP(总初级生产力)、Reco(总呼吸作用)以及NEE(净生态交换)的估算值。这些数据来自SMUrF项目,可以帮助研究人员了解城市生态系统中碳的动态变化情况。
摘要
Common Core
Table 1. File names and descriptions. <yyyy> and <yyyymm> represent the year and year and month of the data file, respectively. See Table 2 for a description of each <region>.
| File Name | Description |
|---|---|
| fourday_mean_SIF_GPP_uncert_<region>_<yyyy>.nc4 (e.g., fourday_mean_SIF_GPP_uncert_easternChina_2018.nc4) | 4-day mean SIF and GPP uncertainties for each region, for each available year |
| daily_mean_Reco_uncert_<region>_<yyyymm>.nc4 | Daily mean Reco uncertainties for each region, for each month of each available year |
| hrly_mean_GPP_Reco_NEE_<region>_<yyyymm>.nc4 (e.g., hrly_mean_GPP_Reco_NEE_westernCONUS_201602.nc4) | Hourly mean GPP, Reco, and NEE for each region, for each month for each available year |
Data File Details
The no-data value is -999.
Table 2. Years of data available for each region.
| Region | Year |
|---|---|
| central Africa, eastern Asia, eastern Australia, eastern China, and South America | 2017, 2018 |
| eastern CONUS, western CONUS | 2010–2019 |
| western Europe | 2010–2014, 2017, 2018 |
Table 3. Variables included in all data files.
| Variables | Dimension and Unit | Description |
|---|---|---|
| lon | degree_east | Longitude at cell center |
| lat | degree_north | Latitude at cell center |
| time | seconds since 1970-01-01 00:00:00Z | UTC time |
Table 4. Variables in files named fourday_mean_SIF_GPP_uncert_<region>_<yyyy>.nc4.
| Variable | Units/format | Description |
|---|---|---|
| SIF_mean | mW m−2 nm−1 sr−1 | 4-day mean clear-sky CSIF from Zhang et al. (2018) |
| GPP_mean | µmol m-2 s-1 | 4-day mean Gross Primary Production (best estimates) based on clear-sky CSIF and GPP- SIF slopes aggregated from 500 m |
| GPP_sd | µmol m-2 s-1 | 1-sigma uncertainty of the 4-day mean Gross Primary Productions (based on model-FLUXNET comparisons) |
Table 5. Variables in files named daily_mean_Reco_uncert_<region>_<yyyymm>.nc4.
| Variable | Units/format | Description |
|---|---|---|
| Reco_mean | µmol m-2 s-1 | Daily mean Ecosystem Respiration (best estimates) based on pretrained biome-specific neural network models and ERA5-based temperature fields |
| Reco_sd | µmol m-2 s-1 | 1-sigma uncertainty of Daily Mean Ecosystem Respiration (based on model-FLUXNET comparisons) |
Table 6. Variables in files named hrly_mean_GPP_Reco_NEE_<region>_<yyyymm>.nc4.
| Variable | Units/format | Description |
|---|---|---|
| GPP_mean | µmol m-2 s-1 | Hourly mean Gross Primary Production (best estimates) using hourly downscaling factors based on hourly fields of surface solar radiation downwards from ERA5 reanalysis |
| Reco_mean | µmol m-2 s-1 | Hourly mean Ecosystem Respiration (best estimates) using hourly downscaling factors based on hourly air temperature fields from ERA5 reanalysis |
| NEE_mean | µmol m-2 s-1 | Hourly mean Net Ecosystem Exchanges (best estimates) based on hourly GPP and Reco |
代码
!pip install leafmap
!pip install pandas
!pip install folium
!pip install matplotlib
!pip install mapclassify

import pandas as pd
import leafmap

url = "https://github.com/opengeos/NASA-Earth-Data/raw/main/nasa_earth_data.tsv"
df = pd.read_csv(url, sep="\t")
df

leafmap.nasa_data_login()


results, gdf = leafmap.nasa_data_search(
    short_name="Biogenic_CO2flux_SIF_SMUrF_1899",
    cloud_hosted=True,
    bounding_box=(-125.0, -40.0, 155.0, 60.0),
    temporal=("2010-01-01", "2019-12-31"),
    count=-1,  # use -1 to return all datasets
    return_gdf=True,
)


gdf.explore()

#leafmap.nasa_data_download(results[:5], out_dir="data")
引用
Wu, D., and J.C. Lin. 2021. Urban Biogenic CO2 fluxes: GPP, Reco and NEE Estimates from SMUrF, 2010-2019. ORNL DAAC, Oak Ridge, Tennessee, USA.
网址推荐
知识星球
知识星球 | 深度连接铁杆粉丝,运营高品质社群,知识变现的工具 (zsxq.com)![]() https://wx.zsxq.com/group/48888525452428
https://wx.zsxq.com/group/48888525452428


 5258
5258

 被折叠的 条评论
为什么被折叠?
被折叠的 条评论
为什么被折叠?
 到【灌水乐园】发言


