


1 axis与figure
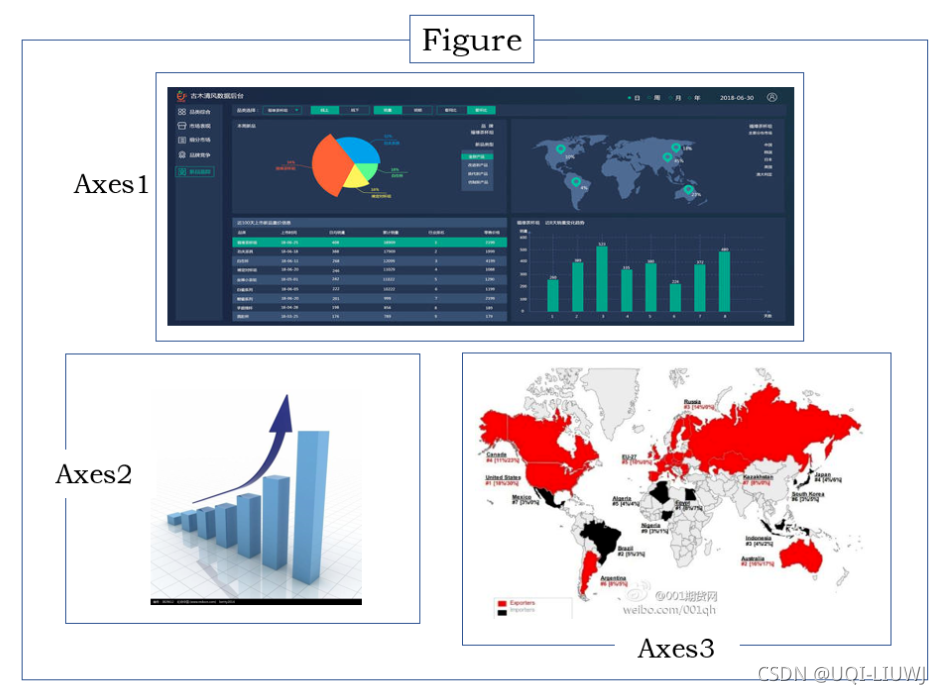
我们可以把figure看成一个大的画布;ax(axis)看成是画布中的一块区域
1.1 plt.figure()
matplotlib.pyplot.figure(
    figsize=None,
    dpi=None,
    facecolor=None,
    edgecolor=None,
    frameon=True,
    clear=False,
    **kwargs)
1.1.1 参数说明
| 参数名称 | 参数说明 |
| figsize | (float,float),画布尺寸 ,默认为6.4*4.8 |
| dpi | int 分辨率,默认为100 |
| facecolor | 背景色,默认为白色('w') |
| edgecolor | 边界颜色,默认为白色('w') |
| frameon | bool,是否有边界,默认为True |
| clear | bool,是否对存在的画布进行清楚,默认为False(即自动创建新画布) |
1.2 两种创建figure(画布)的方式
1.2.1 显式创建 figure 对象
plt.figure()
1.2.2 隐式创建 figure 对象
当第一次执行 plt.xxx()画图代码时,系统会去判断是否已经有了 figure 对象,如果没有,系统会自动创建一个 figure 对象,并且在这个 figure 之上,自动创建一个 axes 坐标系(注意:默认创建一个 figure 对象,一个 axes 坐标系)
也就是说,如果我们不设置 figure 对象,那么一个 figure 对象上,只能有一个 axes 坐标系,
即我们只能绘制一个图形
1.2.3 隐式创建 figure 对象的优劣
- 优势:如果只是绘制一个小图形,那么直接使用 plt.xxx()的方式,会自动帮我们创建一个 figure 对象和一个 axes 坐标系,这个图形最终就是绘制在这个 axes 坐标系之上的。
-
劣势:如果我们想要在一个 figure 对象上,绘制多个图形,那么我们就必须拿到每个个 axes对象,然后调用每个位置上的 axes 对象。但如果 figure 对象是被默认创建的,那么我们根本拿不到 axes 对象。也就是说, 隐式创建没法绘制多个图形
2 plt.plot()与ax.plot()
如果不考虑子图的话,plt.plot()效果和ax.plot()一致
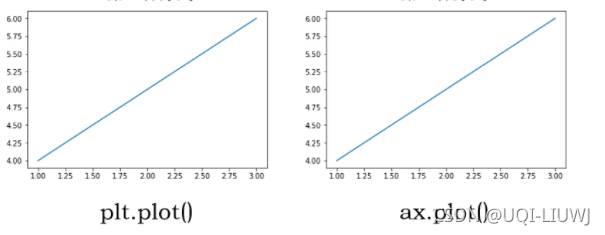
plt.plot()相当于生成了一个figure画布,然后在画布上隐式生成一个画图区域进行画图
ax.plot()相当于同时生成了figure和axis两个对象,然后在ax对象的区域内画图
一个
figure(
画布
)
上,可以有多个区域
axes(
坐标系
)
,我们在每个坐标系上绘图,也就是说每
个
axes(
坐标系
)
中,都有一个
axis(
坐标轴
)
。
3 subplot
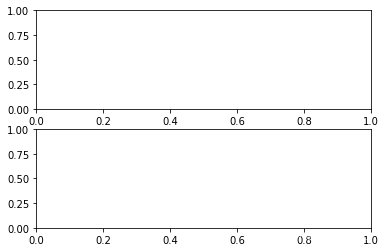
import matplotlib.pyplot as plt

fig,ax=plt.subplots(2,1)

fig,ax
可以看到,一个画布,两个子图区域
import matplotlib.pyplot as plt

fig,ax=plt.subplots(1,2)

ax[0].plot([1,2,3],[4,5,6])
ax[1].scatter([1,2,3],[4,5,6]) 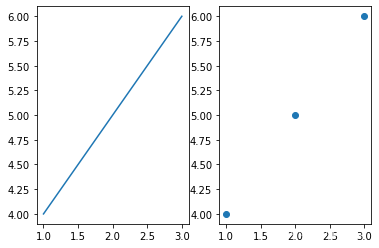
后面的这些ax.set_XXX的指令,方式类似于plt.XXX
-
plt.xlabel()→ax.set_xlabel() -
plt.ylabel()→ax.set_ylabel() -
plt.xlim()→ax.set_xlim() -
plt.ylim()→ax.set_ylim() -
plt.title()→ax.set_title()
3.1 设置子图标题
set_title 函数
import matplotlib.pyplot as plt

fig,ax=plt.subplots(1,2)

ax[0].plot([1,2,3],[4,5,6])
ax[0].set_title('plot')
ax[1].scatter([1,2,3],[4,5,6])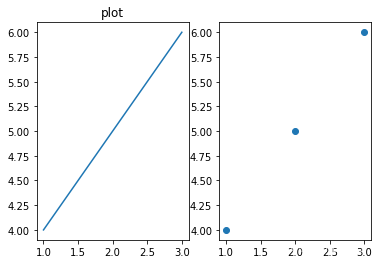
3.2 设置子图周围的间距
默认情况下,会在子图的外部和子图之间留出一定间距,这个间距是根据图的高度和宽度调整的,
subplots_adjust(
    left=None,
    bottom=None,
    right=None,
    top=None,
    wspace=None,
    hspace=None)
import matplotlib.pyplot as plt
fig,ax=plt.subplots(1,2)
ax[0].plot([1,2,3],[4,5,6])
ax[1].scatter([1,2,3],[4,5,6])
plt.subplots_adjust(wspace=1)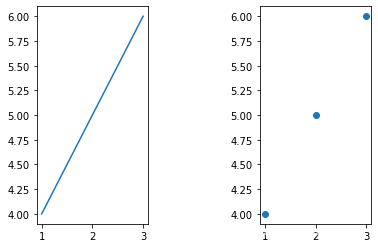
3.3 设置子图范围
ax.set_ylim(...)
3.4 设置legend
3.4.1 一个子图一个legend
import matplotlib.pyplot as plt

fig,ax=plt.subplots(1,2)

ax[0].plot([4,5,6])
ax[0].plot([4,5.1,3.5])
ax[1].plot([4,15,26])
ax[1].plot([4,-5.1,-3.5])
ax[0].legend(['a','b'])
ax[1].legend(['c','d'])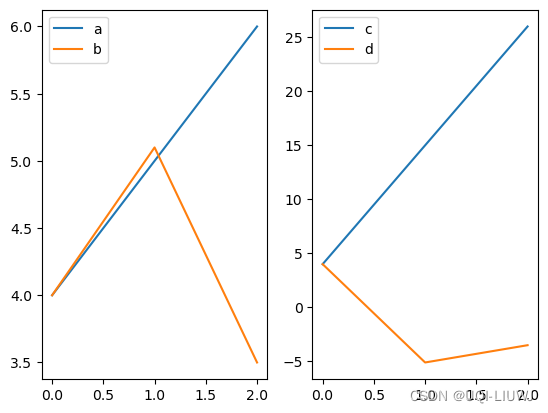
3.4.2 共用一个legend
import matplotlib.pyplot as plt

fig,ax=plt.subplots(1,2)

ax[0].plot([4,5,6])
ax[0].plot([4,5.1,3.5])
ax[1].plot([4,15,26])
ax[1].plot([4,-5.1,-3.5])
fig.legend(['a','b'])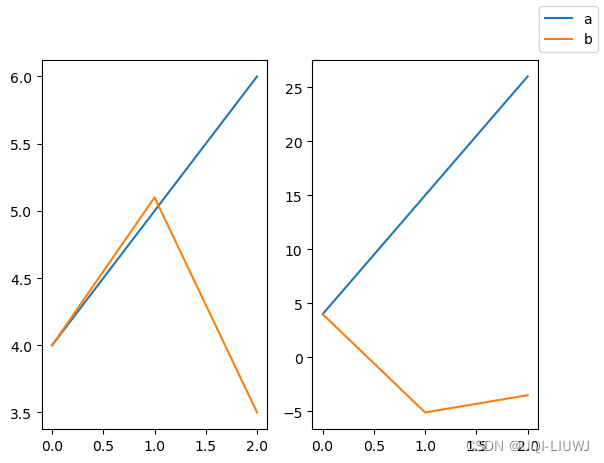
3.5 sharex ,sharey
各子图 x轴y轴共享坐标轴
import matplotlib.pyplot as plt

fig,ax=plt.subplots(1,2,sharex=True,sharey=True)

ax[0].plot([4,5,6])
ax[0].plot([4,5.1,3.5])
ax[1].plot([4,15,26])
ax[1].plot([4,-5.1,-3.5])
fig.legend(['a','b'])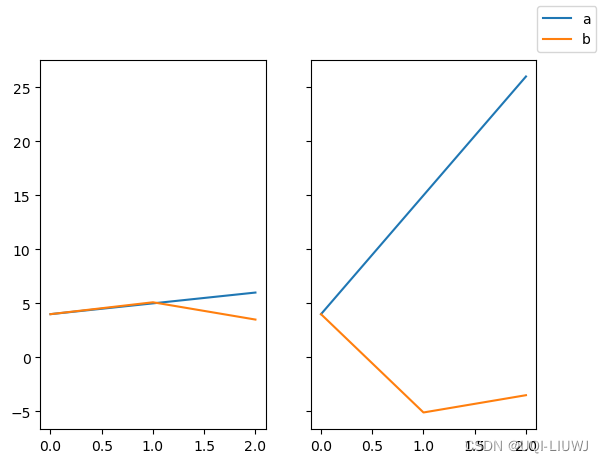
3.6 设置 x,y 坐标内容
xticks+xticklabels 联合使用
y同理
import matplotlib.pyplot as plt

x_values = [1, 2, 3, 4]
y_values = [10, 15, 7, 12]

fig, ax = plt.subplots(1,2)
ax[0].plot(x_values, y_values)

# Set custom tick labels for the x-axis
custom_labels = ['Label 1', 'Label 2', 'Label 3', 'Label 4']
ax[0].set_xticks(x_values)
ax[0].set_xticklabels(custom_labels)
#一个x value 对应一个custom label

ax[0].set_yticks([0,5,10,15])
ax[0].set_yticklabels(['low','medium','high','very high'])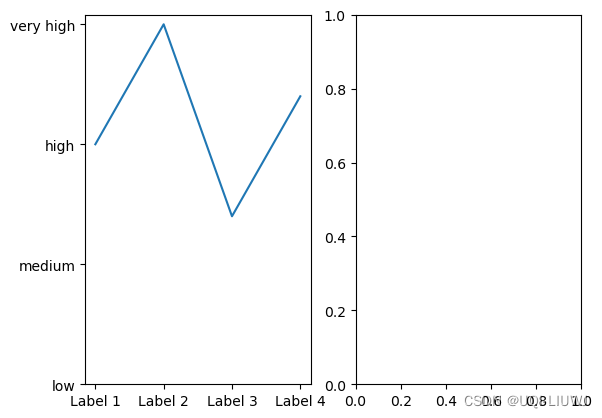
3.7 设置x,y表示
set_xlabel
import matplotlib.pyplot as plt

x_values = [1, 2, 3, 4]
y_values = [10, 15, 7, 12]

fig, ax = plt.subplots(1,2)
ax[0].plot(x_values, y_values)

ax[1].set_xlabel('x in plt2')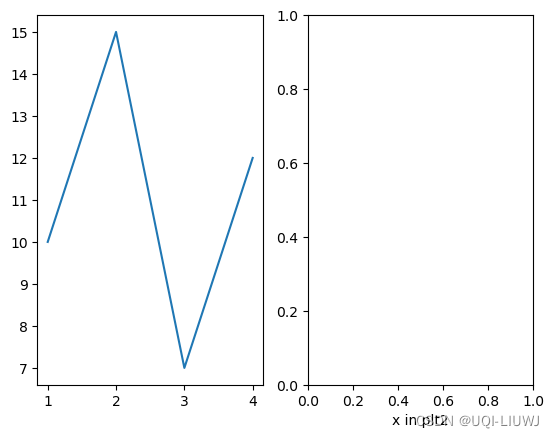
3.8 统一接口:ax.set
import matplotlib.pyplot as plt

x_values = [1, 2, 3, 4]
y_values = [10, 15, 7, 12]

fig, ax = plt.subplots(1,2)
ax[0].plot(x_values, y_values)

ax[0].set(yticks=[0,5,10,15],
         yticklabels=['low','medium','high','very high'],
         xlim=[-2,4])
ax[1].set(xlabel='x in plt2',
         title='subplot 2')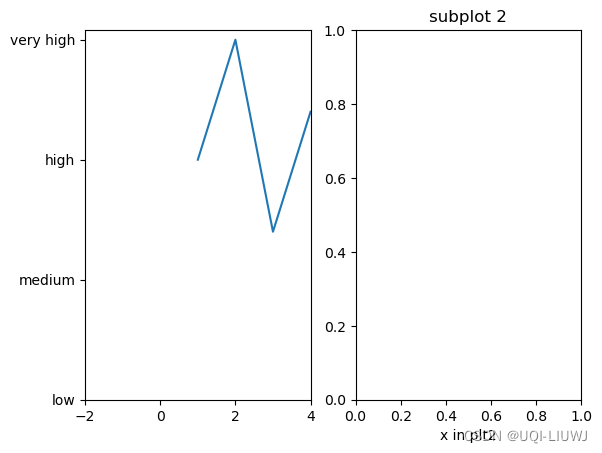


 475
475

 被折叠的 条评论
为什么被折叠?
被折叠的 条评论
为什么被折叠?
 到【灌水乐园】发言


