数据集笔记:METR-la 原始数据转input/ground truth

0 问题介绍

在交通预测/时间序列预测的论文中(如论文笔记:Dual Dynamic Spatial-Temporal Graph ConvolutionNetwork for Traffic Prediction_dual dynamic spatial-temporal graph convolution ne-CSDN博客

模型输入的是过去12个时间片的内容,预测未来12个时间片的内容,而metrla数据集的格式是N*T,那怎么将原始数据集变成N*T*12的格式(test/train数据集)呢?

1 读取metr-la

import pandas as pd

df = pd.read_hdf('metr-la.h5')
df

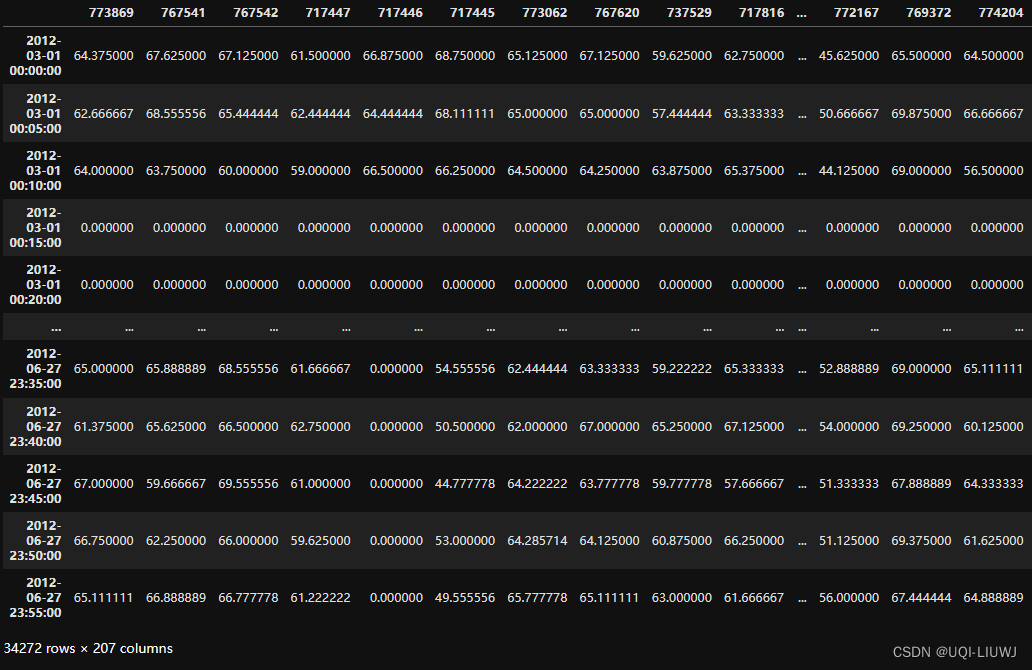
2 输入x和ground-truth y的offset设置

x_offsets=np.arange(-11, 1, 1)
x_offsets
#array([-11, -10,  -9,  -8,  -7,  -6,  -5,  -4,  -3,  -2,  -1,   0])


y_offsets = np.arange(1, 13, 1)
y_offsets
#array([ 1,  2,  3,  4,  5,  6,  7,  8,  9, 10, 11, 12])

3当前时刻在某一天中的offset

这个其实很多模型不一定用得上,但和github里面的处理方法对齐,这边也计算这一步

time_ind = (df.index.values - df.index.values.astype("datetime64[D]")) / np.timedelta64(1, "D")
time_ind.shape,time_ind
'''
((34272,),
 array([0.        , 0.00347222, 0.00694444, ..., 0.98958333, 0.99305556,
        0.99652778]))
'''
time_in_day = np.tile(time_ind, [1, num_nodes, 1]).transpose((2, 1, 0))
'''
np.tile(time_ind, [1, num_nodes, 1]),

time_ind 是(34272,)的一维向量,遇到tile的时候首先扩展维度

扩展维度一般是shape向左扩展,也即变成(1,1,34272)

然后用tile扩展维度,变成(1,num_nodes,34272)

在经过transpose,第2个维度和第0个维度互换
'''
time_in_day.shape
#(34272, 207, 1)

4 将offset和交通数据合并

data = np.expand_dims(df.values, axis=-1)
data.shape
#(34272, 207, 1)

data_list = [data]

data_list.append(time_in_day)


data = np.concatenate(data_list, axis=-1)
data.shape
#(34272, 207, 2)

5 生成输入和ground-truth列表

x, y = [], []
min_t = abs(min(x_offsets))
max_t = abs(num_samples - abs(max(y_offsets)))  # Exclusive
min_t,max_t
#(11, 34260)


for t in range(min_t, max_t):
    x_t = data[t + x_offsets, :]
    y_t = data[t + y_offsets, :]
    x.append(x_t)
    y.append(y_t)
x = np.stack(x, axis=0)
y = np.stack(y, axis=0)

x.shape,y.shape
#((34249, 12, 207, 2), (34249, 12, 207, 2))

'''
offset是
[ 0  1  2  3  4  5  6  7  8  9 10 11]
[22 21 20 19 18 17 16 15 14 13 12 11]
**********
[ 1  2  3  4  5  6  7  8  9 10 11 12]
[23 22 21 20 19 18 17 16 15 14 13 12]
**********
[ 2  3  4  5  6  7  8  9 10 11 12 13]
[24 23 22 21 20 19 18 17 16 15 14 13]
**********
[ 3  4  5  6  7  8  9 10 11 12 13 14]
[25 24 23 22 21 20 19 18 17 16 15 14]
**********
[ 4  5  6  7  8  9 10 11 12 13 14 15]
[26 25 24 23 22 21 20 19 18 17 16 15]
**********
[ 5  6  7  8  9 10 11 12 13 14 15 16]
[27 26 25 24 23 22 21 20 19 18 17 16]
**********
一位一位向前滚
'''

6 train,val,test文件

num_samples = x.shape[0]
num_test = round(num_samples * 0.2)
num_train = round(num_samples * 0.7)
num_val = num_samples - num_test - num_train
num_test,num_train,num_val
#(6850, 23974, 3425)

7 保存至本地

for cat in ["train", "val", "test"]:
        _x, _y = locals()["x_" + cat], locals()["y_" + cat]
        '''
        使用locals()函数动态获取名为x_train, y_train, x_val, y_val, x_test, y_test的变量
        这些变量分别代表训练集、验证集和测试集的输入和输出数据
        '''
        print(cat, "x: ", _x.shape, "y:", _y.shape)

        np.savez_compressed(
            os.path.join(args.output_dir, "%s.npz" % cat),
            x=_x,
            y=_y,
            x_offsets=x_offsets.reshape(list(x_offsets.shape) + [1]),
            y_offsets=y_offsets.reshape(list(y_offsets.shape) + [1]),
        )
        '''
        使用numpy.savez_compressed函数将数据保存到压缩文件中,文件名格式为{分类}.npz

        输入数据保存为关键字x。
        输出数据保存为关键字y。
        输入和输出的时间偏移量(x_offsets和y_offsets)也被保存    
        '''

  • 6
    点赞
  • 14
    收藏
    觉得还不错? 一键收藏
  • 打赏
    打赏
  • 0
    评论

“相关推荐”对你有帮助么?

  • 非常没帮助
  • 没帮助
  • 一般
  • 有帮助
  • 非常有帮助
提交
评论
添加红包

请填写红包祝福语或标题

红包个数最小为10个

红包金额最低5元

当前余额3.43前往充值 >
需支付:10.00
成就一亿技术人!
领取后你会自动成为博主和红包主的粉丝 规则
hope_wisdom
发出的红包

打赏作者

UQI-LIUWJ

你的鼓励将是我创作的最大动力

¥1 ¥2 ¥4 ¥6 ¥10 ¥20
扫码支付:¥1
获取中
扫码支付

您的余额不足,请更换扫码支付或充值

打赏作者

实付
使用余额支付
点击重新获取
扫码支付
钱包余额 0

抵扣说明:

1.余额是钱包充值的虚拟货币,按照1:1的比例进行支付金额的抵扣。
2.余额无法直接购买下载,可以购买VIP、付费专栏及课程。

余额充值