


- h3-py使用抽象基类
H3Shape及其具体子类LatLngPoly和LatLngMultiPoly来表示多边形 (polygon) 和多多边形 (multipolygon)- 任何涉及 “H3Shape” 的引用或函数名,都同时适用于
LatLngPoly和LatLngMultiPoly对象
- 任何涉及 “H3Shape” 的引用或函数名,都同时适用于
1 LatLngPoly
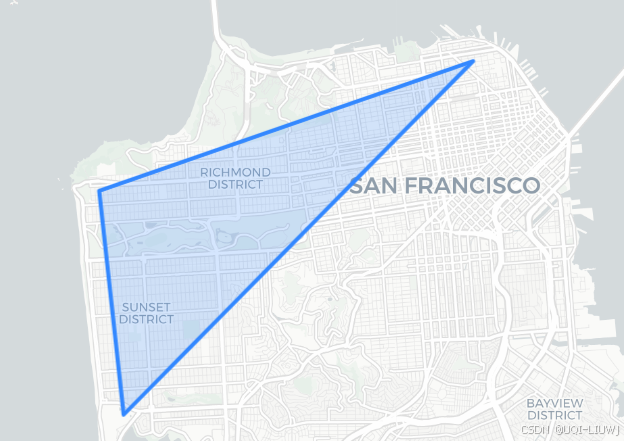
- 通过提供一组 经纬度 (latitude/longitude) 坐标对 来创建一个简单的
LatLngPoly对象,这些坐标描述了多边形的外边界。
import h3
import folium

outer = [
    (37.804, -122.412),
    (37.778, -122.507),
    (37.733, -122.501)
]

poly = h3.LatLngPoly(outer)
print(poly)
#<LatLngPoly: [3]>


# folium 地图
m = folium.Map(location=[37.77, -122.45], zoom_start=12, tiles="cartodbpositron")

folium.GeoJson(
    poly.__geo_interface__
).add_to(m)
m
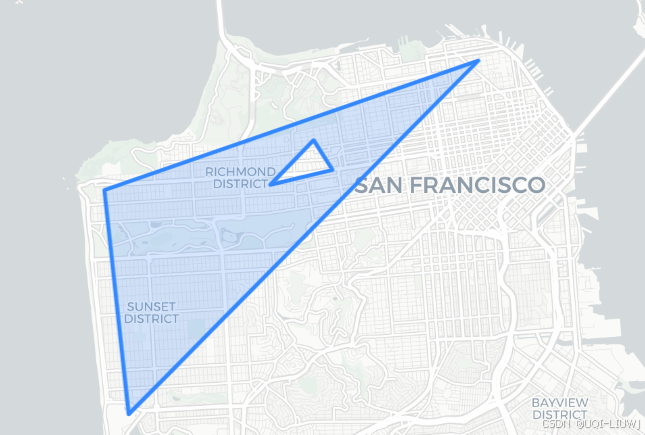
- 还可以选择性地在多边形中添加 “孔洞 (holes)” —— 只需再追加一些经纬度坐标列表,用来描述这些孔洞即可
hole1 = [
    (37.782, -122.449),
    (37.779, -122.465),
    (37.788, -122.454),
]

poly = h3.LatLngPoly(outer, hole1)
print(poly)
#<LatLngPoly: [3/(3,)]>

# folium 地图
m = folium.Map(location=[37.77, -122.45], zoom_start=12, tiles="cartodbpositron")

folium.GeoJson(
    poly.__geo_interface__
).add_to(m)
m
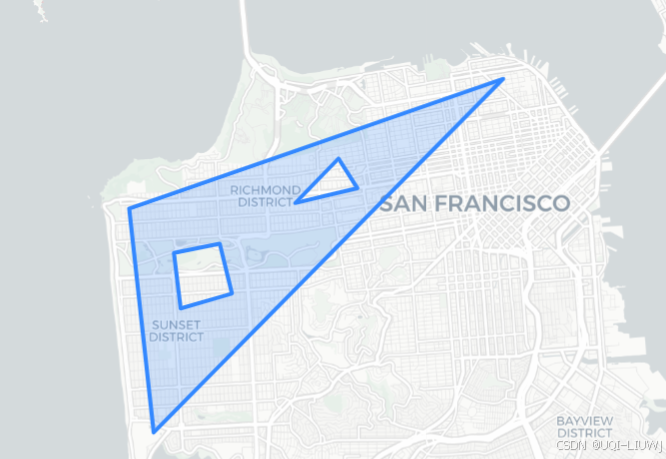
hole2 = [
    (37.771, -122.484),
    (37.761, -122.481),
    (37.758, -122.494),
    (37.769, -122.496),
]

poly = h3.LatLngPoly(outer, hole1, hole2)
print(poly)
# folium 地图
m = folium.Map(location=[37.77, -122.45], zoom_start=12, tiles="cartodbpositron")

folium.GeoJson(
    poly.__geo_interface__
).add_to(m)
m
1.1 字符串表示与属性
LatLngPoly 的字符串表示(通过它的 __repr__ 方法给出)会显示:
-
外环(outer loop)顶点的数量;
-
以及每个孔洞(hole)顶点的数量。
<LatLngPoly: [3/(3, 4)]>
表示一个多边形:
-
外边界由 3 个顶点组成;
-
内部有 2 个孔洞,第一个孔洞由 3 个顶点组成,第二个孔洞由 4 个顶点组成。
1.2 坐标访问
可以通过属性来访问构成多边形的坐标:
-
LatLngPoly.outer
返回外环的经纬度点列表(外边界)。 LatLngPoly.holes
返回一个列表,其中每个元素又是一个经纬度点列表,分别描述每个孔洞。
poly = h3.LatLngPoly(outer, hole1, hole2)
poly.outer
#((37.804, -122.412), (37.778, -122.507), (37.733, -122.501))


poly.holes
'''
([(37.782, -122.449), (37.779, -122.465), (37.788, -122.454)],
 [(37.771, -122.484),
  (37.761, -122.481),
  (37.758, -122.494),
  (37.769, -122.496)])
'''
2 __geo_interface__
LatLngPoly.__geo_interface__会返回该多边形的 GeoJSON 表示LatLngPoly.__geo_interface__等价于对该对象调用h3.h3shape_to_geo():
-
需要注意以下区别:
-
点的顺序:GeoJSON 中的点是 (lng, lat)(经度在前,纬度在后),而
LatLngPoly构造函数需要 (lat, lng)。 -
首尾点重复:GeoJSON 中的多边形,最后一个顶点会重复第一个顶点,以闭合环路。
-
d = poly.__geo_interface__
d
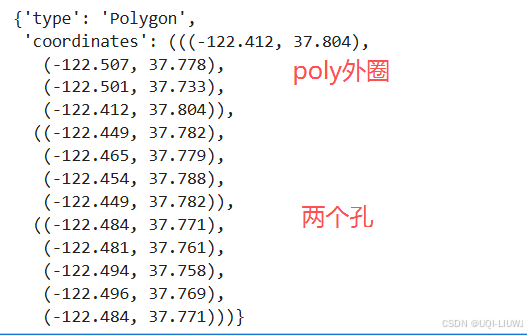
h3.h3shape_to_geo(poly)
'''
{'type': 'Polygon',
 'coordinates': (((-122.412, 37.804),
   (-122.507, 37.778),
   (-122.501, 37.733),
   (-122.412, 37.804)),
  ((-122.449, 37.782),
   (-122.465, 37.779),
   (-122.454, 37.788),
   (-122.449, 37.782)),
  ((-122.484, 37.771),
   (-122.481, 37.761),
   (-122.494, 37.758),
   (-122.496, 37.769),
   (-122.484, 37.771)))}
'''
2.1 从 GeoJSON 创建 LatLngPoly
可以通过 h3.geo_to_h3shape() 从 GeoJSON 字典或任何实现了 __geo_interface__ 的对象来创建一个 LatLngPoly
d = poly.__geo_interface__
d
'''
{'type': 'Polygon',
 'coordinates': (((-122.412, 37.804),
   (-122.507, 37.778),
   (-122.501, 37.733),
   (-122.412, 37.804)),
  ((-122.449, 37.782),
   (-122.465, 37.779),
   (-122.454, 37.788),
   (-122.449, 37.782)),
  ((-122.484, 37.771),
   (-122.481, 37.761),
   (-122.494, 37.758),
   (-122.496, 37.769),
   (-122.484, 37.771)))}
'''

h3.geo_to_h3shape(d)
#<LatLngPoly: [3/(3, 4)]>
3 多边形转 H3 单元格
- 可以通过
h3.h3shape_to_cells()获取某个多边形 (LatLngPoly) 内部所有 H3 单元格(cell) - 具体来说,它会返回所有质心 (centroid) 落在该多边形内部的单元格索引
- 调用时需要指定 分辨率 (resolution)。
hole1 = [
    (37.782, -122.449),
    (37.779, -122.465),
    (37.788, -122.454),
]

poly = h3.LatLngPoly(outer, hole1)
print(poly)

h3.h3shape_to_cells(poly, res=7)
'''
<LatLngPoly: [3/(3,)]>
['872830958ffffff', '87283095bffffff', '87283095affffff', '872830829ffffff']
'''
from shapely.geometry import shape as shapely_shape
# folium 地图
m = folium.Map(location=[37.77, -122.45], zoom_start=12, tiles="cartodbpositron")

folium.GeoJson(
    poly.__geo_interface__
).add_to(m)

cells = h3.h3shape_to_cells(poly,9)
boundary = h3.cells_to_h3shape(cells)
print(boundary)

folium.GeoJson(
    boundary.__geo_interface__
).add_to(m)

m
3.1 H3 多边形不要求遵循“右手法则”
- 与 GeoJSON Polygon 不同,
LatLngPoly对象 不需要遵循“右手法则”。 -
右手法则 的要求是:
-
外环(outer loop)顶点必须按 逆时针 (counterclockwise) 顺序排列;
-
孔洞(holes)顶点必须按 顺时针 (clockwise) 顺序排列。
-
-
在
h3-py中:-
顶点顺序可以随意,通常都会按你期望的方式解析,例如在转换为 H3 cell 集合时。
-
但是:
h3-py并不会自动调整顶点顺序来符合右手法则。-
所以如果你用
__geo_interface__去画图,可能出现渲染错误。
-
-
4 LatLngMultiPoly
一个 LatLngMultiPoly 可以由多个 LatLngPoly 对象创建。
它的字符串表示会显示:
-
每个
LatLngPoly外环的顶点数量; -
以及每个孔洞(如果存在)的顶点数量。
poly1 = h3.LatLngPoly([(37.804, -122.412), (37.778, -122.507), (37.733, -122.501)])
poly2 = h3.LatLngPoly(
    [(37.803, -122.408), (37.736, -122.491), (37.738, -122.380), (37.787, -122.39)],
    [(37.760, -122.441), (37.772, -122.427), (37.773, -122.404), (37.758, -122.401), (37.745, -122.428)]
)
mpoly = h3.LatLngMultiPoly(poly1, poly2)

print(poly1)
print(poly2)
print(mpoly)

'''
<LatLngPoly: [3]>
<LatLngPoly: [4/(5,)]>
<LatLngMultiPoly: [3], [4/(5,)]>
'''
m = folium.Map(location=[37.77, -122.45], zoom_start=12, tiles="cartodbpositron")

folium.GeoJson(
    mpoly.__geo_interface__
).add_to(m)
m
5 从 Cells 转换为 LatLngPoly 或 LatLngMultiPoly
如果你手里有一组 H3 单元格 (cells) 想要可视化,有两种常用做法:
-
转换为
LatLngPoly/LatLngMultiPoly-
使用
h3.cells_to_h3shape(cells)。 -
得到的结果可以通过
__geo_interface__拿到 GeoJSON 表示,方便绘图(比如在folium或geopandas中)。
-
-
直接获取 GeoJSON
-
使用
h3.cells_to_geo(cells)。 -
直接返回一个 GeoJSON 风格的字典,可以立即丢给
folium.GeoJson()使用。
-
6 h3shape_to_geo
把 H3Shape 转成 __geo_interface__ 风格的字典
outer = [
    (37.804, -122.412),
    (37.778, -122.507),
    (37.733, -122.501)
]

poly = h3.LatLngPoly(outer)

geo = h3.h3shape_to_geo(poly)
geo
'''
{'type': 'Polygon',
 'coordinates': (((-122.412, 37.804),
   (-122.507, 37.778),
   (-122.501, 37.733),
   (-122.412, 37.804)),)}
'''
7 geo_to_h3shape
from shapely.geometry import Polygon
from h3 import geo_to_h3shape

# 注意:Shapely 使用 (lon, lat) 顺序!与 H3 的 (lat, lon) 相反。
outer_lonlat = [(103.80, 1.305), (103.82, 1.290), (103.84, 1.295)]
hole_lonlat  = [(103.815, 1.297), (103.825, 1.296), (103.818, 1.294)]

shp = Polygon(outer_lonlat, [hole_lonlat])
h3shape = geo_to_h3shape(shp.__geo_interface__)
h3shape
#<LatLngPoly: [3/(3,)]>
8 h3shape_to_cells
在指定分辨率 res 下,返回中心点落在该多边形内的一组 H3 单元(hex 索引)
import h3

outer = [
    (37.804, -122.412),
    (37.778, -122.507),
    (37.733, -122.501)
]

poly = h3.LatLngPoly(outer)

res = 9  # 示例分辨率
cells = h3.h3shape_to_cells(poly, res)
cells
'''
['8928309594bffff',
 '89283082927ffff',
 '89283095a27ffff',
 '89283095a53ffff',
 '892830829abffff',
 '89283087493ffff',
 '89283095aabffff',
...
'''
9 cells_to_h3shape
把一组 同分辨率 的 H3 单元重建为 H3Shape(尽量贴近“真实边界”)。
tight=True:能合并成单一多边形时返回 LatLngPoly,否则 LatLngMultiPoly
tight=False:总是返回 LatLngMultiPoly(边界可能更“松”一些)
from h3 import cells_to_h3shape

shape_from_cells = cells_to_h3shape(cells, tight=True)
shape_from_cells
#<LatLngPoly: [148]>
10 h3shape_to_cells_experimental
- 这是 h3shape_to_cells 的增强版本,用于把一个多边形区域(H3Shape,比如 LatLngPoly 或 LatLngMultiPoly)转化为一组 H3 单元格。
- 与老版本的区别:
- h3shape_to_cells 只支持 中心点包含 (center) 模式。
- h3shape_to_cells_experimental 支持多种判定模式,可以更灵活地决定哪些 cell 算“在多边形里面”。
-
res:目标 H3 分辨率(0–15)
-
contain:判定方式(字符串),可选:
-
"center":cell 的中心点在多边形内(默认逻辑,旧函数的行为)
-
"full":整个 cell 完全在多边形内才算
-
"overlap":只要 cell 与多边形有部分重叠就算(最宽松)
-
"bbox_overlap":只检查 cell 的外接矩形是否与多边形重叠(更快但近似)
-
-
from h3 import LatLngPoly, h3shape_to_cells_experimental

import h3

outer = [
    (37.804, -122.412),
    (37.778, -122.507),
    (37.733, -122.501)
]

poly = h3.LatLngPoly(outer)

cells_center = h3shape_to_cells_experimental(poly, res=9, contain="center")
print("中心点包含:", len(cells_center), "个 cell")
#中心点包含: 197 个 cell


cells_full = h3shape_to_cells_experimental(poly, res=9, contain="full")
print("完全包含:", len(cells_full), "个 cell")
#完全包含: 155 个 cell


cells_overlap = h3shape_to_cells_experimental(poly, res=9, contain="overlap")
print("任意重叠:", len(cells_overlap), "个 cell")
#任意重叠: 243 个 cell


cells_bbox = h3shape_to_cells_experimental(poly, res=9, contain="bbox_overlap")
print("bbox 重叠:", len(cells_bbox), "个 cell")
#bbox 重叠: 294 个 cell


 1567
1567

 被折叠的 条评论
为什么被折叠?
被折叠的 条评论
为什么被折叠?
 到【灌水乐园】发言


