


激光雷达与投影坐标关系
3D激光雷达向2D图片进行投影主要包括,BV:鸟瞰图,FV:正视图。两种方式都需要考虑图片坐标与激光雷达坐标间的对应关系,其关系如下图所示。
坐标间对应关系

图片坐标,横向为X轴,纵向为Y轴
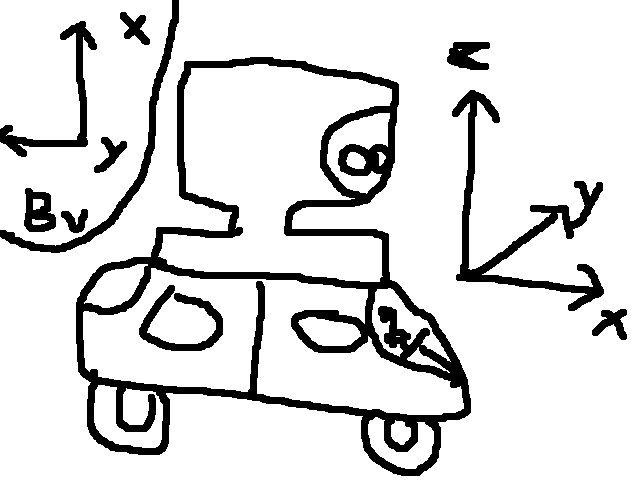
激光雷达坐标,雷达正前方为X轴正方向,左侧为Y轴正方向,垂直向上Z轴正方向
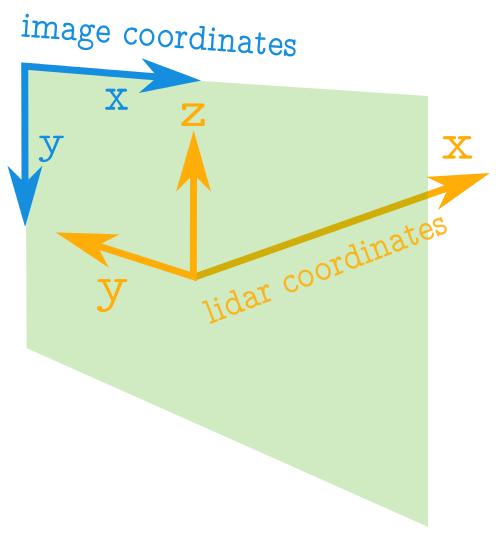
正视图坐标对应关系
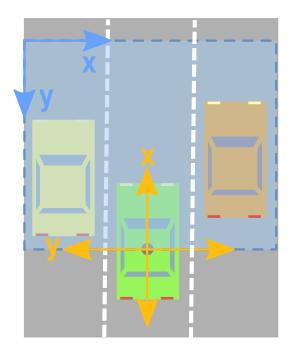
正视图坐标对应关系
其他投影约束
- image中的x,y轴坐标点需为整形
- image中像素的值需为整形,且介于0-255间
- image坐标的起点在左上角,与激光雷达原点间有偏移,如上图正视图坐标对应关系所示。
- 激光雷达点云的坐标可能较远而图片大小有限,需要限制投影在点云兴趣区域内,如上图正视图坐标对应关系所示。
博客原文:Ronny Restrepo
Summary
Today I worked on projecting Lidar data to 2D images. I was hoping to create "front views" and birds eye views of the lidar data, unforunately I was only able to work on "front view" and did not get round to working on the other.
"Front View" projection
In order to flatten the "front view" of a lidar sensor to a 2D image we have to project the points in 3D space into cylindrical surface that can be unwrapped, to a flat surface. The following code, adapted from a formula I found in the Li et al. 2016 paper does the job.
# h_res = horizontal resolution of the lidar sensor
# v_res = vertical resolution of the lidar sensor
x_img = arctan2(y_lidar, x_lidar)/ h_res
y_img = np.arctan2(z_lidar, np.sqrt(x_lidar**2 + y_lidar**2))/ v_res
The problem is that doing it this way places the seam of the image directly to the right of the car. It makes more sense to have the seam positioned at the very rear of the car, so that the more important regions to the front and side are uninterupted. Having those important regions uninterupted will make it easier for convolutional neural networks to recognize whole objects in those important regions. The following code fixes that.
# h_res = horizontal resolution of the lidar sensor
# v_res = vertical resolution of the lidar sensor
x_img = np.arctan2(-y_lidar, x_lidar)/ h_res # seam in the back
y_img = np.arctan2(z_lidar, np.sqrt(x_lidar**2 + y_lidar**2))/ v_res
Configuring the scale along each axis
The h_res and v_res varaibels are very much dependent on the LIDAR sensor used. In the KTTI dataset, the sensor used was a Velodyne HDL 64E. According to the spec sheet for the Velodyne HDL 64E it has the following important characteristics:
- A vertical field of view of 26.9 degrees, at a resolution of 0.4 degree intervals. The vertical field of view is broken up into +2 degrees above the sensor, and -24.9 degrees below the sensor.
- A horizontal field of view of 360 degrees, at a resolution of 0.08 - 0.35 (depending on the rotation rate)
- Rotation rate can be selected to be betwen 5-20Hz.
This now allows us to update the code as follows:
# Resolution and Field of View of LIDAR sensor
h_res = 0.35         # horizontal resolution, assuming rate of 20Hz is used
v_res = 0.4          # vertical res
v_fov = (-24.9, 2.0) # Field of view (-ve, +ve) along vertical axis
v_fov_total = -v_fov[0] + v_fov[1]

# Convert to Radians
v_res_rad = v_res * (np.pi/180)
h_res_rad = h_res * (np.pi/180)

# Project into image coordinates
x_img = np.arctan2(-y_lidar, x_lidar)/ h_res_rad
y_img = np.arctan2(z_lidar, d_lidar)/ v_res_rad
This however results in about half the points being located along the negative x coordinate, and most in the negative y coordinate. In order to project to a 2D image we need to have the minimum values to be (0,0). So we need to shift things:
# SHIFT COORDINATES TO MAKE 0,0 THE MINIMUM
x_min = -360.0/h_res/2    # Theoretical min x value based on specs of sensor
x_img = x_img - x_min     # Shift
x_max = 360.0/h_res       # Theoretical max x value after shifting

y_min = v_fov[0]/v_res    # theoretical min y value based on specs of sensor
y_img = y_img - y_min     # Shift
y_max = v_fov_total/v_res # Theoretical max x value after shifting
y_max = y_max + 5         # UGLY: Fudge factor because the calculations based on
                          # spec sheet do not seem to match the range of angles
                          # collected by sensor in the data.
Rasterising as a 2D image
Now that we have the 3D points projected to 2D coordinate points, with a minimum value of (0,0), we can plot those points data into a 2D image.
pixel_values = -d_lidar # Use depth data to encode the value for each pixel
cmap = "jet"            # Color map to use
dpi = 100               # Image resolution
fig, ax = plt.subplots(figsize=(x_max/dpi, y_max/dpi), dpi=dpi)
ax.scatter(x_img,y_img, s=1, c=pixel_values, linewidths=0, alpha=1, cmap=cmap)
ax.set_axis_bgcolor((0, 0, 0)) # Set regions with no points to black
ax.axis('scaled')              # {equal, scaled}
ax.xaxis.set_visible(False)    # Do not draw axis tick marks
ax.yaxis.set_visible(False)    # Do not draw axis tick marks
plt.xlim([0, x_max])   # prevent drawing empty space outside of horizontal FOV
plt.ylim([0, y_max])   # prevent drawing empty space outside of vertical FOV
fig.savefig("/tmp/depth.png", dpi=dpi, bbox_inches='tight', pad_inches=0.0)
Final Product
I have put all the above code together into a convenient function.
def lidar_to_2d_front_view(points,
                           v_res,
                           h_res,
                           v_fov,
                           val="depth",
                           cmap="jet",
                           saveto=None,
                           y_fudge=0.0
                           ):
    """ Takes points in 3D space from LIDAR data and projects them to a 2D
        "front view" image, and saves that image.

    Args:
        points: (np array)
            The numpy array containing the lidar points.
            The shape should be Nx4
            - Where N is the number of points, and
            - each point is specified by 4 values (x, y, z, reflectance)
        v_res: (float)
            vertical resolution of the lidar sensor used.
        h_res: (float)
            horizontal resolution of the lidar sensor used.
        v_fov: (tuple of two floats)
            (minimum_negative_angle, max_positive_angle)
        val: (str)
            What value to use to encode the points that get plotted.
            One of {"depth", "height", "reflectance"}
        cmap: (str)
            Color map to use to color code the `val` values.
            NOTE: Must be a value accepted by matplotlib's scatter function
            Examples: "jet", "gray"
        saveto: (str or None)
            If a string is provided, it saves the image as this filename.
            If None, then it just shows the image.
        y_fudge: (float)
            A hacky fudge factor to use if the theoretical calculations of
            vertical range do not match the actual data.

            For a Velodyne HDL 64E, set this value to 5.
    """

    # DUMMY PROOFING
    assert len(v_fov) ==2, "v_fov must be list/tuple of length 2"
    assert v_fov[0] <= 0, "first element in v_fov must be 0 or negative"
    assert val in {"depth", "height", "reflectance"}, \
        'val must be one of {"depth", "height", "reflectance"}'


    x_lidar = points[:, 0]
    y_lidar = points[:, 1]
    z_lidar = points[:, 2]
    r_lidar = points[:, 3] # Reflectance
    # Distance relative to origin when looked from top
    d_lidar = np.sqrt(x_lidar ** 2 + y_lidar ** 2)
    # Absolute distance relative to origin
    # d_lidar = np.sqrt(x_lidar ** 2 + y_lidar ** 2, z_lidar ** 2)

    v_fov_total = -v_fov[0] + v_fov[1]

    # Convert to Radians
    v_res_rad = v_res * (np.pi/180)
    h_res_rad = h_res * (np.pi/180)

    # PROJECT INTO IMAGE COORDINATES
    x_img = np.arctan2(-y_lidar, x_lidar)/ h_res_rad
    y_img = np.arctan2(z_lidar, d_lidar)/ v_res_rad

    # SHIFT COORDINATES TO MAKE 0,0 THE MINIMUM
    x_min = -360.0 / h_res / 2  # Theoretical min x value based on sensor specs
    x_img -= x_min              # Shift
    x_max = 360.0 / h_res       # Theoretical max x value after shifting

    y_min = v_fov[0] / v_res    # theoretical min y value based on sensor specs
    y_img -= y_min              # Shift
    y_max = v_fov_total / v_res # Theoretical max x value after shifting

    y_max += y_fudge            # Fudge factor if the calculations based on
                                # spec sheet do not match the range of
                                # angles collected by in the data.

    # WHAT DATA TO USE TO ENCODE THE VALUE FOR EACH PIXEL
    if val == "reflectance":
        pixel_values = r_lidar
    elif val == "height":
        pixel_values = z_lidar
    else:
        pixel_values = -d_lidar

    # PLOT THE IMAGE
    cmap = "jet"            # Color map to use
    dpi = 100               # Image resolution
    fig, ax = plt.subplots(figsize=(x_max/dpi, y_max/dpi), dpi=dpi)
    ax.scatter(x_img,y_img, s=1, c=pixel_values, linewidths=0, alpha=1, cmap=cmap)
    ax.set_axis_bgcolor((0, 0, 0)) # Set regions with no points to black
    ax.axis('scaled')              # {equal, scaled}
    ax.xaxis.set_visible(False)    # Do not draw axis tick marks
    ax.yaxis.set_visible(False)    # Do not draw axis tick marks
    plt.xlim([0, x_max])   # prevent drawing empty space outside of horizontal FOV
    plt.ylim([0, y_max])   # prevent drawing empty space outside of vertical FOV

    if saveto is not None:
        fig.savefig(saveto, dpi=dpi, bbox_inches='tight', pad_inches=0.0)
    else:
        fig.show()
And here are some samples of it being used:
import matplotlib.pyplot as plt
import numpy as np

HRES = 0.35         # horizontal resolution (assuming 20Hz setting)
VRES = 0.4          # vertical res
VFOV = (-24.9, 2.0) # Field of view (-ve, +ve) along vertical axis
Y_FUDGE = 5         # y fudge factor for velodyne HDL 64E

lidar_to_2d_front_view(lidar, v_res=VRES, h_res=HRES, v_fov=VFOV, val="depth",
                       saveto="/tmp/lidar_depth.png", y_fudge=Y_FUDGE)

lidar_to_2d_front_view(lidar, v_res=VRES, h_res=HRES, v_fov=VFOV, val="height",
                       saveto="/tmp/lidar_height.png", y_fudge=Y_FUDGE)

lidar_to_2d_front_view(lidar, v_res=VRES, h_res=HRES, v_fov=VFOV,
                       val="reflectance", saveto="/tmp/lidar_reflectance.png",
                       y_fudge=Y_FUDGE)
Which produces the following three images:
Depth

Height

Reflectance


 1516
1516


 被折叠的 条评论
为什么被折叠?
被折叠的 条评论
为什么被折叠?
 到【灌水乐园】发言


