import cv2
import numpy as np
from PIL import Image
from matplotlib import pyplot as plt
from scipy import signal
if __name__ == "__main__":
file = r'D:\code_color\hist_seg\2007-TIP-HistogramSegmentation-master\images\lena.png'
img = cv2.imread(file, 0)
h, w = img.shape
print(h, w)
hist, bins = np.histogram(img, 256, [0, 256])
print(hist, hist.shape, bins)
hist = hist / (h * w)
hist2 = hist.max() - hist
k_size = 3
kernel = np.ones(k_size) / k_size
kernel2 = np.array([0.1, 0.2, 0.4, 0.2, 0.1])
kernel3 = np.array([0.3, 0.4, 0.3])
hist3 = signal.correlate(hist, kernel3, mode='same')
hist3 = hist3.max() - hist3
mmax = hist2.max()
peaks2, properties2 = signal.find_peaks(hist2, distance=5, prominence=mmax / 20, width=2, plateau_size=[0, 100])
'''
distance:两个相邻peak的最小横轴距离
顶的高度:prominence:突出的程度需满足的条件(顶点一横线,向下平移,直到与更高peak的边交叉。 左右两边取更高的base)
顶的宽度:width: 一半 prominence位置处的宽度
plateau_size:允许的平顶的横轴大小范围,
'''
peaks3, properties3 = signal.find_peaks(hist3, distance=5, prominence=mmax / 20, width=2, plateau_size=[0, 100])
print('len:', len(peaks2), len(peaks3), len(properties2), len(properties3))
print(peaks2, properties2)
print(peaks3, properties3)
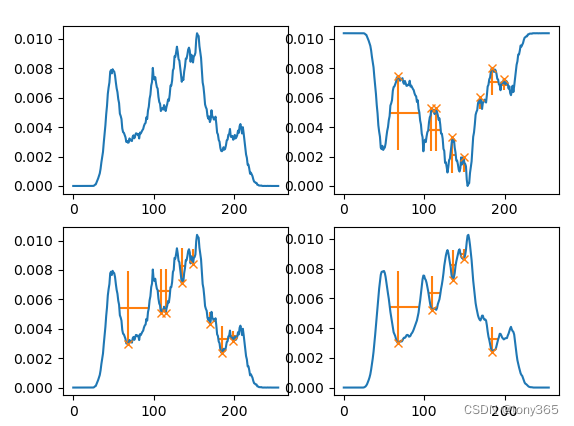
plt.figure()
plt.subplot(221)
plt.plot(hist)
hist, peaks, properties = hist2, peaks2, properties2
plt.subplot(222)
plt.plot(hist)
plt.plot(peaks, hist2[peaks], "x")
plt.vlines(x=peaks, ymin=hist[peaks] - properties["prominences"],
ymax=hist[peaks], color="C1")
plt.hlines(y=properties["width_heights"], xmin=properties["left_ips"],
xmax=properties["right_ips"], color="C1")
hist, peaks, properties = hist2, peaks2, properties2
plt.subplot(223)
plt.plot(hist.max() - hist)
hist2[peaks] = hist.max() - hist[peaks]
plt.plot(peaks, hist[peaks], "x")
plt.vlines(x=peaks, ymin=hist[peaks],
ymax=hist[peaks] + properties["prominences"], color="C1")
plt.hlines(y=hist.max()-properties["width_heights"], xmin=properties["left_ips"],
xmax=properties["right_ips"], color="C1")
hist, peaks, properties = hist3, peaks3, properties3
plt.subplot(224)
plt.plot(hist.max() - hist)
hist[peaks] = hist.max() - hist[peaks]
plt.plot(peaks, hist[peaks], "x")
plt.vlines(x=peaks, ymin=hist[peaks],
ymax=hist[peaks] + properties["prominences"], color="C1")
plt.hlines(y=hist.max()-properties["width_heights"], xmin=properties["left_ips"],
xmax=properties["right_ips"], color="C1")
plt.show()
from collections import Counter
import cv2
import numpy as np
from matplotlib import pyplot as plt
from scipy import signal
from skimage import color
from skimage.segmentation import mark_boundaries
def show_hist_seg(hist, peaks,properties ):
plt.figure
plt.plot(hist.max() - hist)
hist[peaks] = hist.max() - hist[peaks]
plt.plot(peaks, hist[peaks], "x")
plt.vlines(x=peaks, ymin=hist[peaks],
ymax=hist[peaks] + properties["prominences"], color="C1")
plt.hlines(y=hist.max()-properties["width_heights"], xmin=properties["left_ips"],
xmax=properties["right_ips"], color="C1")
plt.show()
def hist_seg(img, filter=0, show_seg=1, show_im=1):
h, w = img.shape[:2]
print(h, w)
hist, bins = np.histogram(img, 256, [0, 256])
hist = hist / (h * w)
k_size = 3
kernel = np.ones(k_size) / k_size
kernel2 = np.array([0.1, 0.2, 0.4, 0.2, 0.1])
kernel3 = np.array([0.3, 0.4, 0.3])
if filter:
hist2 = signal.correlate(hist, kernel3, mode='same')
hist2 = hist2.max() - hist2
else:
hist2 = hist.max() - hist
mmax = hist2.max()
peaks, properties = signal.find_peaks(hist2, distance=1, prominence=mmax / 50, width=1, plateau_size=[0, 100])
if show_seg:
show_hist_seg(hist2, peaks, properties)
min_index = list(peaks)
min_index.append(255)
img2 = img.copy()
for k in range(len(min_index)):
if k == 0:
mask = img2 < min_index[k]
else:
mask = np.logical_and((img2 < min_index[k]), (img2 > min_index[k - 1]))
if len(img.shape) == 3:
img2[..., 0][mask[..., 0]] = np.mean(img2[..., 0][mask[..., 0]])
img2[..., 1][mask[..., 1]] = np.mean(img2[..., 1][mask[..., 1]])
img2[..., 2][mask[..., 2]] = np.mean(img2[..., 2][mask[..., 2]])
if len(img.shape) == 2:
img2[mask] = np.mean(img2[mask])
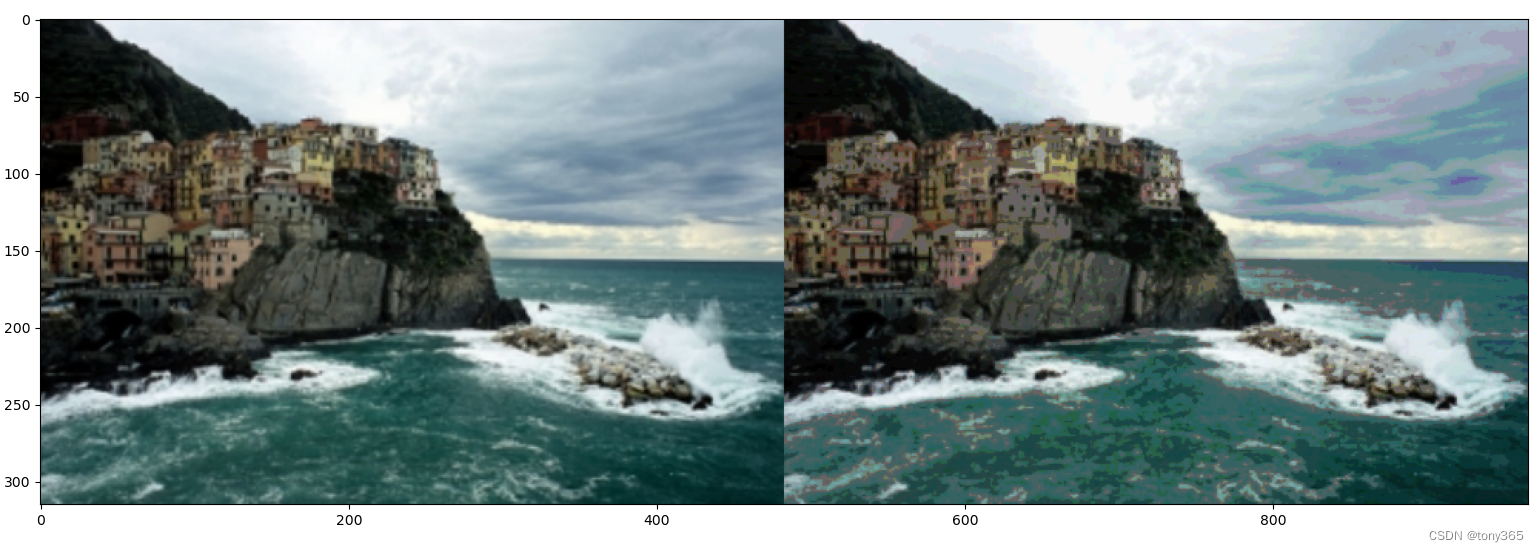
if show_im:
plt.figure()
plt.imshow(np.hstack((img, img2)))
plt.show()
return peaks, img2
def superpixel_segmentation_hist(image, segments):
"""
Segment an image into an approximative number of superpixels.
inputs:
-image: a numpy array to be segmented
-num_segments: the number of of desired segments in the segmentation
returns:
- the number of segments after superpixel segmentation
- the content of each cluster (center coordinates, mean of color)
"""
clusters = np.zeros((len(np.unique(segments)), 5))
superpixels = color.label2rgb(segments, image, kind='avg')
print(len(clusters), np.unique(segments))
for c in np.unique(segments):
indexes = np.where(segments == c)
mean_color = superpixels[indexes[0][0], indexes[1][
0]]
mean_indexes = np.array([int(np.round(np.mean(indexes[0]))), int(np.round(np.mean(indexes[1])))])
print(c, mean_indexes, mean_color)
clusters[c] = np.concatenate((mean_indexes, mean_color), axis=None)
return segments, clusters, superpixels
def seg_im(image, segments, clusters, superpixels ):
plt.figure()
plt.subplot(221)
plt.imshow(segments)
plt.subplot(222)
plt.imshow(np.clip(superpixels,0,255).astype(np.uint8))
plt.subplot(223)
plt.imshow(mark_boundaries(image, segments))
plt.show()
return segments, clusters, superpixels
if __name__ == "__main__":
file = r'D:\code_color\hist_seg\2007-TIP-HistogramSegmentation-master\images\aa.png'
img = cv2.imread(file)[..., ::-1]
'''
1. 输入彩色图,对彩色图处理hist分段,各通道分段求均值
'''
peaks, img2 = hist_seg(img, filter=0)
h, w, c = img.shape
r = img[..., 0]
g = img[..., 1]
b = img[..., 2]
'''
2. 输入单通道,对单通道处理hist分段,各通道分段求均值
'''
min_index_r, r2 = hist_seg(r)
min_index_g, g2 = hist_seg(g)
min_index_b, b2 = hist_seg(b)
out = cv2.merge([r2, g2, b2])
plt.figure()
plt.imshow((np.hstack((img, out))))
plt.title("split , hist seg, merge")
plt.show()
'''
3. 输入单通道,对单通道处理hist分段,各通道的所有分段融合,各通道分段求均值(不太合理,应为可能重合或者靠的很近)
'''
min_index = list(min_index_r) + list(min_index_g) + list(min_index_b)
min_index2 = []
for x in min_index:
if x not in min_index2:
min_index2.append(x)
min_index = sorted(min_index2)
print('final min index :', min_index)
min_index.append(255)
img2 = img.copy()
for k in range(len(min_index)):
if k == 0:
mask = img2 < min_index[k]
else:
mask = np.logical_and((img2 < min_index[k]), (img2 > min_index[k - 1]))
img2[..., 0][mask[..., 0]] = np.mean(img2[..., 0][mask[..., 0]])
img2[..., 1][mask[..., 1]] = np.mean(img2[..., 1][mask[..., 1]])
img2[..., 2][mask[..., 2]] = np.mean(img2[..., 2][mask[..., 2]])
plt.figure()
plt.imshow(np.hstack((img, img2)))
plt.title(' merge rgb hist seg index')
plt.show()
'''
4. 输入灰度图,对灰度图处理hist分段,利用灰度图的hist分段,各通道求均值
'''
gray = np.mean(img, axis=2)
index, gray2 = hist_seg(gray, filter=0)
min_index = sorted(index)
print('final min index :', min_index)
min_index.append(255)
img2 = img.copy()
for k in range(len(min_index)):
if k == 0:
mask = img2 < min_index[k]
else:
mask = np.logical_and((img2 < min_index[k]), (img2 > min_index[k - 1]))
img2[..., 0][mask[..., 0]] = np.mean(img2[..., 0][mask[..., 0]])
img2[..., 1][mask[..., 1]] = np.mean(img2[..., 1][mask[..., 1]])
img2[..., 2][mask[..., 2]] = np.mean(img2[..., 2][mask[..., 2]])
plt.figure()
plt.imshow(np.hstack((img, img2)))
plt.title(' use gray hist seg')
plt.show()


 该代码实现了一种图像处理方法,通过对图像的直方图进行分析,找到峰值并进行滤波处理,然后进行分段。分段后,计算各段的平均颜色并将像素映射到这些平均颜色上,实现了图像的色彩分段。此外,还提供了超级像素分割的功能。


 被折叠的 条评论
为什么被折叠?
被折叠的 条评论
为什么被折叠?
 到【灌水乐园】发言


