


最佳线性无偏估计
When visiting an e-commerce site, people have come to expect to know the day and, if possible, the time their purchased items will arrive for delivery. This estimated time of arrival (ETA), which is generally promised to the customer at the time of making a purchase, makes a huge difference in the brand-customer relationship, which is the new currency in the system. At 1mg, India’s most trusted consumer health platform, we process a large number of pharmacy orders, lab test requests and doctor consultation chats every day and for each order, our aim remains to set the right expectations on the delivery time to reduce anxiety and ensuring a delightful order fulfilment experience to the customer.
当访问电子商务站点时,人们开始期望知道购买的日期和时间(如果可能的话)。 通常在购买时向客户承诺的预计到达时间(ETA),对品牌-客户关系(系统中的新货币)产生了巨大的影响。 1mg是印度最受信任的消费者健康平台,我们每天处理大量药房订单,实验室测试请求和医生咨询聊天,并且对于每笔订单,我们的目标仍然是对交付时间设定正确的期望,以减少焦虑并确保给客户带来愉快的订单履行经验。
挑战: (The Challenge:)
An ETA is an estimate for the actual turn-around time for an order. It drives the first impression of the efficiency of order-fulfilment in a company. There are many challenges in predicting a reasonable TAT for an order:
ETA是订单实际周转时间的估算值。 它给公司带来订单执行效率的第一印象。 预测订单的合理TAT有许多挑战:
- First and foremost is knowing what you have in store and what/how much you need to procure to fulfil the majority of orders without suffering from overstocking/understocking. Predicting the TAT for this procurement process followed by packaging of the order is an important portion of the complete TAT prediction. 首先,最重要的是要知道您的店面中有什么以及需要多少才能满足大多数订单而又不会遭受库存过多/库存不足的困扰。 预测此采购流程的TAT,然后打包订单是完整TAT预测的重要部分。
- Second is having a well-oiled operations and logistics unit. However, India is a vast geographical unit and when one is promising to deliver in any nook and corner of the country, they have to deal with a huge variance in the availability of facilities and services. Also, the variable operational efficiency of the warehouses and logistics unit during different times of the year (festivals/heavy rains/pandemic) lead to massive uncertainty in the estimation of the accurate arrival time for every order. 其次是拥有运转良好的运营和物流部门。 但是,印度是一个巨大的地理区域,当一个国家承诺在该国的任何角落和角落提供服务时,它们都必须应对设施和服务可用性方面的巨大差异。 同样,在一年中的不同时间(节日/大雨/大流行),仓库和物流部门的可变运营效率导致在估计每个订单的准确到达时间时存在巨大的不确定性。
旅程: (The Journey:)
To take the first crack at predicting ETA for an order, we started out implementing a heuristical model which took into account:
为了在预测订单的预计到达时间时第一个突破,我们开始实施启发式模型,该模型考虑了以下因素:
- The displacement between the vendor and the customer city 供应商和客户城市之间的位移
- The geographical state in which the delivery address lies 收货地址所在的地理位置
- The promised SLAs by the logistics partner and 物流合作伙伴承诺的SLA和
- Whether the order started getting packed before or after daybreak (2 PM). 订单是否在黎明之前(下午2点)开始打包。
Using a bunch of conditions on these variables, we decided to communicate a range of days as the ETA for a customer’s order. To further reduce the chances of an ETA getting breached, 1–2 days were added to make the ETA lean more on the safer side. Our ETAs were not great, but never-the-less our breach was less than 5% which was satisfactory for us.
通过在这些变量上使用一堆条件,我们决定传达几天的时间作为客户订单的预计到达时间。 为了进一步减少违反ETA的机会,增加了1-2天以使ETA更安全。 我们的预计到达时间不是很好,但我们的违约率不到5%,这对我们来说是令人满意的。
Over the last few years, major overhauls were made in getting a live inventory tracking system, better order processing and packaging flow, improvements in the logistics which led to better turn-around times for order deliveries. However, we did not change much in the way we were estimating our actual TAT. On analysing the situation, we found that close to 70% of our orders were getting delivered before or on the first date of the ETA range that was communicated, making our ETA prediction heuristics extremely conservative. In a lot of cases, we were delivering even two days before the promised date. No doubt, we had a high rate of order cancellation within the first hour of order placement, that is, as soon as the user sees the ETA.
在过去的几年中,对重大改进进行了改进,获得了实时库存跟踪系统,更好的订单处理和包装流程,物流方面的改进,从而缩短了订单交付的周转时间。 但是,我们在估算实际TAT的方式上并没有太大变化。 在分析情况时,我们发现有将近70%的订单是在所传达的ETA范围的第一天之前或之初交付的 ,这使得我们的ETA预测启发式方法极为保守。 在很多情况下,我们甚至在约定的日期之前两天就交付了产品。 毫无疑问,在下订单的第一个小时内,即用户看到ETA之后,我们的订单取消率很高 。
Simply reducing a couple of days from the predicted ETA was the first obvious solution that came to our mind for tackling the problem of high order cancellation percentage. But we knew that would lead to a much higher breach percentage than we would afford. This is because a customer with an order which reaches him delayed is extremely unhappy and rarely shies away from giving us a bad performance rating or cancelling the order. Bad rating leads to a poor Net Promoter Score (NPS), something that a rapidly growing company like ours is really protective of. Also, an unhappy customer is the last thing we want at 1mg.
简单地将预计的预计到达时间减少几天,是我们想到的第一个明显的解决方案,用于解决高订单取消率问题。 但是我们知道,这将导致超出我们所能承受的百分比的漏洞。 这是因为订单延迟到达的客户非常不满意,并且很少回避给我们不好的性能等级或取消订单。 差评会导致净促销员评分(NPS)下降,像我们这样的快速成长的公司确实可以保护这一点。 另外,不满意的顾客是我们1mg想要的最后一件事。
To explicate and solve this issue, we went to the drawing board to list down the multiple KPIs or metrics that the business associated with the communicated ETA:
为了说明和解决此问题,我们去了绘图板,列出了与所传达的ETA相关的业务的多个KPI或度量:
基于对基于规则的ETA进行分析的主要观察结果: (Key observations based on analyzing the Rule-based ETA:)
{Assume T0 is order placement time, ‘X’ is the start date of potential delivery, ‘Y’ is the end date of potential delivery and the first ETA communicated to the customer after order placement is “X to Y”. The bucket size of the ETA i.e. Y - X is 2 days.}
{假设T0是下订单时间,“ X”是潜在交货的开始日期,“ Y”是潜在交货的结束日期,并且下订单后传达给客户的第一个ETA是“ X到Y ”。 ETA的存储桶大小,即Y-X为2天。}
- Breaching the ETA has a very negative effect on the customer feedback as well as order cancellations. NPS becomes negative in such cases and almost half of the orders that get their ETA breached, get cancelled. 违反ETA会对客户反馈以及订单取消产生非常不利的影响。 在这种情况下,NPS变为负数,几乎一半违反其ETA的订单都被取消。
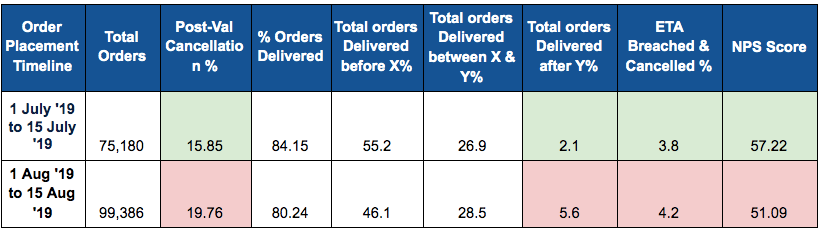
Higher “Total orders delivered after Y %” and “ETA Breached & Cancelled %” in the above metric table for the Timeline “1st Aug’19 to 15th Aug’19” result in lower “NPS Score” and higher “Post-Val Cancellation %” as compared to the other timeline.
在上述指标表中,时间轴“ 19年8月1日至19年8月15日 ”中较高的“ 在Y%之后交付的总订单”和“超出ETA并取消了% ”的结果是,较低的“ NPS得分 ”和较高的“验证后取消” % ”与其他时间轴相比。
- For all ETA buckets, delivering within the ETA bucket leads to lower NPS than communicating a longer ETA and delivering before the ETA. For e.g., when we communicated ETA between 2 to 3 days and delivered within the ETA, we got an average NPS score “41”. However, when we communicated ETA between 3 to 4 days and delivered before the ETA, we got NPS “50.0”. 对于所有ETA桶,与在ETA之前传递较长的ETA和进行传递相比,在ETA桶中进行传送会导致NPS降低。 例如,当我们在2到3天之间传达ETA并在ETA内交付时,我们的NPS平均得分为“ 41”。 但是,当我们在3到4天之间传达ETA并在ETA之前交付时,我们的NPS为“ 50.0”。

High “Total orders delivered before X %” with less “Total orders delivered after Y %“ and “ETA Breached & Cancelled %” leads to the best NPS Score and low “Post-Val Cancellation %”
高的“ 在X%之前交付的总订单 ”与较少的“ 在Y%以后交付的总订单 ”和“ 超出 ETA 且已取消的% ”会导致最佳NPS得分,而较低的“验证后取消百分比 ”
- Being very conservative with our ETA predictions (non-competitive ETA) leads to HIGH order cancellation by the customer as soon as he/she is communicated the ETA. 对我们的ETA预测非常保守(非竞争性ETA)会导致客户在收到ETA通知后立即取消高额订单。
The above analysis helped us in fixing the goal post for our ETA model. Ideally, we wanted our ETA model to achieve the following :
上述分析有助于我们为ETA模型确定目标职位。 理想情况下,我们希望我们的ETA模型能够实现以下目标:
Low TAT breach- which means our model predicts “Y” in a way to minimize orders falling beyond “Y” (<5% say).
低TAT违约率-这意味着我们的模型以最小化超过“ Y ”(低于5%)的订单的方式预测“ Y ”。
Remaining 95% orders which are delivered “before X” or “between X & Y” should follow a distribution which should minimize cancellations and maximize NPS.
在“ X之前 ”或“ X和Y之间 ”交付的其余95%的订单应遵循分配,以最大程度地减少取消并提高NPS。
建议的解决方案: (The Proposed Solution:)
We propose that the communicated ETA to a user for their order should be calculated using out of two prediction systems. The first system should be responsible for accurately predicting the actual TAT for an order while the second system should use the predicted TAT to assess the best range of ETA that would meet the multiple business objectives.
我们建议应使用两个预测系统中的一个来计算与用户的订单通信的预计到达时间。 第一个系统应负责准确预测订单的实际TAT ,而第二个系统应使用预测的TAT评估可以满足多个业务目标的最佳ETA范围 。
Following attempts were made in lines to solve the first portion of the problem i.e. “Predicting TAT accurately”.
为了解决问题的第一部分,进行了以下尝试,即“准确预测TAT”。
Predicting actual TAT piece by piece:
逐项预测实际TAT:
Following is the Pharmacy order flow diagram from order placement until the first ETA communication:
以下是从下单到首次ETA通讯的药房订单流程图:

To accurately predict the ETA, we needed to be precise with the following calculations at the backend:
为了准确预测ETA,我们需要在后端进行以下精确计算:
Estimated order packaging time: Varies according to the availability of SKUs in the in-hand inventory, the number of items ordered and how busy the vendor is at the time of receiving the order.
估计的订单包装时间:根据现有库存中SKU的可用性,所订购的物品数量以及接收订单时供应商的繁忙程度而有所不同。
Delivery pickup time: The wait-time between the order getting packed and shipped for delivery.
交货提货时间:订单打包和发货之间的等待时间。
Shipment time: Depends on the customer’s and vendor’s location/city, the delivery partner serving that order, the shipment picked time/day etc.
发货时间:取决于客户和供应商的位置/城市,服务于该订单的交付合作伙伴,发货的提货时间/天等。
We started with predicting ETA for the orders catered by our 3rd-party logistic partners as:
我们首先要预测第三方物流合作伙伴提供的订单的预计到达时间为:
- These orders constitute ~65% of the total orders fulfilled by 1mg. 这些订单约占1mg订单总数的65%。
- These orders can be delivered inter-state as well as intra-state giving us a huge variance in the delivery TAT and an urgent need to replace the rule-based system due to its incapability to incorporate such complex variability in the order-related features. 这些订单既可以在州内也可以在州内交付,这给我们交付的TAT带来了巨大差异,并且由于无法将这种复杂的可变性纳入与订单相关的功能中,因此迫切需要替换基于规则的系统。
We built a separate model for predicting each of these above-mentioned portions of TAT and the ETA communicated to the user was the overall sum of these 3 delays.
我们建立了一个单独的模型来预测TAT的上述每个部分,与用户通信的ETA是这3个延迟的总和。
The TAT prediction method for each of the process queue was as follows:
每个流程队列的TAT预测方法如下:
Packaging Queue: Predicted as the 70th percentile of the packaging time a vendor took to pack an SKU in the same inventory scenario(in stock/oos) each time in the last 3 weeks.
包装队列 :预测为最近3周中,卖方在相同的库存情况下(以库存/单位)包装SKU所花费的包装时间的70%。
Shipping Queue: The wait-time between the order getting packed and shipped for delivery. (A static table consisting of the daily pickup slots committed by the delivery partner to the vendor was used to predict this TAT)
发货队列 :打包和发货订单之间的等待时间。 (使用静态表(由交付伙伴向卖方承诺的每日提货位组成)来预测此TAT)
Manage Delivery Queue: A gradient boosting model that took into account the geographical features related to the customer and vendor’s location, features related to the order dispatched time and properties of the delivery partner fulfilling the order was used to predict the delivery time.
管理交付队列 :使用梯度提升模型,该模型考虑了与客户和供应商位置有关的地理特征,与订单分派时间有关的特征以及履行订单的交付合作伙伴的属性,以预测交付时间。
Retraining frequency: This model was retrained once in every 3 weeks on the most recent delivery data gathered.
再培训频率:该模型每3周接受一次最新的交付数据再培训一次。
Performance Comparison with the Rule-Based Model:
与基于规则的模型的性能比较:
We deployed the DS model in production in parallel to the RB model to check its accuracy and performance on the Order Cancellation percentage. This model helped us achieve ~1.4% reduced Post-Val cancellations and 16% better accuracy in our communicated ETAs as compared to the Rule-based model with a ~5% increase in ETA breach, which was overall a huge win for us.
我们将DS模型与RB模型并行部署在生产中,以检查其取消订单百分比的准确性和性能。 与基于规则的模型相比,此模型帮助我们实现了沟通后的ETA减少了约1.4%的后Val取消,并且准确性提高了16% ,而ETA违规增加了5% ,这总体上对我们来说是一个巨大的胜利。
The ETA metrics comparing both the models for the orders placed and delivered between 1st March 2020 and 15th March 2020 can be seen below:
ETA指标比较了2020年3月1日至2020年3月15日之间下达和交付的订单的两种模型:

We were also able to establish the statistical significance of the reduced Post-Val Cancellation % in case of the DS model by running T-test over the daily cancellation rates of both the models.
在DS模型的情况下,我们还可以通过对两个模型的每日取消率进行T检验来建立减少的Val取消后百分比的统计显着性。
Need for a new ETA model:
需要新的ETA模型:
- We noticed from the DS model that showing conservatively accurate ETAs serve our business purpose in the best manner. 我们从DS模型中注意到,显示保守准确的ETA可以最佳方式达到我们的业务目的。
- Everything was working fine till we decided to start showing ETAs inspired by this conservatively accurate model on our Product Description Pages(PDP) as well. The ETA at the product pages had to be consistent with the ETA we commit to the customer after order placement. The issue at its core was we couldn’t afford to use a non-competitive ETA model at PDPs as an ETA conservative in any sense on the product page can drift the customer away due to the large expected wait time. 一切运行良好,直到我们决定在我们的产品说明页(PDP)上也开始显示受这种保守准确模型启发的ETA。 产品页面上的ETA必须与我们在下订单后向客户承诺的ETA一致。 核心问题是,我们无法在PDP上使用非竞争性的ETA模型,因为产品页面上的任何形式的ETA保守都可能因预期的等待时间长而使客户流连忘返。
- Also, we wanted to try not predicting ETA in parts but as a whole, by a single model as it was expected to not add-on to the errors committed by the previous step’s model. 另外,我们希望不通过单个模型来预测整个部分的ETA,因为预计不会附加上一步模型所犯的错误。
- Getting rid of the rules written for predicting TAT in PQ and SQ was also a motivation. 摆脱为预测PQ和SQ中的TAT而编写的规则也是一种动机。
Hence, we developed a Neural Network model that was trained on raw order features like :
因此,我们开发了一个神经网络模型,该模型经过了原始订单功能的训练,例如:
[‘order_placed_timestamp’, ‘customer_city’, ‘customer_pincode’, ‘vendor_id’, ‘vendor_code’, ‘vendor_city’, ‘vendor_pincode’, ‘delivery_partners_code’, ‘delivery_partner_type’, ‘no_of_unique_skus’, ‘rx_count’, ‘otc_count’, ‘order_type’, ‘packaging_timestamp’, ‘customer_latitude’, ‘customer_longitude’, ‘vendor_location’, ‘sku_eta’, ‘parallel_orders’, ‘is_fulfilled_by_inventory’, ‘order_placed_weekday’, ‘order_placed_hour’, ‘order_placed_2pm’, ‘vendor_latitude’, ‘vendor_longitude’, ‘distance’]
['order_placed_timestamp','customer_city','customer_pincode','vendor_id','vendor_code','vendor_city','vendor_pincode','delivery_partners_code','delivery_partner_type','no_of_unique_skus','rx_count' order_type”,“ packaging_timestamp”,“ customer_latitude”,“ customer_longitude”,“ vendor_location”,“ sku_eta”,“ parallel_orders”,“ is_fulfilled_by_inventory”,“ order_placed_weekday”,“ order_placed_hour”,“ order_placed_2itude”,“ vendor_titude” ,“距离”]
In addition to the above mentioned raw features, aggregated features generated from the past month’s data of these raw-features were also fed to the NN model. Some examples of this set of features are:
除了上述原始特征外,从上个月的这些原始特征数据生成的聚合特征也被输入到NN模型中。 这套功能的一些示例如下:
- Min, max, mean, 90th percentile of the TAT for the given customer_city when the order is delivered by a particular delivery partner. 当特定交付伙伴交付订单时,给定customer_city的TAT的最小,最大,平均90%百分数。
- Min, max, mean, 90th percentile of the order_type(RX/OTC/Both) served by a particular vendor. 特定供应商提供的order_type(RX / OTC / Both)的最小值,最大值,平均值90%。
We compared the “predicted delivery date” accuracy of the very conservative Rule-based ETA model, the conservatively accurate DS Boosting Model, this new PQ Neural Net model and the blend(average of predictions) of the DS Boosting model and the new PQ Neural Net model(Mean DS and PQ). The predicted delivery TAT accuracy is for each of the models is shown below:
我们比较了非常保守的基于规则的 ETA模型,保守准确的DS Boosting模型 ,此新的PQ神经网络模型以及DS Boosting模型和新的PQ Neural的混合(预测平均值)的“预测交货日期”准确性网络模型( 均值DS和PQ )。 每个模型的预计交付TAT准确性如下所示:
Since “The Blend of the DS Boosting Model and the PQ Neural Net”(Mean DS and PQ in the above chart) was far more aggressive than the in-production Rule-Based and DS Boosting model (very few orders getting delivered “Before X-2” and “On X-2”), it could provide the Product Page ETA model with the liberty to be aggressive in its prediction (which could help increase our order conversion rate) without letting an increase in inconsistency between the two ETA models deployed on different stages in a single pipeline.
由于“ DS Boosting模型与PQ神经网络的融合”(上图中的平均DS和PQ )远比生产中基于规则的DS DSing模型更为激进(X之前交付的订单很少) -2”和“在X-2上”),它可以为产品页面ETA模型提供自由进行预测的自由(这可以帮助提高我们的订单转换率),而不会增加两个ETA模型之间的不一致部署在单个管道的不同阶段。
It also achieved high accuracy (~60% orders were predicted to be delivered within [X, Y]) while keeping a check on breach (only 5%) on the backtesting timeline and hence was serving our goal of predicting TATs accurately with less ETA breach percentage.
它还实现了较高的准确性(预计在[X,Y]内将交付约60%的订单),同时在回测时间轴上检查违规情况(仅5%) ,因此符合我们的目标,即以较少的ETA准确预测TAT违反率。
Due to the above-mentioned wins, this blended Neural Network model(Mean DS and PQ) was deployed in production and it helped us achieve the best accuracy results in comparison to the other in-production ETA models.
由于上述优势,该混合神经网络模型( 均值DS和PQ )已在生产中部署,与其他生产中的ETA模型相比,它帮助我们获得了最佳的精度结果。
结论: (Conclusion:)
In this article, we discussed the traditional approach of calculating ETA for an order and how we redefined it using our first set of ETA models. In the next article, we’ll be talking about handling unprecedented scenarios that cause sudden disruptions in the supply chain like the COVID-19 from the ETA perspective and also about predicting the optimal ETA bucket using the accurately predicted ETA bucket.
在本文中,我们讨论了为订单计算ETA的传统方法,以及如何使用第一套ETA模型重新定义它。 在下一篇文章中,我们将讨论处理史无前例的场景,这些场景从ETA的角度来看会导致供应链中的突然中断,例如COVID-19,还将讨论使用精确预测的ETA存储桶预测最佳ETA存储桶。
翻译自: https://medium.com/1mgofficial/estimating-the-optimum-estimated-time-of-arrival-b3ee71870dd6
最佳线性无偏估计


 411
411

 被折叠的 条评论
为什么被折叠?
被折叠的 条评论
为什么被折叠?
 到【灌水乐园】发言


