


Title
题目
ERV-Net: An efficient 3D residual neural network for brain tumor segmentation
ERV-Net:一种用于脑肿瘤分割的高效3D残差神经网络
01
文献速递介绍
脑肿瘤在全球范围内是致命的,与其他类型的肿瘤相比。胶质瘤是最具侵略性的脑肿瘤类型,通常分为高级别(HGG)和低级别(LGG)。胶质瘤的常见治疗方法包括放疗、化疗和手术(Tabatabai等,2010年),这些治疗方法依赖于医学影像分析。磁共振成像(MRI)是诊断胶质瘤最有用的辅助工具,因为它可以提供非侵入性成像和基于多模态图像的补充信息(Bauer,Wiest,Nolte和Reyes,2013年)。2018年多模态脑肿瘤分割挑战数据集(BRATS 2018)提供了四种不同的模态,即T1加权(T1)、T2加权(T2)、具有对比增强的T1加权(T1C)和液体衰减反转恢复(FLAIR)。对胶质瘤的精确分割不仅对准确评估至关重要,而且对治疗计划也很重要。然而,手动分割是一个复杂的项目,因为不同的医师在培训过程中可能具有不同的标准,因此会受到不确定误差的影响(Nyúl,Udupa和Zhang,2000年)。特别是,将其分割成类间和类内是一项极其艰巨和具有挑战性的任务。由于胶质瘤的类内具有可变的形状、位置和规律性(Pereira,Pinto,Alves和Silva,2016),即使是专家也很难识别。而且,肿瘤通常被健康的脑组织包围,例如脑脊液、灰质、白质(Havaei等,2017),导致模糊的肿瘤边界。此外,由于不同协议、设备和患者导致的噪声和强度不均匀性等伪影(Tustison等,2010年),也增加了分割的难度。
Abstract
摘要
Brain tumors are the most aggressive and mortal cancers, which lead to short life expectancy. A reliable and efficient automatic or semi-automatic segmentation method is significant for clinical practice. In recent years, deep learning-based methods achieve great success in brain tumor segmentation. However, due to the limitation of parameters and computational complexity, there is still much room for improvement in these methods. In this paper, we propose an efficient 3D residual neural network (ERV-Net) for brain tumor segmentation, which has less computational complexity and GPU memory consumption. In ERV-Net, a computation-efficient network, 3D ShuffleNetV2, is firstly utilized as encoder to reduce GPU memory and improve the efficiency of ERV-Net, and then the decoder with residual blocks (Res-decoder) is introduced to avoid degradation. Furthermore, a fusion loss function, which is composed of Dice loss and Cross-entropy loss, is developed to solve the problems of network convergence and data imbalance. Moreover, a concise and effective post-processing method is proposed to refine the coarse segmentation result of ERV-Net. The experimental results on the dataset of multimodal brain tumor segmentation challenge 2018 (BRATS 2018) demonstrate that ERV-Net achieves the best performance with Dice of 81.8%, 91.21% and 86.62% and Hausdorff distance of 2.70 mm, 3.88 mm and 6.79 mm for enhancing tumor, whole tumor and tumor core, respectively. Besides, ERV-Net also achieves high efficiency compared to the state-of-the-art methods.
脑肿瘤是最具侵略性和致命性的癌症之一,导致患者预期寿命较短。对于临床实践而言,一种可靠高效的自动或半自动分割方法至关重要。近年来,基于深度学习的方法在脑肿瘤分割方面取得了巨大成功。然而,由于参数和计算复杂性的限制,这些方法仍有很大的改进空间。本文提出了一种用于脑肿瘤分割的高效3D残差神经网络(ERV-Net),具有较低的计算复杂性和GPU内存消耗。在ERV-Net中,首先利用了计算高效的网络3D ShuffleNetV2作为编码器,以减少GPU内存并提高ERV-Net的效率,然后引入了具有残差块(Res-decoder)的解码器以避免性能退化。此外,还开发了一个融合损失函数,由Dice损失和交叉熵损失组成,以解决网络收敛和数据不平衡的问题。此外,还提出了一种简洁有效的后处理方法,以完善ERV-Net的粗分割结果。对2018年多模态脑肿瘤分割挑战数据集(BRATS 2018)的实验结果表明,ERV-Net在增强性肿瘤、全肿瘤和肿瘤核心方面分别达到了81.8%、91.21%和86.62%的Dice系数以及2.70 mm、3.88 mm和6.79 mm的Hausdorff距离,性能最佳。此外,与最先进的方法相比,ERV-Net也实现了高效率。
Method
方法
Fig. 1 shows the overview of the proposed method. Pre-processing and data augmentation techniques are firstly applied to the patches during the training. Secondly, ERV-Net, an efficient residual neural network, is introduced for brain tumor segmentation. Then, we propose a fusion loss function by combining a Dice loss and a Cross-entropy loss to keep training stable and reduce the impact of imbalanced data. Finally, a concise and effective post-processing method is proposed to further refine the segmentation result of ERV-Net.
图1 展示了提出方法的概述。在训练过程中,首先对补丁进行预处理和数据增强技术。其次,引入了ERV-Net,一种高效的残差神经网络,用于脑肿瘤分割。然后,我们提出了一个融合损失函数,将Dice损失和交叉熵损失相结合,以保持训练稳定并减少数据不平衡的影响。最后,提出了一种简洁有效的后处理方法,进一步改进ERV-Net的分割结果。
Conclusion
结论
In this paper, we proposed an efficient 3D residual neural network, i. e., ERV-Net for brain tumor segmentation. In order to obtain high performance and efficiency, we firstly utilized a very deep neural network with lightweight as the encoder of ERV-Net, which acquired a large receptive field and reduced the number of parameters. We verified the validity of our idea by comparing the performance and efficiency of the proposed method with three different encoders. Secondly, since the encoder-decoder architecture with a large number of convolutional layers was prone to get degradation, we presented a shallow decoder with residual blocks to alleviate the problem of degradation. The results demonstrated that the decoder with residual blocks outperformed the decoder without residual blocks. In addition, we proposed a fusion loss function by combing the advantages of Cross-entropy and Dice. We found that only using Cross-entropy or Dice as a loss function would lead to poor performance caused by imbalanced data or convergence issues. In particular, we proposed a novel post-processing method that taken full advantages of the probability of neural network and the distribution characteristics of brain tumors, which effectively improved our segmentation performance. Moreover, we compared the proposed method with the state-of-the-art approaches on the BRATS 2018 challenge. The results demonstrated that ERV-Net not only achieved the best performance, but also has the lowest computational complexity. From the comparison, we can find that although ERV-Net has the best efficiency, there is still room for improvement in decoder, since we do not consider the lightweight of decoder. In the future, we will continue to reduce the number of network parameters by applying lightweight technique in decoder. Besides, we will increase the layers of ERV-Net to obtain bigger receptive field, which aims to further improve the performance of ERV-Net. We will also try to replicate our model on the open-source deep learning platform paddle.
本文提出了一种高效的3D残差神经网络,即ERV-Net,用于脑肿瘤分割。为了获得高性能和高效率,我们首先利用了一个非常深的神经网络作为ERV-Net的编码器,该编码器具有轻量级特性,可以获取大的感受野并减少参数数量。我们通过将所提出的方法与三种不同的编码器进行性能和效率比较来验证我们的想法的有效性。其次,由于具有大量卷积层的编码器-解码器结构容易出现退化问题,我们提出了一个浅的残差块解码器来缓解退化问题。结果表明,具有残差块的解码器优于没有残差块的解码器。此外,我们提出了一个融合损失函数,结合了交叉熵和Dice的优点。我们发现,仅使用交叉熵或Dice作为损失函数会导致由于数据不平衡或收敛问题而导致性能较差。特别是,我们提出了一种新颖的后处理方法,充分利用了神经网络的概率和脑肿瘤的分布特性,有效提高了我们的分割性能。此外,我们将所提出的方法与BRATS 2018挑战中的最先进方法进行了比较。结果表明,ERV-Net不仅实现了最佳性能,而且具有最低的计算复杂度。
从比较中可以发现,虽然ERV-Net具有最佳的效率,但在解码器方面仍有改进的空间,因为我们并未考虑解码器的轻量级。在未来,我们将继续通过在解码器中应用轻量级技术来减少网络参数的数量。此外,我们将增加ERV-Net的层数,以获得更大的感受野,从而进一步提高ERV-Net的性能。我们还将尝试在开源深度学习平台Paddle上复现我们的模型。
Results
结果
5.1. Performance comparison
5.1.1. Performance comparison with the state-of-the-art methods withoutmodel ensemble
Because ShuffleNetV2 + Resdecoder (ERV-Net) is an efficient architecture, we mainly compare the result of our model with those of the BRATS 2018 challenge top performances without model ensemble. Table 1 illustrates the comparison results, where Myronenko (2018), Isensee et al. (2018), and Zhou et al. (2019) are the top participants of the BRATS 2018 challenge and only the results without model ensemble are listed here. For comparison, we also include the results of Xu, Xie, Liu, Cheng, Niu, and Zhang (2019), Hu, Liu, Wen, and Niu (2018), Carver (2018), and Islam (2018). From Table 1, we can find that ERVNet almost outperforms all state-of-the-art methods on all metrics except that Hausdorff distance is slightly lower than those of Zhou et al.
5.1. 性能比较
5.1.1. 与最先进方法在无模型集成情况下的性能比较
由于ShuffleNetV2 + Resdecoder(ERV-Net)是一种高效的架构,我们主要将我们模型的结果与BRATS 2018挑战中的顶尖表现进行比较,但不包括模型集成。表1展示了比较结果,其中Myronenko(2018年)、Isensee等人(2018年)和Zhou等人(2019年)是BRATS 2018挑战的顶级参与者,这里仅列出了未进行模型集成的结果。为了比较,我们还包括了Xu、Xie、Liu、Cheng、Niu和Zhang(2019年)、Hu、Liu、Wen和Niu(2018年)、Carver(2018年)和Islam(2018年)的结果。从表1中可以看出,ERV-Net在所有指标上几乎都优于所有最先进方法,除了Hausdorff距离略低于Zhou等人的结果。
Figure
图
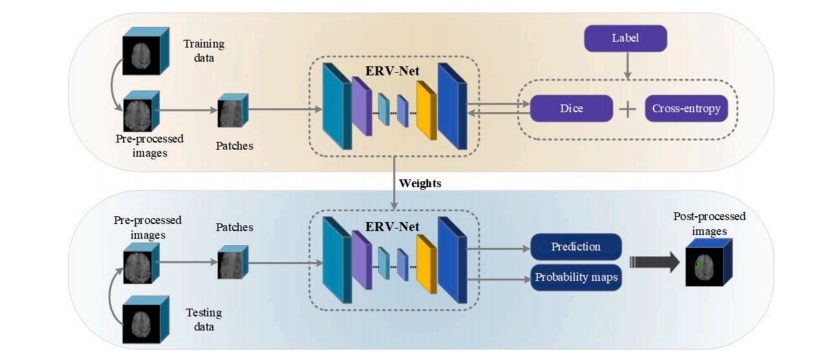
Fig. 1. Overview of the proposed method.
图1. 提出方法的概述。
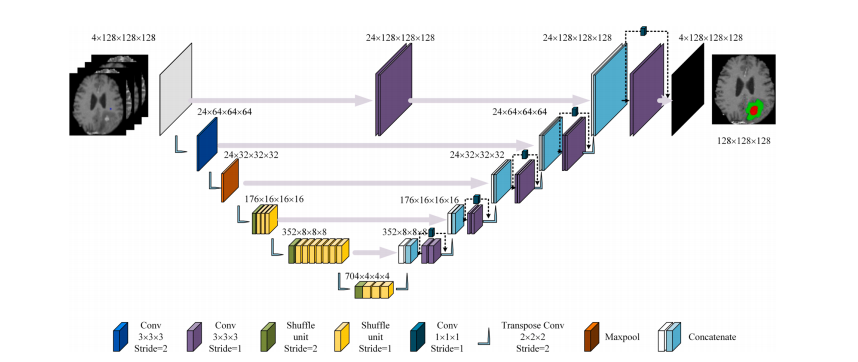
Fig. 2. The proposed ERV-Net architecture. Feature map dimensionality is noted next to the convolutional blocks, which represents the size of a block.
图2. 提出的ERV-Net架构。卷积块旁边标注了特征图的维度,表示一个块的大小。

Fig. 3. Shuffle unit.
图3. 混洗单元。
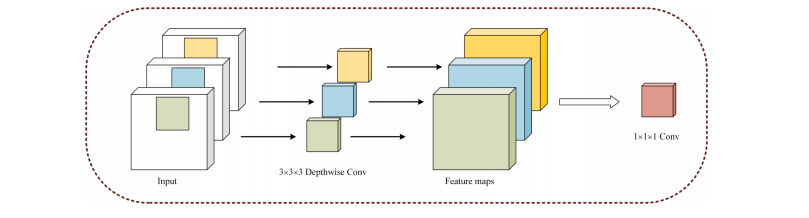
Fig. 4. Depthwise separable convolutions.
图4. 深度可分离卷积。
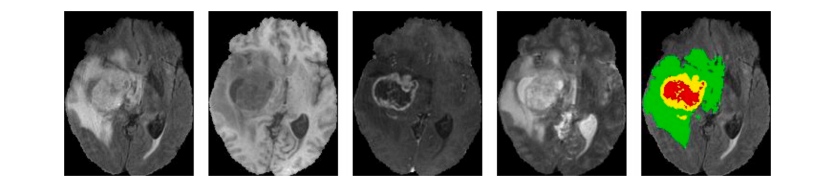
Fig. 5. Visualization of the example from the BRATS 2018 dataset. Four different modalities, i.e., Flair, T1, T1C and T2, are shown from left to right. The fifth image is ground truth. Colors represent different tumors, i.e., green, yellow and red represent edema, enhancing tumor and necrotic and non-enhancing tumor core, respectively.
图5. BRATS 2018数据集示例的可视化。从左到右显示了四种不同的模态,即FLAIR、T1、T1C和T2。第五张图是地面真实数据。颜色代表不同的肿瘤,即绿色、黄色和红色分别代表水肿、增强肿瘤和坏死性和非增强性肿瘤核心。
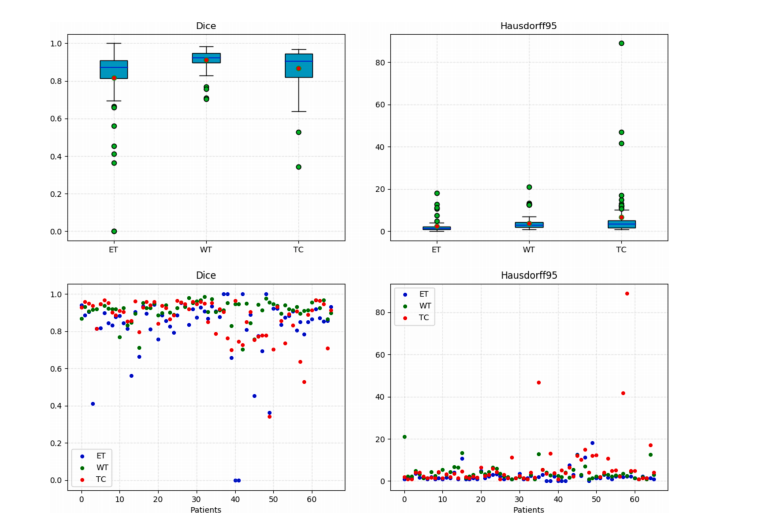
Fig. 6. Boxplots and scatter diagram of the results on the BRATS 2018 validation dataset obtained by ERV-Net.
图6. ERV-Net在BRATS 2018验证数据集上结果的箱线图和散点图。
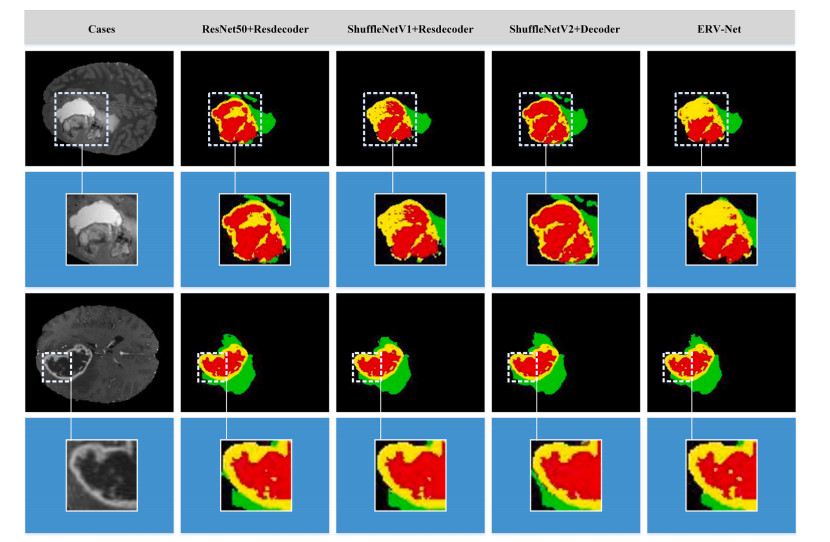
Fig. 7. Visualization of segmentation results on the BRATS 2018 validation dataset. The first and third rows represent the different cases respectively, and the second and fourth rows show the enlarged images of the details. The first column shows the original images. The 2–4 columns show segmentations of the different network architectures from left to right. Colors represent different tumors, i.e., green, yellow and red represent edema, enhancing tumor, and necrotic and non-enhancing tumor core, respectively.
图7. 在BRATS 2018验证数据集上的分割结果可视化。第一和第三行分别表示不同的案例,第二和第四行显示细节的放大图像。第一列显示原始图像。第2到4列从左到右显示不同网络架构的分割结果。颜色代表不同的肿瘤,即绿色、黄色和红色分别代表水肿、增强肿瘤和坏死性和非增强性肿瘤核心。
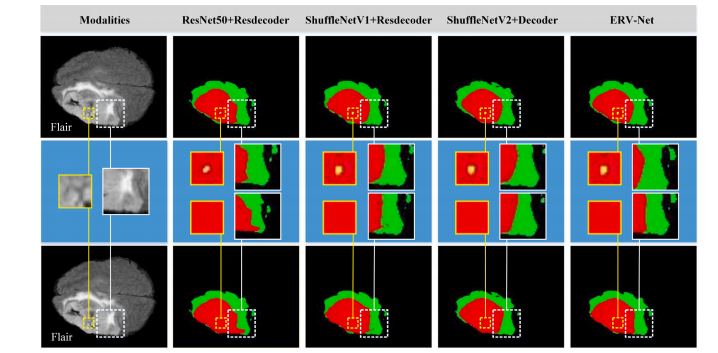
Fig. 8. The first column shows the original image of Flair. The first and third rows show the visualization of the segmentation results with and without postprocessing on case Brats18_TCIA13_646_1 of the BRATS 2018 validation dataset. The second row shows enlarged images of details with and without postprocessing. Segmentation results of different network architectures are shown from left to right. Colors represent different tumors, i.e., green, yellow and red represent edema, enhancing tumor and necrotic and non-enhancing tumor core, respectively.
Fig. 8. 第一列显示Flair的原始图像。第一行和第三行显示了在BRATS 2018验证数据集的案例Brats18_TCIA13_646_1上进行了后处理和未经后处理的分割结果的可视化。第二行显示了进行了后处理和未经后处理的细节的放大图像。不同网络架构的分割结果从左到右显示。颜色代表不同的肿瘤,即绿色、黄色和红色分别代表水肿、增强肿瘤和坏死性和非增强性肿瘤核心。
Table
表
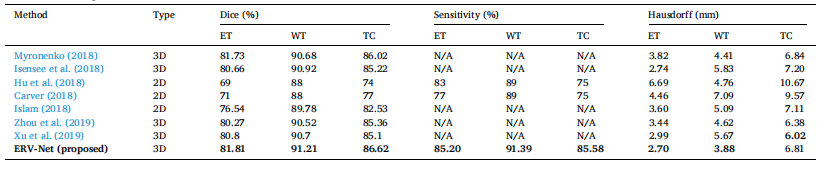
Table 1 Performance comparison with the state-of-the-art methods.
表1与最先进方法的性能比较
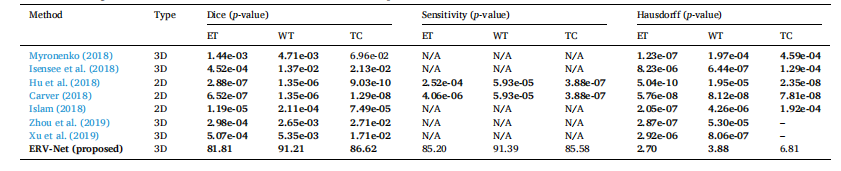
Table 2 The statistical significance validation related to Table 1. Bold denotes the p-value smaller than 0.05. – denotes the indicator is better than ERV-Net.
表2与表1相关的统计学显著性验证。粗体表示p值小于0.05。短横线表示该指标优于ERV-Net。
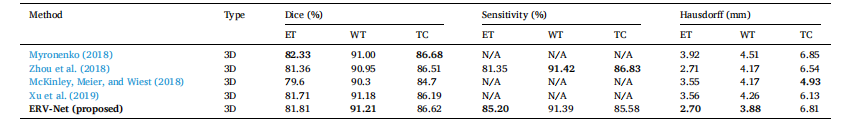
Table 3 Performance comparison with the state-of-the-art methods with model ensemble.
表3与模型集成的最先进方法的性能比较。
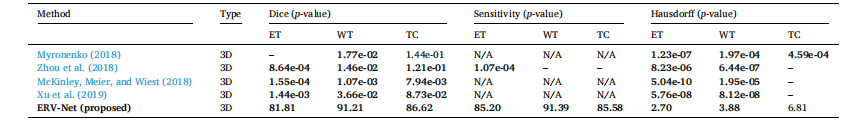
Table 4 The statistical significance validation related to Table 3. Bold denotes the p-value smaller than 0.05. – denotes the indicator is better than ERV-Net.
表4与表3相关的统计学显著性验证。粗体表示p值小于0.05。短横线表示该指标优于ERV-Net。
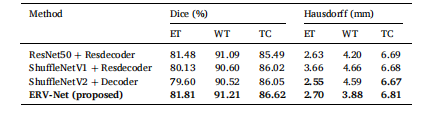
Table 5 Performance comparison of the proposed method.
表5提出方法的性能比较。
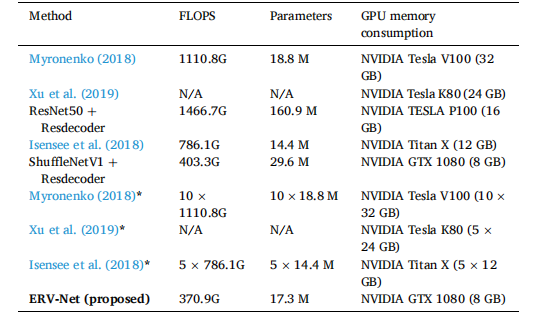
Table 6 Efficiency comparison in FLOPS, parameters and GPU memory consumption. denotes model ensemble.
表6在FLOPS、参数和GPU内存消耗方面的效率比较。表示模型集成。
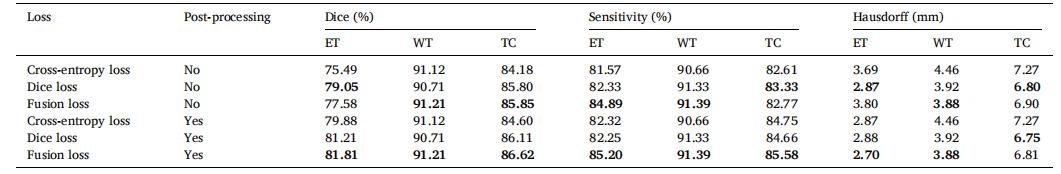
Table 7 Performance comparison of ERV-Net with different loss functions.
表7使用不同损失函数的ERV-Net的性能比较。

Table 8 Performance comparison of the proposed method with and without post-processing.
表8提出方法在有和没有后处理情况下的性能比较。


 237
237

 被折叠的 条评论
为什么被折叠?
被折叠的 条评论
为什么被折叠?
 到【灌水乐园】发言


