


一、单独一个文件可视化(源码对应utils文件夹下的plots.py文件的plot_results类)
from pathlib import Path
import matplotlib.pyplot as plt
import pandas as pd
def plot_results(file='runs/train/exp9/results.csv', dir=''):
    # Plot training results.csv. Usage: from utils.plots import *; plot_results('path/to/results.csv')
    save_dir = Path(file).parent if file else Path(dir)
    fig, ax = plt.subplots(2, 5, figsize=(12, 6), tight_layout=True)
    ax = ax.ravel()
    files = list(save_dir.glob(file))
    assert len(files), f'No results.csv files found in {save_dir.resolve()}, nothing to plot.'
    for fi, f in enumerate(files):
        try:
            data = pd.read_csv(f)
            s = [x.strip() for x in data.columns]
            x = data.values[:, 0]
            for i, j in enumerate([1, 2, 3, 4, 5, 8, 9, 10, 6, 7]):
                y = data.values[:, j]
                # y[y == 0] = np.nan  # don't show zero values
                ax[i].plot(x, y, marker='.', label=f.stem, linewidth=2, markersize=8)
                ax[i].set_title(s[j], fontsize=12)
                # if j in [8, 9, 10]:  # share train and val loss y axes
                #     ax[i].get_shared_y_axes().join(ax[i], ax[i - 5])
        except Exception as e:
            print(f'Warning: Plotting error for {f}: {e}')
    ax[1].legend()
    fig.savefig(save_dir / 'results.png', dpi=200)  #修改保存路径
    plt.close()


if __name__ == '__main__':
    plot_results(file='results.csv')   #该python文件位于根目录下(此文件和传入文件在同一目录下),注意修改传入文件路径
单独把代码拿出来建立py文件,注意上传文件路径以及文件保存路径。
效果图展示:(results.png文件)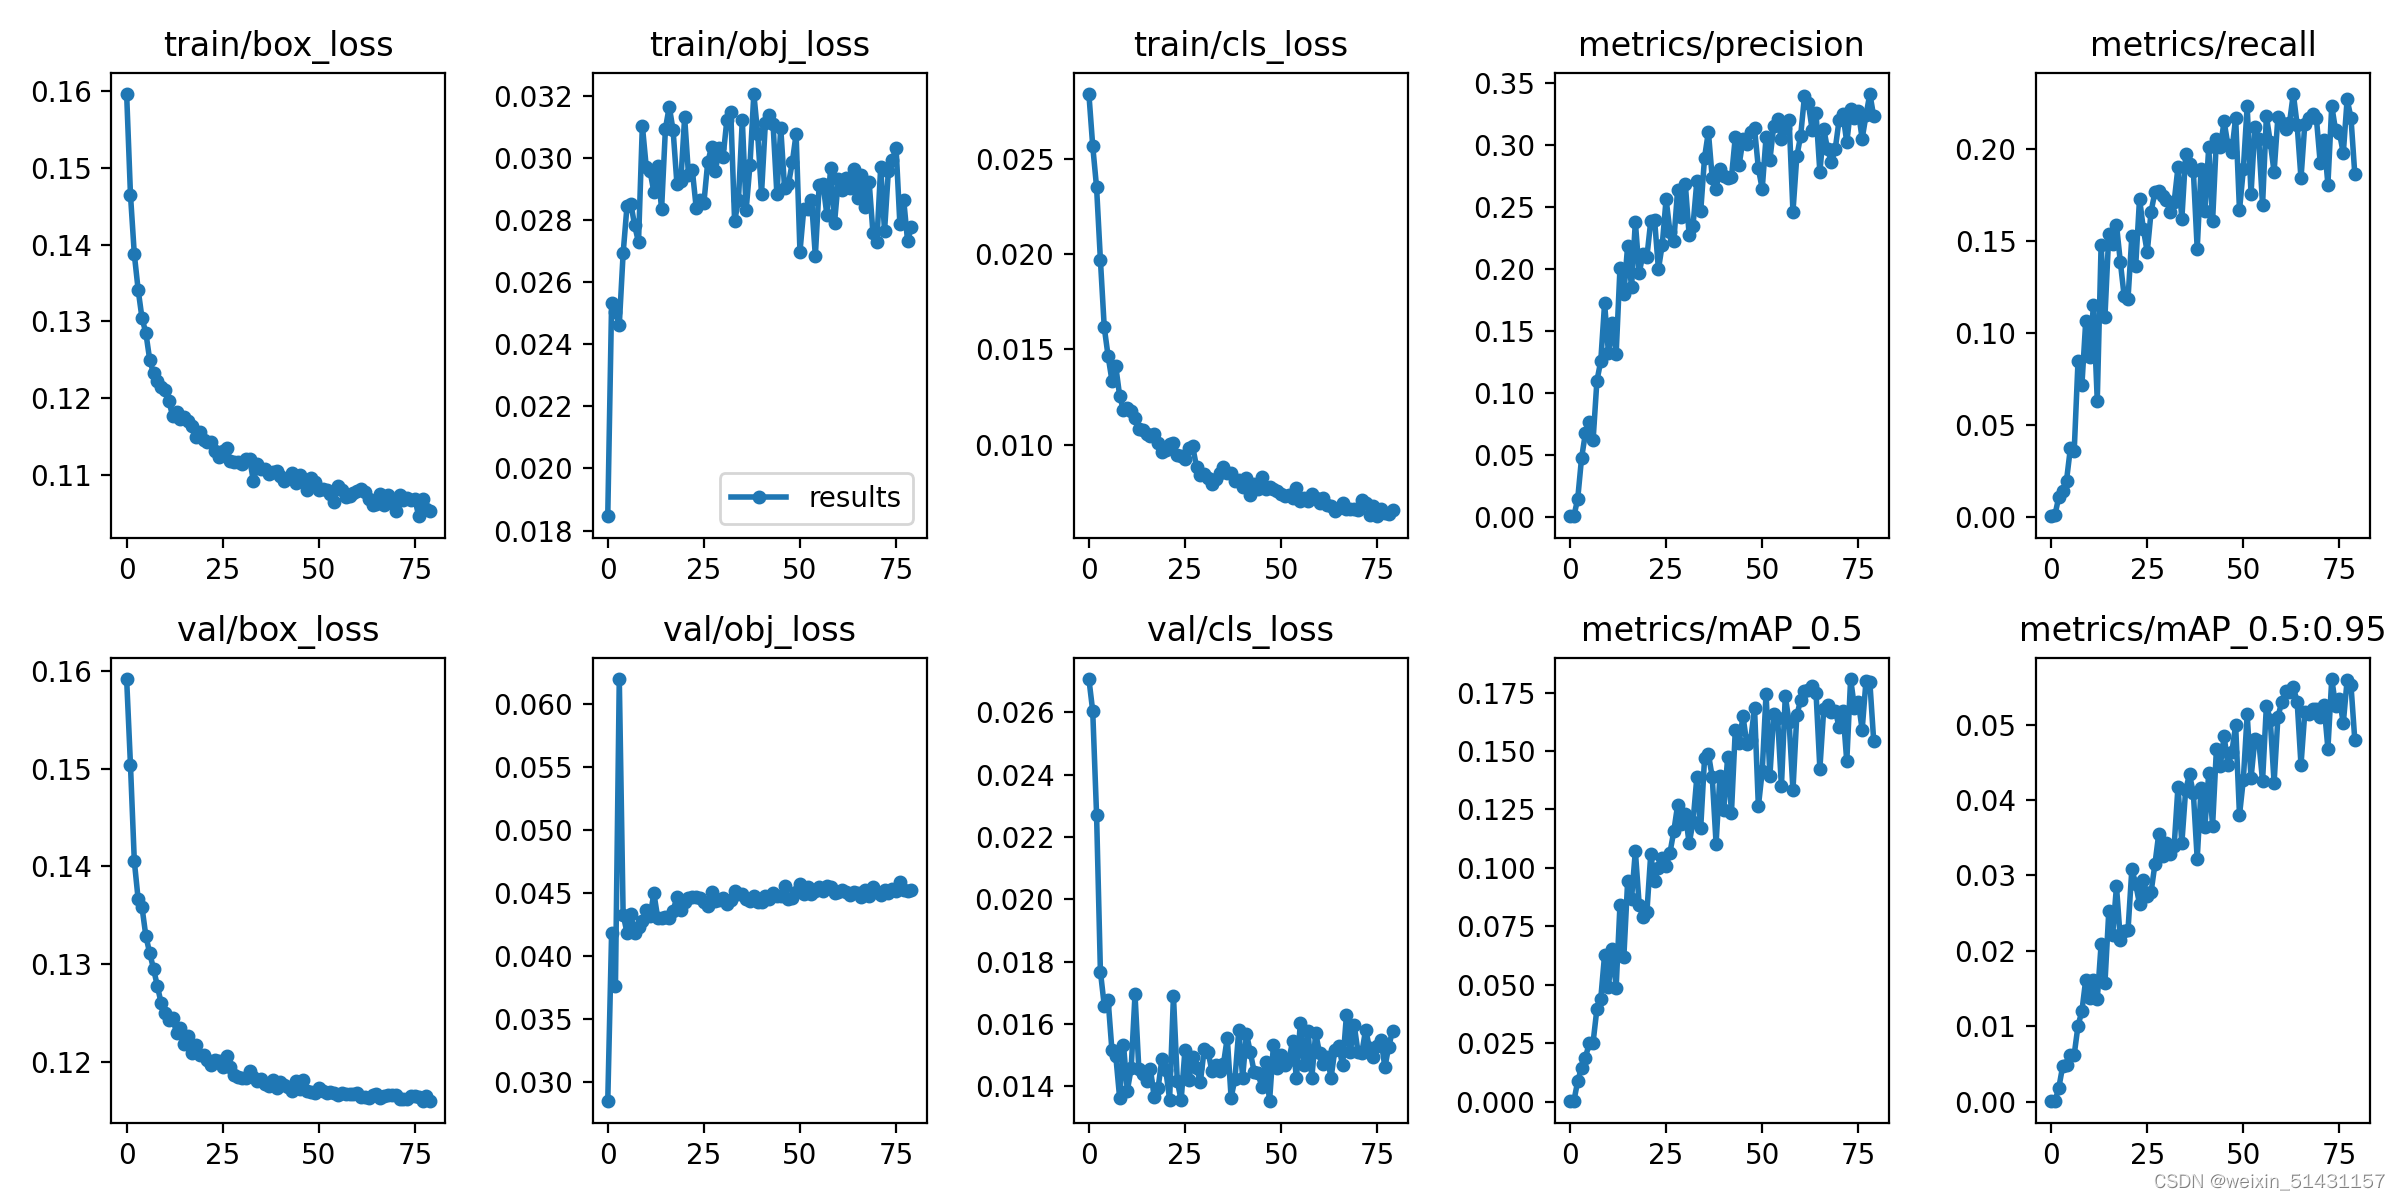
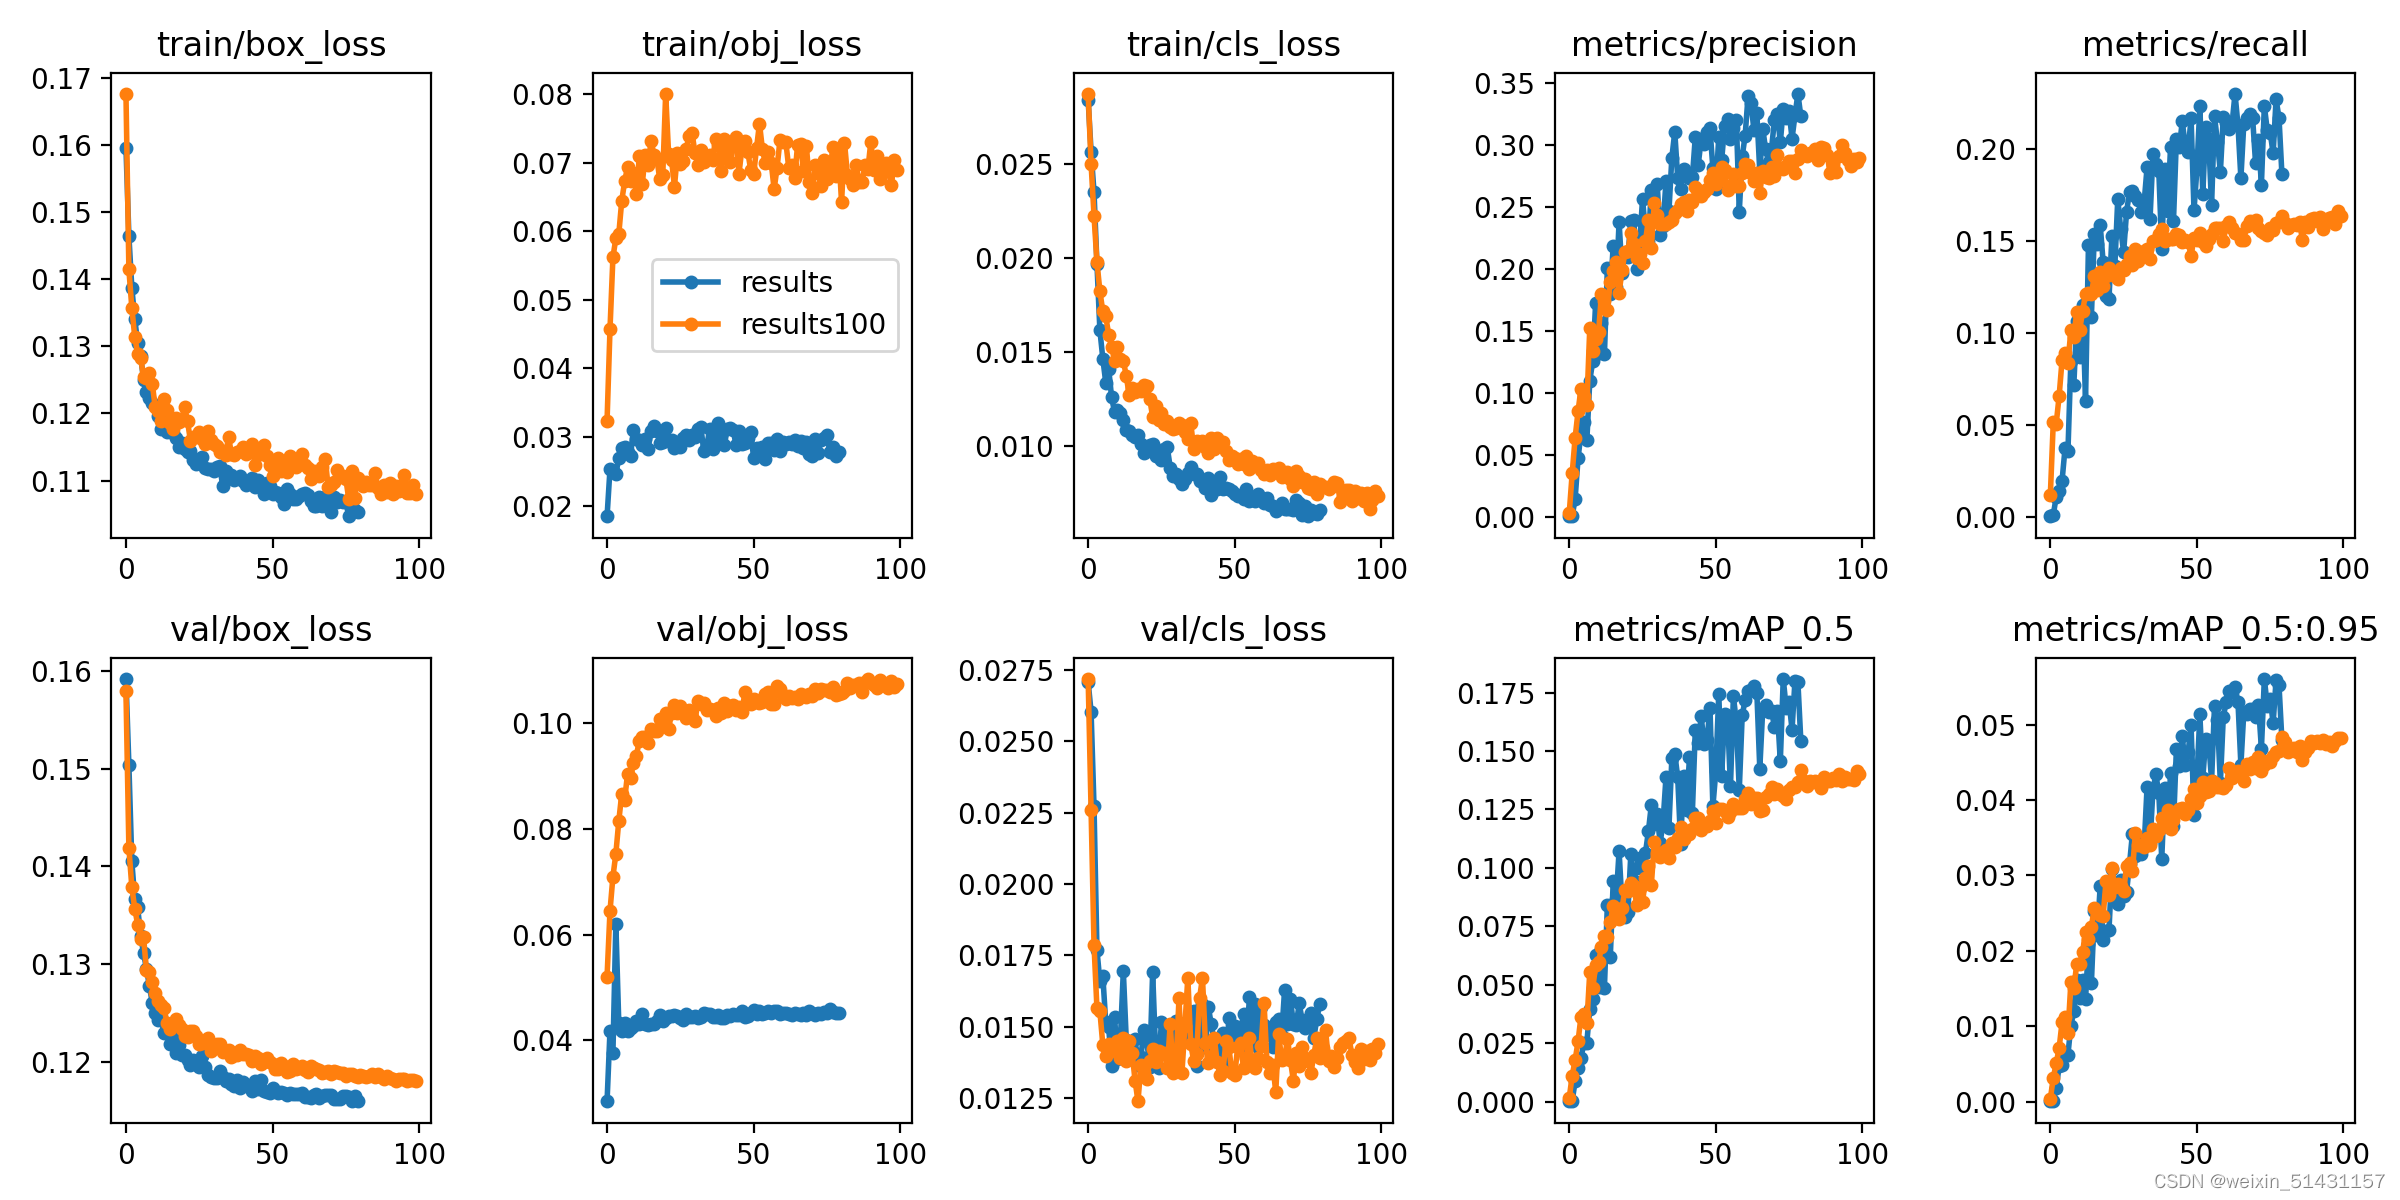
二、两个results.csv文件对比(经常用于原模型与改进模型训练效果对比):
这里用到了两个csv文件(results.csv(改进模型训练80轮)和results100.csv(原模型训练100轮))
from pathlib import Path
import matplotlib.pyplot as plt
import pandas as pd
def plot_results(file='runs/train/exp9/results.csv', file2='runs/train/exp9/results100.csv' , dir=''):
# Plot training results.csv. Usage: from utils.plots import *; plot_results('path/to/results.csv')
save_dir = Path(file).parent if file else Path(dir)
save_dir2 = Path(file2).parent if file2 else Path(dir)
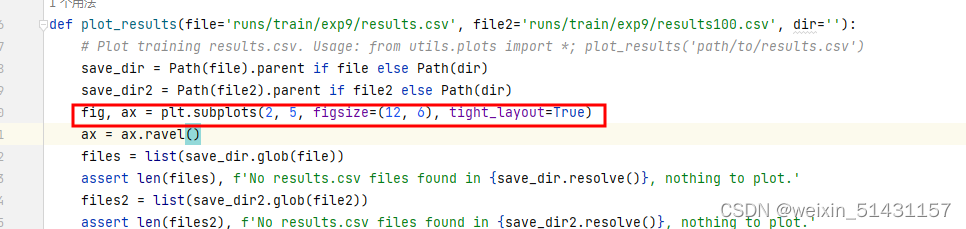
fig, ax = plt.subplots(2, 5, figsize=(12, 6), tight_layout=True)
ax = ax.ravel()
files = list(save_dir.glob(file))
assert len(files), f'No results.csv files found in {save_dir.resolve()}, nothing to plot.'
files2 = list(save_dir2.glob(file2))
assert len(files2), f'No results.csv files found in {save_dir2.resolve()}, nothing to plot.'
for fi, f in enumerate(files):
try:
data = pd.read_csv(f)
s = [x.strip() for x in data.columns]
x = data.values[:, 0]
for i, j in enumerate([1, 2, 3, 4, 5, 8, 9, 10, 6, 7]):
y = data.values[:, j]
# y[y == 0] = np.nan # don't show zero values
ax[i].plot(x, y, marker='.', label=f.stem, linewidth=2, markersize=8)
ax[i].set_title(s[j], fontsize=12)
# if j in [8, 9, 10]: # share train and val loss y axes
# ax[i].get_shared_y_axes().join(ax[i], ax[i - 5])
except Exception as e:
print(f'Warning: Plotting error for {f}: {e}')
for fi, f in enumerate(files2):
try:
data = pd.read_csv(f)
s = [x.strip() for x in data.columns]
x = data.values[:, 0]
for i, j in enumerate([1, 2, 3, 4, 5, 8, 9, 10, 6, 7]):
y = data.values[:, j]
# y[y == 0] = np.nan # don't show zero values
ax[i].plot(x, y, marker='.', label=f.stem, linewidth=2, markersize=8)
ax[i].set_title(s[j], fontsize=12)
# if j in [8, 9, 10]: # share train and val loss y axes
# ax[i].get_shared_y_axes().join(ax[i], ax[i - 5])
except Exception as e:
print(f'Warning: Plotting error for {f}: {e}')
ax[1].legend()
fig.savefig(save_dir / 'results_vs.png', dpi=200) #修改保存路径
plt.close()
if __name__ == '__main__':
plot_results(file='results.csv',file2='results100.csv') #该python文件位于根目录下(此文件和传入文件在同一目录下),注意修改传入文件路径效果图展示:(results_vs.png文件)
具体实验见:
YOLOv5改进网络:CBAM+小目标检测头_cbam注意力机制 csdn-CSDN博客
注释:图中曲线颜色与线条粗细可通过plt.subplots(2, 5, figsize=(12, 6), tight_layout=True)调整
一般报错:
No results.csv files found in {save_dir.resolve()}, nothing to plot.
解决方法:
将三个文件放在同一文件夹下进行测试


 1万+
1万+

 被折叠的 条评论
为什么被折叠?
被折叠的 条评论
为什么被折叠?
 到【灌水乐园】发言


