作者,Evil Genius
上一篇我们完成了空间注释之后,立马就要来到我们的下一步分析,细胞的空间位置关系。也是空间转录组必备的分析之一。
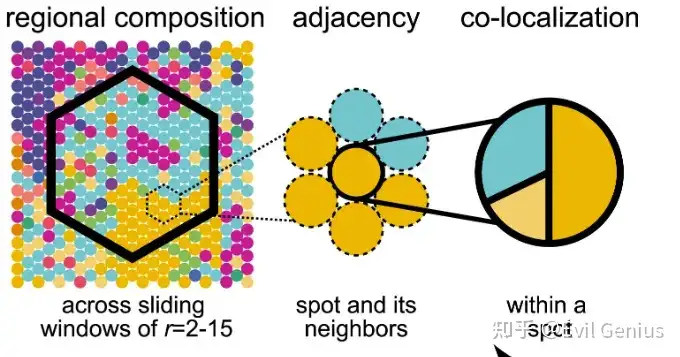
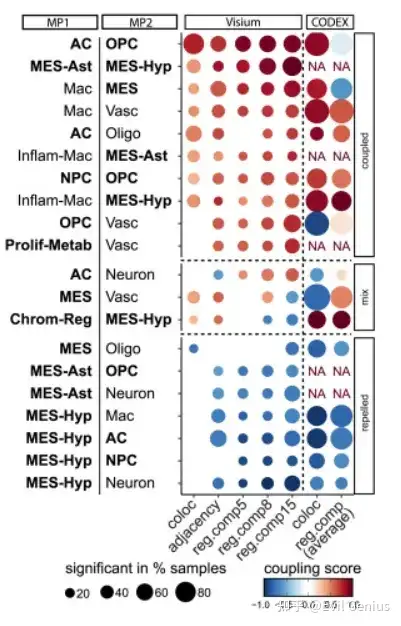
其中包括不同细胞类型之间的空间关系
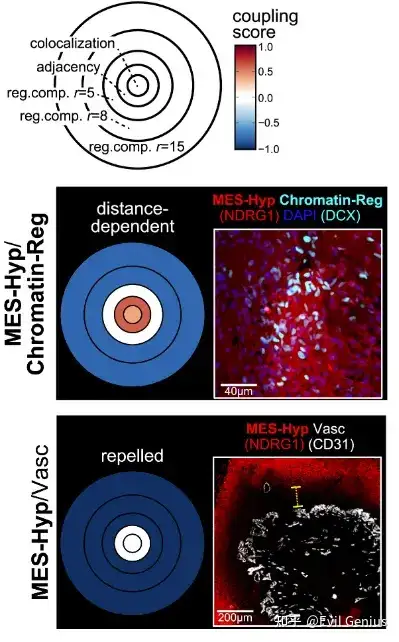
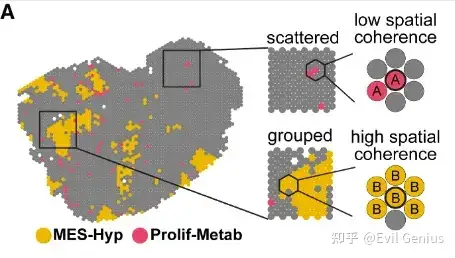
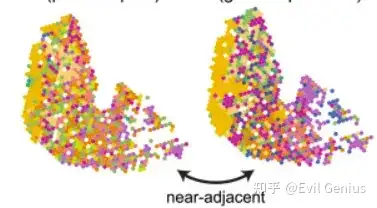
以及相同细胞类型的空间位置关系
课程上分享的代码均可实现,但是我们不走回头路,分享就分享新的。
首先定义分析空间细胞类型共定位的函数
# # co-localization functions  ---------------------------------------------
# Count interactions between pairs
colocal_mat <- function(x) {
  stopifnot(
    is.matrix(x), is.numeric(x),
    all(dim(x) > 0), ncol(x) > 1)

  if (is.null(colnames(x))) {
    colnames(x) <- seq_len(ncol(x))
  }
  df <- calc_pairs(x)
  df <- compute_interactions(x, df)
  return(df)
}

calc_pairs <- function(x) {
  x <- x > 0
  ab <- combn(colnames(x), 2)
  y <- apply(ab, 2, function(.) sum(matrixStats::rowAlls(x[, ., drop = FALSE])))
  df <- data.frame(t(ab), y)
  names(df) <- c("pair1", "pair2", "n")
  return(df)
}

compute_interactions <- function(x, df) {
  y <- colnames(x)
  df$a <- factor(df$pair1, levels = y)
  df$b <- factor(df$pair2, levels = rev(y))
  t <- colSums(x > 0)
  a <- match(df$pair1, y)
  b <- match(df$pair2, y)
  df$ta <- t[a]
  df$tb <- t[b]
  df$pa <- df$n / df$ta
  df$pb <- df$n / df$tb
  df$ab_mean <- (df$pa + df$pb) / 2
  df$ab_comb <- df$n / (df$ta + df$tb)
  df$ab_comb2 <- df$n / (df$ta * df$tb)
  df$pairs <- paste(df$a, df$b)
  return(df)
}

# Adjacency Helper Functions -------------------------------------------


.neighbors_table_func <- function(metadata, spot_class = "MPid", spot_name = "Key") {
  if(is.factor(metadata[[spot_class]])) {metadata[[spot_class]] <- as.character(metadata[[spot_class]])}
  neighbors_table <- sapply(metadata[[spot_name]], function(spot) {
    spots_row = metadata$array_row[metadata[[spot_name]] == spot]
    spots_col = metadata$array_col[metadata[[spot_name]] == spot]

    n1_temp = metadata[[spot_name]][metadata$array_row == as.numeric(spots_row) - 1 & metadata$array_col == as.numeric(spots_col) - 1]
    if(length(n1_temp) == 0) {
      n1 = NA
    } else {
      n1 = as.character(metadata[[spot_class]][metadata[[spot_name]] == n1_temp])
    }

    n2_temp = metadata[[spot_name]][metadata$array_row == as.numeric(spots_row) - 1 & metadata$array_col == as.numeric(spots_col) + 1]
    if (length(n2_temp) == 0) {
      n2 = NA
    } else {
      n2 = as.character(metadata[[spot_class]][metadata[[spot_name]] == n2_temp])
    }

    n3_temp = metadata[[spot_name]][metadata$array_row == as.numeric(spots_row) & metadata$array_col == as.numeric(spots_col) - 2]
    if (length(n3_temp) == 0) {
      n3 = NA
    } else {
      n3 = as.character(metadata[[spot_class]][metadata[[spot_name]] == n3_temp])
    }

    n4_temp = metadata[[spot_name]][metadata$array_row == as.numeric(spots_row) & metadata$array_col == as.numeric(spots_col) + 2]
    if (length(n4_temp) == 0) {
      n4 = NA
    } else {
      n4 = as.character(metadata[[spot_class]][metadata[[spot_name]] == n4_temp])
    }

    n5_temp = metadata[[spot_name]][metadata$array_row == as.numeric(spots_row) + 1 & metadata$array_col == as.numeric(spots_col) - 1]
    if (length(n5_temp) == 0) {
      n5 = NA
    } else {
      n5 = as.character(metadata[[spot_class]][metadata[[spot_name]] == n5_temp])
    }

    n6_temp = metadata[[spot_name]][metadata$array_row == as.numeric(spots_row) + 1 & metadata$array_col == as.numeric(spots_col) + 1]
    if (length(n6_temp) == 0) {
      n6 = NA
    } else {
      n6 = as.character(metadata[[spot_class]][metadata[[spot_name]] == n6_temp])
    }

    return(c(n1, n2, n3, n4, n5, n6))
  })

  neighbors_table = t(neighbors_table)
  rownames(neighbors_table) = metadata[[spot_name]]
  return(neighbors_table)
}


.prog_connectivity_score <- function(program_neighbors, state) {
  state_neighbors_bin <- ifelse(program_neighbors == state, 0, 1)
  if(is.null(dim(state_neighbors_bin))) {
    prog_connect <- 1
  } else {
    prog_connect <- length(which(apply(state_neighbors_bin, 1, function(x) {sum(na.omit(x))}) > 0))
  }
  return(prog_connect)
}


.calc_adj_mat <- function(neighbored_state, spots_states, state_neighbors_table, spot_class = "MPid") {
  if(!(neighbored_state %in% spots_states[[spot_class]])) {
    return(0)
  } else {
    state_neighbors_bin <- ifelse(state_neighbors_table == neighbored_state, 1, 0)
    if(is.null(dim(state_neighbors_bin))) {
      state_neighbors_sum <- sum(na.omit(state_neighbors_bin))
    } else {
      state_neighbors_sum <- sum(apply(state_neighbors_bin, 1, function(x) {sum(na.omit(x))}))
    }
    return(state_neighbors_sum)
  }
}


# Adjacency Bootstrapping Method ---------------------------------------


# The metadata supplied to the function must contain spatial coordinate information!
calc_spatial_neighborhood <- function(metadata,
                                      spot_class = "MPid",
                                      spot_name = "Key",
                                      samples = "all",
                                      iter = 20) {

  # Check inputs
  if(is.factor(metadata[[spot_class]])) {
    all_labels <- na.omit(levels(metadata[[spot_class]]))
  } else if(is.character(metadata[[spot_class]])) {
    all_labels <- na.omit(unique(metadata[[spot_class]]))
    metadata[[spot_class]] <- as.factor(metadata[[spot_class]])
  } else {stop("spot_class should either be a factor or character vector!")}
  stopifnot("Error: metadata must contain a column specifying sample name." =
              any(grepl("sample*", colnames(metadata), ignore.case = TRUE)))
  metadata$enumerate <- metadata[[grep("sample*", colnames(metadata), ignore.case = TRUE)]]
  if(length(samples) == 1 && samples == "all") {
    samples <- unique(metadata$enumerate)
  } else if((length(samples) > 1 || samples != "all") & all(samples %in% unique(metadata$enumerate))) {
    samples <- samples
  } else {stop("samples supplied do not match the samples present in the metadata!")}

  message("This proccess may take a while...")
  connectivity <- lapply(seq_along(samples), function(i) {
    message(paste0("Start proccessing sample: ", samples[[i]]))
    samp_meta <- metadata[metadata$enumerate == samples[[i]], ]

    ## Construct Neighbors tables
    # Randomized spot ids & position table
    rand_neighbors_table <- lapply(seq_len(iter), function(j) {
      shuffled_spots <- sample(samp_meta[[spot_name]], length(samp_meta[[spot_name]]), replace = FALSE)
      shuffled_meta <- samp_meta %>% dplyr::mutate({{spot_name}} := shuffled_spots)
      neighbors_table <- .neighbors_table_func(shuffled_meta, spot_class = spot_class, spot_name = spot_name)
      return(neighbors_table)
    })

    # Bootstrapped spots class identity
    boots_neighbors_table <- lapply(seq_len(iter), function(j) {
      new_spots <- unique(sample(samp_meta[[spot_name]], length(samp_meta[[spot_name]]), replace = TRUE))
      bootsteped_meta <- samp_meta[samp_meta[[spot_name]] %in% new_spots, ]
      neighbors_table <- .neighbors_table_func(bootsteped_meta, spot_class = spot_class, spot_name = spot_name)
      return(neighbors_table)
    })

    # Actual (observed) neighborhood table
    neighbors_table <- .neighbors_table_func(samp_meta, spot_class = spot_class, spot_name = spot_name)

    # Calculate connectivity scores (spatial coherence)
    programs_connectivity_score <- sapply(sort(all_labels), function(cluster) {
      if (!(cluster %in% samp_meta[[spot_class]])) {
        prog_score <- NaN
      } else {
        program_neighbors_table = neighbors_table[rownames(neighbors_table) %in% samp_meta[[spot_name]][samp_meta[[spot_class]] == cluster & !is.na(samp_meta[[spot_class]])], ]
        prog_score <- .prog_connectivity_score(program_neighbors_table, cluster)
      }
      return(prog_score)
    })


    ## Connectivity
    boots_adj_mat <- lapply(boots_neighbors_table, function(b_table) {
      obs_adj_mat <- sapply(sort(all_labels), function(cluster) {
        if (!(cluster %in% samp_meta[[spot_class]])) {
          zero_neigh <- rep(0, length(all_labels))
          names(zero_neigh) <- all_labels
          return(zero_neigh)
        } else {
          cluster_neighbors_table = b_table[rownames(b_table) %in% samp_meta[[spot_name]][samp_meta[[spot_class]] == cluster & !is.na(samp_meta[[spot_class]])], ]
          num_of_neighbores = sapply(sort(as.character(all_labels)), function(neighbored_cluster) {
            num <- .calc_adj_mat(neighbored_cluster, samp_meta, cluster_neighbors_table)
            return(num)
          })
          return(num_of_neighbores)
        }})

      diag(obs_adj_mat) <- 0
      weighted_adj_mat <- apply(obs_adj_mat, 2, function(x) {x / sum(x)})

      comp4mat <- programs_connectivity_score[colnames(weighted_adj_mat)]
      comp4mat[is.na(comp4mat)] <- 0
      weighted_denominator_v2 <- sapply(c(names(comp4mat)), function(prog){
        new_comp <- comp4mat
        new_comp[prog] <- 0
        new_comp <- new_comp / sum(new_comp)
        return(new_comp)
      })

      norm_adj_mat <- weighted_adj_mat / weighted_denominator_v2

      upper_mat <- (norm_adj_mat[upper.tri(norm_adj_mat)] + t(norm_adj_mat)[upper.tri(t(norm_adj_mat))]) / 2
      lower_mat <- rep(NaN, length(upper_mat))
      avg_mat <- norm_adj_mat
      avg_mat[upper.tri(avg_mat)] <- upper_mat
      avg_mat[lower.tri(avg_mat)] <- lower_mat

      rownames(avg_mat) <- colnames(avg_mat)
      avg_mat <- t(avg_mat)
      avg_mat <- as.data.frame(avg_mat)
      avg_mat$pair2 <- rownames(avg_mat)
      long <- reshape2::melt(data.table::setDT(avg_mat), id.vars = c("pair2"), variable.name = "pair1")
      return(long)
    })


    # Random connectivity
    rand_adj_mat <- lapply(rand_neighbors_table, function(b_table) {
      obs_adj_mat <- sapply(sort(all_labels), function(cluster) {
        if (!(cluster %in% samp_meta[[spot_class]])) {
          return(rep(0, length(all_labels)))
        } else {
          cluster_neighbors_table = b_table[row.names(b_table) %in% samp_meta[[spot_name]][samp_meta[[spot_class]] == cluster & !is.na(samp_meta[[spot_class]])], ]
          num_of_neighbores = sapply(sort(as.character(all_labels)), function(neighbored_cluster) {
            num <- .calc_adj_mat(neighbored_cluster, samp_meta, cluster_neighbors_table)
            return(num)
          })
          return(num_of_neighbores)
        }})

      diag(obs_adj_mat) <- 0
      weighted_adj_mat <- apply(obs_adj_mat, 2, function(x) {x / sum(x)})

      comp4mat <- programs_connectivity_score[colnames(weighted_adj_mat)]
      comp4mat[is.na(comp4mat)] <- 0
      weighted_denominator_v2 <- sapply(c(names(comp4mat)), function(prog) {
        new_comp <- comp4mat
        new_comp[prog] <- 0
        new_comp <- new_comp / sum(new_comp)
        return(new_comp)
      })

      norm_adj_mat <- weighted_adj_mat / weighted_denominator_v2

      upper_mat <- (norm_adj_mat[upper.tri(norm_adj_mat)] + t(norm_adj_mat)[upper.tri(t(norm_adj_mat))]) / 2
      lower_mat <- rep(NaN, length(upper_mat))
      avg_mat <- norm_adj_mat
      avg_mat[upper.tri(avg_mat)] <- upper_mat
      avg_mat[lower.tri(avg_mat)] <- lower_mat

      rownames(avg_mat) <- colnames(avg_mat)
      avg_mat <- t(avg_mat)
      avg_mat <- as.data.frame(avg_mat)
      avg_mat$pair2 <- rownames(avg_mat)
      long <- reshape2::melt(data.table::setDT(avg_mat), id.vars = c("pair2"), variable.name = "pair1")
      return(long)
    })

    final_adj_mat <- data.frame(pair1 = boots_adj_mat[[1]]$pair1,
                                pair2 = boots_adj_mat[[1]]$pair2,
                                connectivity = apply(sapply(boots_adj_mat, function(x) {return(x$value)}), 1, function(k) {mean(na.omit(k))}),
                                effect_size = apply(sapply(boots_adj_mat, function(x) {return(x$value)}), 1, function(k) {mean(na.omit(k))}) / apply(sapply(rand_adj_mat, function(x) {return(x$value)}), 1, function(k) {mean(na.omit(k))}),
                                sd = apply(sapply(boots_adj_mat, function(x) {return(x$value)}), 1, function(k) {sd(na.omit(k))}))


    ## Add p-value
    pval <- sapply(seq_len(nrow(final_adj_mat)), function(j1) {
      obs <- na.omit(as.numeric(sapply(seq_len(iter), function(j2) {
        return(boots_adj_mat[[j2]][j1, "value"])
      })))
      exp <- na.omit(as.numeric(sapply(seq_len(iter), function(j2) {
        return(rand_adj_mat[[j2]][j1, "value"])
      })))
      if (length(obs) == 0) {
        return(NA)
      } else {
        t.res <- t.test(obs, exp, alternative = "two.sided", var.equal = FALSE)
        return(t.res$p.value)
      }
    })

    final_adj_mat$pval <- pval
    return(final_adj_mat)
  })
  names(connectivity) <- samples
  return(connectivity)
}


# Adjacency Permutation Method ----------------------------------------------------

# The metadata supplied to the function must contain spatial coordinate information!
neighbor_spot_props <- function(metadata,
                                zone = "All",
                                #site = "All",
                                samples = "All",
                                spot_class = "MPid",
                                spot_name = "Key",
                                #zone_by = "EpiStroma",
                                n_cores = 10,
                                n_perm = 1000,
                                signif_val = 0.01,
                                plot_perm_distr = TRUE,
                                filter_signif = TRUE,
                                zscore_thresh = 1) {
  # Load variables
  all_states <- as.character(unique(unlist(sapply(c(1:length(sample_ls)), function(i){
    mp_assign <- readRDS('test.rds')
    return(unique(mp_assign$spot_type_meta_new))
  }))))
  #samples_metadata <- readRDS(file = here("Analysis/Metadata/samples_metadata.rds"))
  neighbs_stats_ls <- list()
  signif_neighbs_ls <- list()
  distr_plots_ls <- list()

  # Filter metadata input by selected site and zone
  stopifnot("Error: metadata must contain a column specifying sample name." =
              any(grepl("sample*", colnames(metadata), ignore.case = TRUE)))
  # if(site != "All") {
  #   stopifnot("Error: Site argument must be one of the following: 'Laryngeal' / 'Oral' / 'Oropharynx'." =
  #               site %in% unique(samples_metadata$Site))
  #   metadata <- metadata[metadata$Sample %in% samples_metadata$Sample[samples_metadata$Site == site], ]
  # }
  if(zone != "All") {
    #stopifnot("Error: Argument `zone_by` must be either 'EpiStroma' (for separating Epithelial, Stromal or Mixed spots) or 'Zone' (for separating Epithelial zonation)." =
    #           zone_by %in% c("EpiStroma", "Zone") & length(zone_by) == 1)
    # if(zone_by == "EpiStroma") {
    #   stopifnot("Error: Argument `zone` should specify on which tumor region neighboring states will be computed - 'Epithelial' / 'Stroma' / 'Mixed'." =
    #               zone %in% unique(metadata$EpiStroma) & length(zone) == 1)
    #   metadata <- metadata[metadata$EpiStroma == zone, ]
    # }
    # if(zone_by == "Zone") {
    #   stopifnot("Error: The variable `Zone` is not found in the metadata. Run classify_zones function first." =
    #               any(colnames(metadata) %in% "Zone"))
    #  stopifnot("Error: Argument `zone` should specify on which Epithelial zone neighboring states will be computed - 'Zone_1' / 'Zone_2' / 'Zone_3'." =
    #               zone %in% unique(metadata$Zone) & length(zone) == 1)
    metadata <- metadata[metadata$Zone == zone, ]
    # }
  }
  metadata$enumerate <- metadata[[grep("sample*", colnames(metadata), ignore.case = TRUE)]]
  if(length(samples) == 1 && samples == "All") {
    samples <- unique(metadata$enumerate)
  } else if((length(samples) > 1 || samples != "All") & all(samples %in% unique(metadata$enumerate))) {
    samples <- samples
  } else {stop("samples supplied do not match the samples present in the metadata!")}

  for(samp in samples) {
    message(paste0("Processing sample: ", samp))

    ### ============ Actual state pairs connectivity values ============
    # Construct neighboring table for the sample
    samp_meta <- metadata[metadata$Sample == samp, ]
    neighbors_table <- .neighbors_table_func(samp_meta, spot_class = spot_class, spot_name = spot_name)

    # Calculate connectivity scores (spatial coherence)
    programs_connectivity_score <- sapply(sort(all_states), function(state) {
      if (!(state %in% samp_meta[[spot_class]])) {
        prog_score <- NaN
      } else {
        program_neighbors_table = neighbors_table[rownames(neighbors_table) %in% samp_meta[[spot_name]][samp_meta[[spot_class]] == state & !is.na(samp_meta[[spot_class]])], ]
        prog_score <- .prog_connectivity_score(program_neighbors_table, state)
      }
      return(prog_score)
    })

    # Count neighboring states for each spot (number of free (non-coherent) X state classified spots that neighbor free Y reference-state)
    obs_adj_mat <- sapply(sort(all_states), function(state) {
      if (!(state %in% samp_meta[[spot_class]])) {
        zero_neigh <- rep(0, length(all_states))
        names(zero_neigh) <- all_states
        return(zero_neigh)
      } else {
        state_neighbors_table = neighbors_table[rownames(neighbors_table) %in% samp_meta[[spot_name]][samp_meta[[spot_class]] == state & !is.na(samp_meta[[spot_class]])], ]
        num_of_neighbors = sapply(sort(as.character(all_states)), function(neighbored_state) {
          num <- .calc_adj_mat(neighbored_state, samp_meta, state_neighbors_table)
          return(num)
        })
        return(num_of_neighbors)
      }})
    diag(obs_adj_mat) <- 0
    weighted_adj_mat <- apply(obs_adj_mat, 2, function(x) {x / sum(x)})

    # Calculate corrected proportion of neighboring spots
    comp4mat <- programs_connectivity_score[colnames(weighted_adj_mat)]
    comp4mat[is.na(comp4mat)] <- 0
    weighted_denominator_v2 <- sapply(c(names(comp4mat)), function(prog){
      new_comp <- comp4mat
      new_comp[prog] <- 0
      new_comp <- new_comp / sum(new_comp)
      return(new_comp)
    })

    norm_adj_mat <- weighted_adj_mat / weighted_denominator_v2
    baseline_stat <- Melt(norm_adj_mat)

    ### ============ Permuted state pairs connectivity values ============
    # Permute neighbor table `n_perm` times, to create a permuted sampling distribution which will serve as the null distribution
    permute_neighbs <- parallel::mclapply(1:n_perm, function(x) {
      shuffled_spots <- sample(samp_meta[[spot_name]], length(samp_meta[[spot_name]]), replace = FALSE)
      shuffled_meta <- samp_meta %>% dplyr::mutate({{spot_name}} := shuffled_spots)
      neighbors_table <- .neighbors_table_func(shuffled_meta, spot_class = spot_class, spot_name = spot_name)
      neighbors_table <- neighbors_table[match(samp_meta[[spot_name]], rownames(neighbors_table)), ]

      obs_adj_mat <- sapply(sort(all_states), function(state) {
        if (!(state %in% samp_meta[[spot_class]])) {
          zero_neigh <- rep(0, length(all_states))
          names(zero_neigh) <- all_states
          return(zero_neigh)
        } else {
          state_neighbors_table = neighbors_table[rownames(neighbors_table) %in% samp_meta[[spot_name]][samp_meta[[spot_class]] == state & !is.na(samp_meta[[spot_class]])], ]
          num_of_neighbors = sapply(sort(as.character(all_states)), function(neighbored_state) {
            num <- .calc_adj_mat(neighbored_state, samp_meta, state_neighbors_table)
            return(num)
          })
          return(num_of_neighbors)
        }})
      diag(obs_adj_mat) <- 0
      weighted_adj_mat <- apply(obs_adj_mat, 2, function(x) {x / sum(x)})

      comp4mat <- programs_connectivity_score[colnames(weighted_adj_mat)]
      comp4mat[is.na(comp4mat)] <- 0
      weighted_denominator_v2 <- sapply(c(names(comp4mat)), function(prog){
        new_comp <- comp4mat
        new_comp[prog] <- 0
        new_comp <- new_comp / sum(new_comp)
        return(new_comp)
      })

      norm_adj_mat <- weighted_adj_mat / weighted_denominator_v2
      perm_stat <- Melt(norm_adj_mat)
    }, mc.cores = n_cores)

    perm_stats <- cbind.data.frame(permute_neighbs[[1]]$rows, permute_neighbs[[1]]$cols, do.call(cbind.data.frame, lapply(permute_neighbs, function(y) y$vals))) %>%
      magrittr::set_colnames(c("rows", "cols", paste0("perm_", seq(n_perm))))


    # Compare observed neighboring state proportion to the permuted null distribution - extract Neighbor-proportion, P-value & Permuted distribution statistics
    # merged_df <- merge(baseline_stat, perm_stats, by = c("rows", "cols"))
    merged_df <- na.omit(merge(baseline_stat, perm_stats, by = c("rows", "cols")))
    scaled_vals <- merged_df %>% dplyr::select(-c("rows", "cols")) %>% t() %>% scale() %>% t() %>%
      as.data.frame() %>% dplyr::mutate(rows = merged_df$rows, cols = merged_df$cols, .before = 1) %>% dplyr::pull(vals)
    neighbs_stats <- lapply(seq_len(nrow(merged_df)), function(i) {
      summary_stats <- summary(as.numeric(merged_df[i, grep("perm_", colnames(merged_df))]))
      if(merged_df[i, "vals"] == 0) {
        pvals <- 1
        tail_direction <- NA
      } else {
        Rtail_pvals <- (sum(as.numeric(merged_df[i, grep("perm_", colnames(merged_df))]) >= merged_df[i, "vals"]) + 1) / (n_perm + 1)
        Ltail_pvals <- (n_perm - sum(as.numeric(merged_df[i, grep("perm_", colnames(merged_df))]) > merged_df[i, "vals"]) + 1) / (n_perm + 1)
        tail_direction <- Rtail_pvals < Ltail_pvals
        pvals <- Rtail_pvals * tail_direction + Ltail_pvals * !(tail_direction)
      }
      sds <- sd(as.numeric(merged_df[i, grep("perm_", colnames(merged_df))]))
      out <- data.frame(Neighb_State = merged_df$rows[i], Ref_State = merged_df$cols[i], Prop_Neighb = merged_df$vals[i], Z_Score = scaled_vals[i],
                        Perm_Min = summary_stats[["Min."]], Perm_Max = summary_stats[["Max."]], Perm_Mean = summary_stats[["Mean"]], Perm_Median = summary_stats[["Median"]],
                        P_val = pvals, Interaction_Type = ifelse(is.na(tail_direction), NA,
                                                                 ifelse(tail_direction,"Drawn","Repelled")), SD = sds)
    })
    neighbs_stats <- do.call(rbind.data.frame, neighbs_stats)
    neighbs_stats$Significant <- neighbs_stats$P_val < signif_val
    neighbs_stats_ls[[samp]] <- neighbs_stats

    if(filter_signif) {
      top_neighbs_df <- neighbs_stats %>%
        dplyr::filter(Neighb_State != Ref_State) %>%
        dplyr::mutate(State_Pair = paste0(Ref_State, "_", Neighb_State)) %>%
        dplyr::filter(Significant == TRUE) %>%
        mutate(Signif_Pair = unname(sapply(.$State_Pair, function(x) {
          ifelse(paste0(scalop::substri(x, pos = 2, sep = "_"), "_", scalop::substri(x, pos = 1, sep = "_")) %in% .$State_Pair,
                 yes = "Yes", no = "No")
        }))) %>% dplyr::filter(abs(Z_Score) >= zscore_thresh, Signif_Pair == "Yes") %>% dplyr::arrange(desc(Z_Score))
      signif_neighbs_ls[[samp]] <- top_neighbs_df
    }

    # Generate plots
    if(plot_perm_distr) {
      plot_df <- reshape2::melt(perm_stats)
      distr_plot <- ggplot(plot_df, aes(x = value)) +
        facet_grid(rows ~ cols) +
        geom_histogram() +
        geom_vline(data = baseline_stat, aes(xintercept = vals), color = "red")
      distr_plots_ls[[samp]] <- distr_plot
    }
  }

  if(isTRUE(plot_perm_distr) & isFALSE(filter_signif)) {return(list(Neighbor_Stats = neighbs_stats_ls, Distr_plots = distr_plots_ls))}
  else if(isTRUE(filter_signif) & isFALSE(plot_perm_distr)) {return(list(Neighbs_Stats = neighbs_stats_ls, Top_Neighbs = signif_neighbs_ls))}
  else if(isTRUE(plot_perm_distr) & isTRUE(filter_signif)) {return(list(Neighbs_Stats = neighbs_stats_ls, Top_Neighbs = signif_neighbs_ls, Distr_plots = distr_plots_ls))}
  else {return(neighbs_stats_ls)}
}


Melt <- function(x) {
  if (!is.data.frame(x = x)) {
    x <- as.data.frame(x = x)
  }
  return(data.frame(
    rows = rep.int(x = rownames(x = x), times = ncol(x = x)),
    cols = unlist(x = lapply(X = colnames(x = x), FUN = rep.int, times = nrow(x = x))),
    vals = unlist(x = x, use.names = FALSE)
  ))
}


# regional comp functions  ------------------------------------------------
sample_programs_composition <- function(spots_clusters, gen_clusters){
  composition <- table(spots_clusters$spot_type)
  old_clusters <- names(composition)
  add_clusters <- gen_clusters[!gen_clusters %in% old_clusters]
  sapply(add_clusters,function(clust){
    composition <<- c(composition, clust = 0)
  })

  names(composition) <- c(old_clusters, add_clusters)
  final_composition <- composition[sort(names(composition))]/sum(composition)
  return(final_composition)
}

obs_program_spatial_score <- function(program_neighbors, cluster){
  cluster_neighbors_bin <- ifelse(program_neighbors == cluster, 1, 0)
  if(is.null(dim(program_neighbors))){
    cluster_neighbors_sum <- sum(cluster_neighbors_bin)
  } else {
    cluster_neighbors_sum <- apply(cluster_neighbors_bin,1,function(rx){sum(na.omit(rx))})
  }
  obs <- mean(cluster_neighbors_sum)
  return(obs)
}

one_val <- function(spots_num){
  a <- sqrt((4*spots_num)/(6*sqrt(3)))
  oneval <- (6*spots_num-12*a-6)/spots_num
  return(oneval)
}

zero_val <- function(rand_table, spots_clusters, cluster){
  all_zeroval <- sapply(rand_table, function(neighbors_rand_table){
    program_rand_neighbors_table = neighbors_rand_table[row.names(neighbors_rand_table) %in% spots_clusters$barcodes[spots_clusters$spot_type == cluster],]
    rand_obs <- obs_program_spatial_score(program_rand_neighbors_table, cluster)
    return(rand_obs)
  })
  zeroval <- mean(all_zeroval)
  return(zeroval)
}


calc_adj_mat <- function(neighbored_cluster, spots_clusters, cluster_neighbors_table){
  if (!(neighbored_cluster %in% spots_clusters$spot_type)) {
    return(0)
  } else {
    cluster_neighbors_bin <- ifelse(cluster_neighbors_table == neighbored_cluster, 1, 0)

    if (is.null(dim(cluster_neighbors_bin))){
      cluster_neighbors_sum <- sum(na.omit(cluster_neighbors_bin))
    } else {
      cluster_neighbors_sum <- sum(apply(cluster_neighbors_bin,1,function(x){sum(na.omit(x))}))
    }
    return(cluster_neighbors_sum)
  }
}


prog_connectivity_score <- function(program_neighbors, cluster){
  cluster_neighbors_bin <- ifelse(program_neighbors == cluster, 0, 1)
  if(is.null(dim(program_neighbors))){
    prog_connect <- 1
  } else {
    prog_connect <- length(which(apply(cluster_neighbors_bin,1,function(x){sum(na.omit(x))}) >0))
  }
  return(prog_connect)
}

neighbors_table_func <- function(spots_positions,spots_clusters){
  neighbors_table <- sapply(spots_clusters$barcodes, function(spot){
    spots_row = spots_positions[spots_positions$V1 == spot, 3]
    spots_col = spots_positions[spots_positions$V1 == spot, 4]

    if (spots_col == 0 | spots_row == 0) {
      c1 = NaN
    } else {
      n1 = spots_positions$V1[spots_positions$V3 == spots_row - 1 & spots_positions$V4 == spots_col - 1]
      if (spots_positions$V2[spots_positions$V1 == n1] == 0 | !(n1 %in% spots_clusters$barcodes)){
        c1 = NaN
      } else {
        c1 = as.character(spots_clusters$spot_type[spots_clusters$barcodes == n1])
      }
    }

    if (spots_col == 127 | spots_row == 0) {
      c2 = NaN
    } else {
      n2 = spots_positions$V1[spots_positions$V3 == spots_row - 1 & spots_positions$V4 == spots_col + 1]
      if (spots_positions$V2[spots_positions$V1 == n2] == 0 | !(n2 %in% spots_clusters$barcodes)){
        c2 = NaN
      } else {
        c2 = as.character(spots_clusters$spot_type[spots_clusters$barcodes == n2])
      }
    }

    if (spots_col == 0 | spots_col == 1) {
      c3 = NaN
    } else {
      n3 = spots_positions$V1[spots_positions$V3 == spots_row & spots_positions$V4 == spots_col - 2]
      if (spots_positions$V2[spots_positions$V1 == n3] == 0 | !(n3 %in% spots_clusters$barcodes)){
        c3 = NaN
      } else {
        c3 = as.character(spots_clusters$spot_type[spots_clusters$barcodes == n3])
      }
    }

    if (spots_col == 126 | spots_col == 127) {
      c4 = NaN
    } else {
      n4 = spots_positions$V1[spots_positions$V3 == spots_row & spots_positions$V4 == spots_col + 2]
      if (spots_positions$V2[spots_positions$V1 == n4] == 0 | !(n4 %in% spots_clusters$barcodes)){
        c4 = NaN
      } else {
        c4 = as.character(spots_clusters$spot_type[spots_clusters$barcodes == n4])
      }
    }

    if (spots_col == 0 | spots_row == 77) {
      c5 = NaN
    } else {
      n5 = spots_positions$V1[spots_positions$V3 == spots_row + 1 & spots_positions$V4 == spots_col - 1]
      if (spots_positions$V2[spots_positions$V1 == n5] == 0 | !(n5 %in% spots_clusters$barcodes)){
        c5 = NaN
      } else {
        c5 = as.character(spots_clusters$spot_type[spots_clusters$barcodes == n5])
      }
    }

    if (spots_col == 127 | spots_row == 77) {
      c6 = NaN
    } else {
      n6 = spots_positions$V1[spots_positions$V3 == spots_row + 1 & spots_positions$V4 == spots_col + 1]
      if (spots_positions$V2[spots_positions$V1 == n6] == 0 | !(n6 %in% spots_clusters$barcodes)){
        c6 = NaN
      } else {
        c6 = as.character(spots_clusters$spot_type[spots_clusters$barcodes == n6])
      }
    }


    return(c(c1,c2,c3,c4,c5,c6))

  })

  neighbors_table = t(neighbors_table)
  row.names(neighbors_table) = spots_clusters$barcodes

  return(neighbors_table)
}

neighbors_table_funcV2 <- function(spots_positions,spots_clusters){
  neighbors_table <- sapply(spots_clusters$barcodes, function(spot){
    spots_row = spots_positions[spots_positions$V1 == spot, 3]
    spots_col = spots_positions[spots_positions$V1 == spot, 4]

    if (spots_col == 0 | spots_row == 0) {
      c1 = NaN
    } else {
      n1 = spots_positions$V1[spots_positions$V3 == spots_row - 1 & spots_positions$V4 == spots_col - 1]
      if (spots_positions$V2[spots_positions$V1 == n1] == 0 | !(n1 %in% spots_clusters$barcodes)){
        c1 = NaN
      } else {
        c1 = as.character(n1)
      }
    }

    if (spots_col == 127 | spots_row == 0) {
      c2 = NaN
    } else {
      n2 = spots_positions$V1[spots_positions$V3 == spots_row - 1 & spots_positions$V4 == spots_col + 1]
      if (spots_positions$V2[spots_positions$V1 == n2] == 0 | !(n2 %in% spots_clusters$barcodes)){
        c2 = NaN
      } else {
        c2 = as.character(n2)
      }
    }

    if (spots_col == 0 | spots_col == 1) {
      c3 = NaN
    } else {
      n3 = spots_positions$V1[spots_positions$V3 == spots_row & spots_positions$V4 == spots_col - 2]
      if (spots_positions$V2[spots_positions$V1 == n3] == 0 | !(n3 %in% spots_clusters$barcodes)){
        c3 = NaN
      } else {
        c3 = as.character(n3)
      }
    }

    if (spots_col == 126 | spots_col == 127) {
      c4 = NaN
    } else {
      n4 = spots_positions$V1[spots_positions$V3 == spots_row & spots_positions$V4 == spots_col + 2]
      if (spots_positions$V2[spots_positions$V1 == n4] == 0 | !(n4 %in% spots_clusters$barcodes)){
        c4 = NaN
      } else {
        c4 = as.character(n4)
      }
    }

    if (spots_col == 0 | spots_row == 77) {
      c5 = NaN
    } else {
      n5 = spots_positions$V1[spots_positions$V3 == spots_row + 1 & spots_positions$V4 == spots_col - 1]
      if (spots_positions$V2[spots_positions$V1 == n5] == 0 | !(n5 %in% spots_clusters$barcodes)){
        c5 = NaN
      } else {
        c5 = as.character(n5)
      }
    }

    if (spots_col == 127 | spots_row == 77) {
      c6 = NaN
    } else {
      n6 = spots_positions$V1[spots_positions$V3 == spots_row + 1 & spots_positions$V4 == spots_col + 1]
      if (spots_positions$V2[spots_positions$V1 == n6] == 0 | !(n6 %in% spots_clusters$barcodes)){
        c6 = NaN
      } else {
        c6 = as.character(n6)
      }
    }


    return(c(c1,c2,c3,c4,c5,c6))

  })

  neighbors_table = t(neighbors_table)
  row.names(neighbors_table) = spots_clusters$barcodes

  return(neighbors_table)
}


win_prox_neighbors_table_func <- function(spots_positions,spots_clusters){
  neighbors_table <- sapply(spots_clusters$barcodes, function(spot){
    spots_row = spots_positions[spots_positions$V1 == spot, 3]
    spots_col = spots_positions[spots_positions$V1 == spot, 4]

    if (spots_col == 0 | spots_row == 0) {
      n1 = NA
    } else {
      n1_temp = spots_positions$V1[spots_positions$V3 == spots_row - 1 & spots_positions$V4 == spots_col - 1]
      if (length(n1_temp) == 0) {
        n1 = NA
      } else if (spots_positions$V2[spots_positions$V1 == n1_temp] == 0 | !(n1_temp %in% spots_clusters$barcodes)){
        n1 = NA
      } else {
        n1 = as.character(spots_clusters$spot_type[spots_clusters$barcodes == n1_temp])
      }
    }

    if (spots_col == 127 | spots_row == 0) {
      n2 = NA
    } else {
      n2_temp = spots_positions$V1[spots_positions$V3 == spots_row - 1 & spots_positions$V4 == spots_col + 1]
      if (length(n2_temp) == 0) {
        n2 = NA
      } else if (spots_positions$V2[spots_positions$V1 == n2_temp] == 0 | !(n2_temp %in% spots_clusters$barcodes)){
        n2 = NA
      } else {
        n2 = as.character(spots_clusters$spot_type[spots_clusters$barcodes == n2_temp])
      }
    }

    if (spots_col == 0 | spots_col == 1) {
      n3 = NA
    } else {
      n3_temp = spots_positions$V1[spots_positions$V3 == spots_row & spots_positions$V4 == spots_col - 2]
      if (length(n3_temp) == 0) {
        n3 = NA
      } else if (spots_positions$V2[spots_positions$V1 == n3_temp] == 0 | !(n3_temp %in% spots_clusters$barcodes)){
        n3 = NA
      } else {
        n3 = as.character(spots_clusters$spot_type[spots_clusters$barcodes == n3_temp])
      }
    }

    if (spots_col == 126 | spots_col == 127) {
      n4 = NA
    } else {
      n4_temp = spots_positions$V1[spots_positions$V3 == spots_row & spots_positions$V4 == spots_col + 2]
      if (length(n4_temp) == 0) {
        n4 = NA
      } else if (spots_positions$V2[spots_positions$V1 == n4_temp] == 0 | !(n4_temp %in% spots_clusters$barcodes)){
        n4 = NA
      } else {
        n4 = as.character(spots_clusters$spot_type[spots_clusters$barcodes == n4_temp])
      }
    }

    if (spots_col == 0 | spots_row == 77) {
      n5 = NA
    } else {
      n5_temp = spots_positions$V1[spots_positions$V3 == spots_row + 1 & spots_positions$V4 == spots_col - 1]
      if (length(n5_temp) == 0) {
        n5 = NA
      } else if (spots_positions$V2[spots_positions$V1 == n5_temp] == 0 | !(n5_temp %in% spots_clusters$barcodes)){
        n5 = NA
      } else {
        n5 = as.character(spots_clusters$spot_type[spots_clusters$barcodes == n5_temp])
      }
    }

    if (spots_col == 127 | spots_row == 77) {
      n6 = NA
    } else {
      n6_temp = spots_positions$V1[spots_positions$V3 == spots_row + 1 & spots_positions$V4 == spots_col + 1]
      if (length(n6_temp) == 0) {
        n6 = NA
      } else if (spots_positions$V2[spots_positions$V1 == n6_temp] == 0 | !(n6_temp %in% spots_clusters$barcodes)){
        n6 = NA
      } else {
        n6 = as.character(spots_clusters$spot_type[spots_clusters$barcodes == n6_temp])
      }
    }


    return(c(n1,n2,n3,n4,n5,n6))

  })

  neighbors_table = t(neighbors_table)
  row.names(neighbors_table) = spots_clusters$barcodes

  return(neighbors_table)
}


prox_neighbors_table_func <- function(spots_positions,spots_clusters){
  neighbors_table <- sapply(spots_clusters$barcodes, function(spot){
    spots_row = spots_positions[spots_positions$V1 == spot, 3]
    spots_col = spots_positions[spots_positions$V1 == spot, 4]

    if (spots_col == 0 | spots_row == 0) {
      n1 = NA
    } else {
      n1_temp = spots_positions$V1[spots_positions$V3 == spots_row - 1 & spots_positions$V4 == spots_col - 1]
      if (spots_positions$V2[spots_positions$V1 == n1_temp] == 0 | !(n1_temp %in% spots_clusters$barcodes)){
        n1 = NA
      } else {
        n1 = n1_temp
      }
    }

    if (spots_col == 127 | spots_row == 0) {
      n2 = NA
    } else {
      n2_temp = spots_positions$V1[spots_positions$V3 == spots_row - 1 & spots_positions$V4 == spots_col + 1]
      if (spots_positions$V2[spots_positions$V1 == n2_temp] == 0 | !(n2_temp %in% spots_clusters$barcodes)){
        n2 = NA
      } else {
        n2 = n2_temp
      }
    }

    if (spots_col == 0 | spots_col == 1) {
      n3 = NA
    } else {
      n3_temp = spots_positions$V1[spots_positions$V3 == spots_row & spots_positions$V4 == spots_col - 2]
      if (spots_positions$V2[spots_positions$V1 == n3_temp] == 0 | !(n3_temp %in% spots_clusters$barcodes)){
        n3 = NA
      } else {
        n3 = n3_temp
      }
    }

    if (spots_col == 126 | spots_col == 127) {
      n4 = NA
    } else {
      n4_temp = spots_positions$V1[spots_positions$V3 == spots_row & spots_positions$V4 == spots_col + 2]
      if (spots_positions$V2[spots_positions$V1 == n4_temp] == 0 | !(n4_temp %in% spots_clusters$barcodes)){
        n4 = NA
      } else {
        n4 = n4_temp
      }
    }

    if (spots_col == 0 | spots_row == 77) {
      n5 = NA
    } else {
      n5_temp = spots_positions$V1[spots_positions$V3 == spots_row + 1 & spots_positions$V4 == spots_col - 1]
      if (spots_positions$V2[spots_positions$V1 == n5_temp] == 0 | !(n5_temp %in% spots_clusters$barcodes)){
        n5 = NA
      } else {
        n5 = n5_temp
      }
    }

    if (spots_col == 127 | spots_row == 77) {
      n6 = NA
    } else {
      n6_temp = spots_positions$V1[spots_positions$V3 == spots_row + 1 & spots_positions$V4 == spots_col + 1]
      if (spots_positions$V2[spots_positions$V1 == n6_temp] == 0 | !(n6_temp %in% spots_clusters$barcodes)){
        n6 = NA
      } else {
        n6 = n6_temp
      }
    }


    return(c(n1,n2,n3,n4,n5,n6))

  })

  neighbors_table = t(neighbors_table)
  row.names(neighbors_table) = spots_clusters$barcodes

  return(neighbors_table)
}
大家还知道不同平台共定位需要考虑的邻居数么?
主脚本
library(stringr)
library(cocor)
library(dplyr)
library(data.table)
library(stats)
library(scalop)
library(tibble)
library(ggrepel)
library(tidyr)
library(scales)
library(matrixStats)

# Run functions first

# co-localization  ---------------------------------------------------------
#### log-transform expression matrices
m <- readRDS("test.rds")
m <- m[-grep("^MT-|^RPL|^RPS", rownames(m)), ]
if(min(colSums(m)) == 0){m <- m[, colSums(m) != 0]}
 scaling_factor <- 1000000/colSums(m)
 m_CPM <- sweep(m, MARGIN = 2, STATS = scaling_factor, FUN = "*")
 m_loged <- log2(1 + (m_CPM/10))
 # removing genes with zero variance across all cells
 var_filter <- apply(m_loged, 1, var)
 m_proc <- m_loged[var_filter != 0, ]
 # filtering out lowly expressed genes
 exp_genes <- rownames(m_proc)[(rowMeans(m_proc) > 0.4)]
 m_proc <- m_proc[exp_genes, ]
 # output to a list
 per_sample_mat[[i]] <- m_proc
 names(per_sample_mat)[i] <- sample_ls[[i]]
 rm(path, files, m, m_CPM, m_loged, var_filter, exp_genes, m_proc)

#### co-localiztion
results<-list()
for(i in seq_along(names(all_decon))) {
  decon <- all_decon[[sample_ls[i]]]
  spot_list <- lapply(c(1:500),function(x){ #num. of shuffled matrices
    all_row <- sapply(c(1:dim(decon)[2]),function(c){
      new_row <- sample(c(1:length(row.names(decon))), length(row.names(decon)), replace = FALSE)
      return(new_row)
    })
    new_mat <- sapply(c(1:dim(decon)[2]),function(c){
      sh_row <- decon[,c][all_row[,c]]#generate many deconv matrices by shuffling cell types
      return(sh_row)
    })
    colnames(new_mat) <- colnames(decon)
    return(new_mat)
  })

  #run colocal_mat_fun -- perform colocalization on the shuffled decon matrices
  mats_list<- lapply(spot_list, function(new_decon){
    colocal_mats<-colocal_mat(new_decon)
    return(colocal_mats)
  })
  mean_mat <- sapply(mats_list,function(x){ #expected colocalization calculated from shuffled decon matrices
    return(x[,"ab_comb"])
  })
  pairs_shuf_mean <- apply(mean_mat,1,mean)
  names(pairs_shuf_mean) <- mats_list[[1]][,"pairs"]
  rownames(mean_mat) <- mats_list[[1]][,"pairs"]

  obs_coloc <- colocal_mat(decon)

  r1 = obs_coloc$ab_comb #observed colocal
  r2 = pairs_shuf_mean #expected colocal

  n = dim(decon)[1] #num total spots

  fisher = ((0.5*log((1+r1)/(1-r1)))-(0.5*log((1+r2)/(1-r2))))/((1/(n-3))+(1/(n-3)))^0.5

  p.value = (2*(1-pnorm(abs(as.matrix(fisher)))))
  effect_size <- r1/r2 #observed/expected
  results[[i]]<-data.frame(pvalue = p.value,
                           effect_size = effect_size)

}
names(results) <- sample_ls

results2<-lapply(results, dplyr::add_rownames, 'pairs')
results2<- lapply(results2,function(x){
  as.matrix(x)
})
results2 <- lapply(results2, function(x){rownames(x) <- x[,1]; x})
df <- do.call("rbind", results2)

###volcano plot (all pairs, all samples)###
df->results_comb2
results_comb2<-as.data.frame(results_comb2)
results_comb2$pvalue<-as.numeric(results_comb2$pvalue)
results_comb2$effect_size<-as.numeric(results_comb2$effect_size)
results_comb2$sig <- "NO"
results_comb2$sig[results_comb2$effect_size >= 1.3 & results_comb2$pvalue <= 0.01] <- "enriched"
results_comb2$sig[results_comb2$effect_size <= 0.7 & results_comb2$pvalue <= 0.01] <- "depleted"
results_comb2$label <- NA
results_comb2$label[results_comb2$sig != "NO"] <- results_comb2$pairs[results_comb2$sig != "NO"]

ggplot(data=results_comb2, aes(x=effect_size, y=-log10(pvalue), col=sig, label=label)) +
  geom_point() +
  theme_minimal() +
  geom_text_repel()+
  theme(text = element_text(size = 20))
### Adjacency  --------------------------------------------------------------

mp_assign <- readRDS("test.rds", sep = "")

all_zones <- readRDS("final_zones.rds")

extend_metadata <- tibble()
generate_metadata <- sapply(c(1:length(sample_ls)), function(i){
  print(sample_ls[i])

  # load data
  spots_positions <- read.csv("/test/outs/spatial/tissue_positions_list.csv", header = FALSE, stringsAsFactors = FALSE)

row.names(spots_positions) <- spots_positions$V1
spots_clusters <- readRDS("test.rds", sep = "")
spots_clusters <- na.omit(spots_clusters)
colnames(spots_clusters) <- c("barcodes", "spot_type")
row.names(spots_clusters)<- spots_clusters$barcodes


metadata <- tibble(Key = paste(sample_ls[i],spots_clusters$barcodes, sep="_"),
                     SpotID = spots_clusters$barcodes,
                     Sample = rep(sample_ls[i], nrow(spots_clusters)),
                     MPid = spots_clusters$spot_type,
                     array_row = spots_positions[spots_clusters$barcodes,"V3"],
                     array_col = spots_positions[spots_clusters$barcodes, "V4"],
                     pxl_in_rows = spots_positions[spots_clusters$barcodes, "V5"],
                     pxl_in_cols = spots_positions[spots_clusters$barcodes, "V6"],
                     Zone = as.character(all_zones[[i]][spots_clusters$barcodes]))

  extend_metadata <<- rbind.data.frame(extend_metadata, metadata)
})

set.seed(50)
neighbs_stats <- neighbor_spot_props(metadata = extend_metadata,
                                     zone = "All",
                                     #site = "All",
                                     samples = "All",
                                     #zone_by = "EpiStroma",
                                     n_cores = 30,
                                     plot_perm_distr = TRUE,
                                     n_perm = 10000,
                                     filter_signif = TRUE,
                                     zscore_thresh = 1)


# regional comp  (Previously run by server. Possible to run per sample below)----------------------------------------------------------

#!/usr/bin/env Rscript
#args = commandArgs(trailingOnly = TRUE)

#sname <- as.character(args[1])
#sname <- str_replace(sname, "\r", "")
#print(paste("I got the samp right", sname))

sname <- "" #insert sample name
gen_clusters <- as.character(unique(unlist(sapply(c(1:26), function(i){
mp_assign <- readRDS('test.rds')
return(unique(mp_assign$spot_type_meta_new))
}))))

max_win_size <- 15
pairs <- combn(sort(gen_clusters),2)
pairs_names <- apply(pairs, 2, function(x){return(paste(x[1],x[2], sep = " "))})

# load data
spots_positions <- read.csv("/test/outs/spatial/tissue_positions_list.csv", header = FALSE, stringsAsFactors = FALSE)
row.names(spots_positions) <- spots_positions$V1

spots_clusters <- readRDS('test.rds')
spots_clusters <- na.omit(spots_clusters)
colnames(spots_clusters) <- c("barcodes", "spot_type")
row.names(spots_clusters)<- spots_clusters$barcodes

neighbors_table <- prox_neighbors_table_func(spots_positions,spots_clusters)

all_spots <- spots_clusters$barcodes

all_pval_windows <- sapply(c(1:max_win_size), function(win_size){
  proximity <- t(sapply(all_spots, function(spot){
    win_spots <- c(spot)
    sapply(c(1:win_size), function(i){
      win_spots <<- unique(c(win_spots,unique(na.omit(as.character(neighbors_table[win_spots,])))))
    })
    win_abund <- table(spots_clusters$spot_type[spots_clusters$barcodes %in% win_spots])/sum(table(spots_clusters$spot_type[spots_clusters$barcodes %in% win_spots]))
    return(win_abund)
  }))

  old_clusters <- colnames(proximity)
  add_clusters <- gen_clusters[!gen_clusters %in% old_clusters]

  if (length(add_clusters) != 0){
    sapply(add_clusters,function(clust){
      proximity <<- cbind(proximity,rep(0,dim(proximity)[1]))
    })
    colnames(proximity)[c((length(old_clusters)+1):dim(proximity)[2])] <- add_clusters
  }

  proximity <- proximity[,sort(colnames(proximity))]

  is_one <- apply(proximity,1,function(ro){
    return(1 %in% ro )
  })

  proximity <- proximity[!is_one,]

  all_cor <- sapply(c(1:dim(pairs)[2]), function(j){
    pair_cor <- cor(proximity[,pairs[1,j]], proximity[,pairs[2,j]])
    return(pair_cor)
  })

  all_cor <- data.frame(pair_cors = all_cor)
  row.names(all_cor) <- pairs_names
  return(all_cor)

})
sample_proximity <- as.data.frame(all_pval_windows)
row.names(sample_proximity) <- pairs_names


# regional comp random (Previously run by server. Possible to run per sample below) ---------------------------------------------------

#!/usr/bin/env Rscript
#args = commandArgs(trailingOnly = TRUE)

#sname <- as.character(args[1])
#sname <- str_replace(sname, "\r", "")

sname <- "" #insert sample name
gen_clusters <- as.character(unique(unlist(sapply(c(1:26), function(i){
 mp_assign <- readRDS('test.rds')
 return(unique(mp_assign$spot_type_meta_new))
}))))

max_win_size <- 15
pairs <- combn(sort(gen_clusters),2)
pairs_names <- apply(pairs, 2, function(x){return(paste(x[1],x[2], sep = " "))})
rand_num <- 500

# load data
spots_positions_orign <- read.csv("/test/outs/spatial/tissue_positions_list.csv", header = FALSE, stringsAsFactors = FALSE)
row.names(spots_positions_orign) <- spots_positions_orign$V1

spots_clusters <- readRDS("test.rds", sep = "")
spots_clusters <- na.omit(spots_clusters)
colnames(spots_clusters) <- c("barcodes", "spot_type")
row.names(spots_clusters)<- spots_clusters$barcodes

all_rand <- lapply(c(1:rand_num),function(j){
  new_pos_all <- sample(spots_positions_orign$V1[spots_positions_orign$V2 != 0], length(spots_positions_orign$V1[spots_positions_orign$V2 != 0]), replace = FALSE)
  spots_positions <- spots_positions_orign
  spots_positions$V1[spots_positions$V2 != 0] <- new_pos_all

  neighbors_table <- prox_neighbors_table_func(spots_positions,spots_clusters)

  all_spots <- spots_clusters$barcodes


  all_pval_windows <- sapply(c(1:max_win_size), function(win_size){
    proximity <- t(sapply(all_spots, function(spot){
      win_spots <- c(spot)
      sapply(c(1:win_size), function(i){
        win_spots <<- unique(c(win_spots,unique(na.omit(as.character(neighbors_table[win_spots,])))))
      })
      win_abund <- table(spots_clusters$spot_type[spots_clusters$barcodes %in% win_spots])/sum(table(spots_clusters$spot_type[spots_clusters$barcodes %in% win_spots]))
      return(win_abund)
    }))

    old_clusters <- colnames(proximity)
    add_clusters <- gen_clusters[!gen_clusters %in% old_clusters]

    if (length(add_clusters) != 0){
      sapply(add_clusters,function(clust){
        proximity <<- cbind(proximity,rep(0,dim(proximity)[1]))
      })
      colnames(proximity)[c((length(old_clusters)+1):dim(proximity)[2])] <- add_clusters
    }

    proximity <- proximity[,sort(colnames(proximity))]

    is_one <- apply(proximity,1,function(ro){
      return(1 %in% ro )
    })

    proximity <- proximity[!is_one,]

    all_cor <- sapply(c(1:dim(pairs)[2]), function(j){
      pair_cor <- cor(proximity[,pairs[1,j]], proximity[,pairs[2,j]])
      return(pair_cor)
    })

    all_cor <- data.frame(pair_cors = all_cor)
    row.names(all_cor) <- pairs_names
    return(all_cor)

  })
  sample_proximity <- as.data.frame(all_pval_windows)
  row.names(sample_proximity) <- pairs_names
  return(sample_proximity)
})
sample_mean_rand_prox <- Reduce("+", all_rand) / length(all_rand)

sample_sd_rand_prox <- round(apply(array(unlist(all_rand), c(length(pairs_names), max_win_size, rand_num)), c(1,2), sd),4)


# regional comp downstream ------------------------------------------------

gen_clusters <- as.character(unique(unlist(sapply(c(1:26), function(i){
  mp_assign <- readRDS('test.rds')
  return(unique(mp_assign$spot_type_meta_new))
}))))

pairs <- combn(sort(gen_clusters),2)
pairs_names <- apply(pairs, 2, function(x){return(paste(x[1],x[2], sep = " "))})
all_zones <- readRDS("Spatial_coh_zones/spatial_zonesv3.rds")

all_proximity_list <- list.files("Spatial_coh_zones/proximity_samples/")

all_proximity <- lapply(all_proximity_list, function(prox){
  samp_prox <- readRDS('test.rds')
  return(samp_prox)
})
names(all_proximity) <- sapply(str_split(all_proximity_list, "_"), function(x){return(x[1])})

all_proximity_rand_list <- list.files("Spatial_coh_zones/proximity_rand_samples/")

all_proximity_rand <- lapply(all_proximity_rand_list, function(prox){
  samp_prox <- readRDS('test.rds')
  return(samp_prox)
})
names(all_proximity_rand) <- sapply(str_split(all_proximity_rand_list, "_"), function(x){return(x[1])})


combined_proximity <- t(sapply(c(1:length(pairs_names)), function(i){
  pair_prox <- sapply(all_proximity, function(x){
    pair_sample_df <- as.data.frame(x[i,c(1:15)])
    colnames(pair_sample_df) <- c(as.character(c(1:15)))
    return(pair_sample_df)
  })
  return(apply(pair_prox,1,function(x){mean(na.omit(as.numeric(x)))}))
}))

row.names(combined_proximity) <- row.names(all_proximity[[1]])


Heatmap(na.omit(combined_proximity), cluster_columns = FALSE, column_title = "Metaprograms Proximity",
        row_names_gp = grid::gpar(fontsize = 5), name = "proximity", show_row_names = T, show_row_dend = F)
# regional comp downstream significant ---------------------------------------------------

spots_numv1 <-sapply(samp_list, function(smp){
  samp_df <- readRDS('test.rds')
  return(nrow(samp_df))
})
names(spots_numv1) <- sapply(str_split(names(spots_numv1), "\\."), function(x){return(x[1])})

spots_num <-sapply(samp_list, function(smp){
samp_df <- readRDS('test.rds')
pairs_n <- sapply(c(1:ncol(pairs)),function(p){
p_table <- samp_df[samp_df$spot_type_meta_new %in% c(pairs[,p]),]
return(nrow(p_table))
  })
  return(pairs_n)
})
colnames(spots_num) <- sapply(str_split(colnames(spots_num), "\\."), function(x){return(x[1])})


proximity_bin <- lapply(c(1:26),function(i){
  r1 = all_proximity[[i]]
  r2 = all_proximity_rand[[i]]

  n_df = as.data.frame(spots_num[,names(all_proximity)[i]])
  n_df <- cbind(n_df, rep(n_df,14))

  fisher = ((0.5*log((1+r1)/(1-r1)))-(0.5*log((1+r2)/(1-r2))))/((1/(n_df-3))+(1/(n_df-3)))^0.5

  p.value = (2*(1-pnorm(abs(as.matrix(fisher)))))
  colnames(p.value) <- as.character(1:15)
  bin_pval <- ifelse(p.value < 0.0000000001,1,NA)
  #  bin_pval <- ifelse(p.value < 0.00001,1,0)
  rbin <- r1*bin_pval
  return(rbin)
})
names(proximity_bin) <- names(all_proximity)
生活很好,有你更好


 1072
1072

 被折叠的 条评论
为什么被折叠?
被折叠的 条评论
为什么被折叠?
 到【灌水乐园】发言


