


#生成随机颜色
> randomColor <- function() {
paste0("#",paste0(sample(c(0:9, letters[1:6]), 6, replace = TRUE),collapse = ""))
}
# 生成100个随机颜色
> randomColors <- replicate(100,randomColor())
> seurat=readRDS("seurat.rds")#读取数据
#归一化
> all.genes <- rownames(seurat)
> seurat <- ScaleData(seurat, features = all.genes)
# PCA降维
> seurat <- Seurat::RunPCA(seurat, features = VariableFeatures(object = seurat))
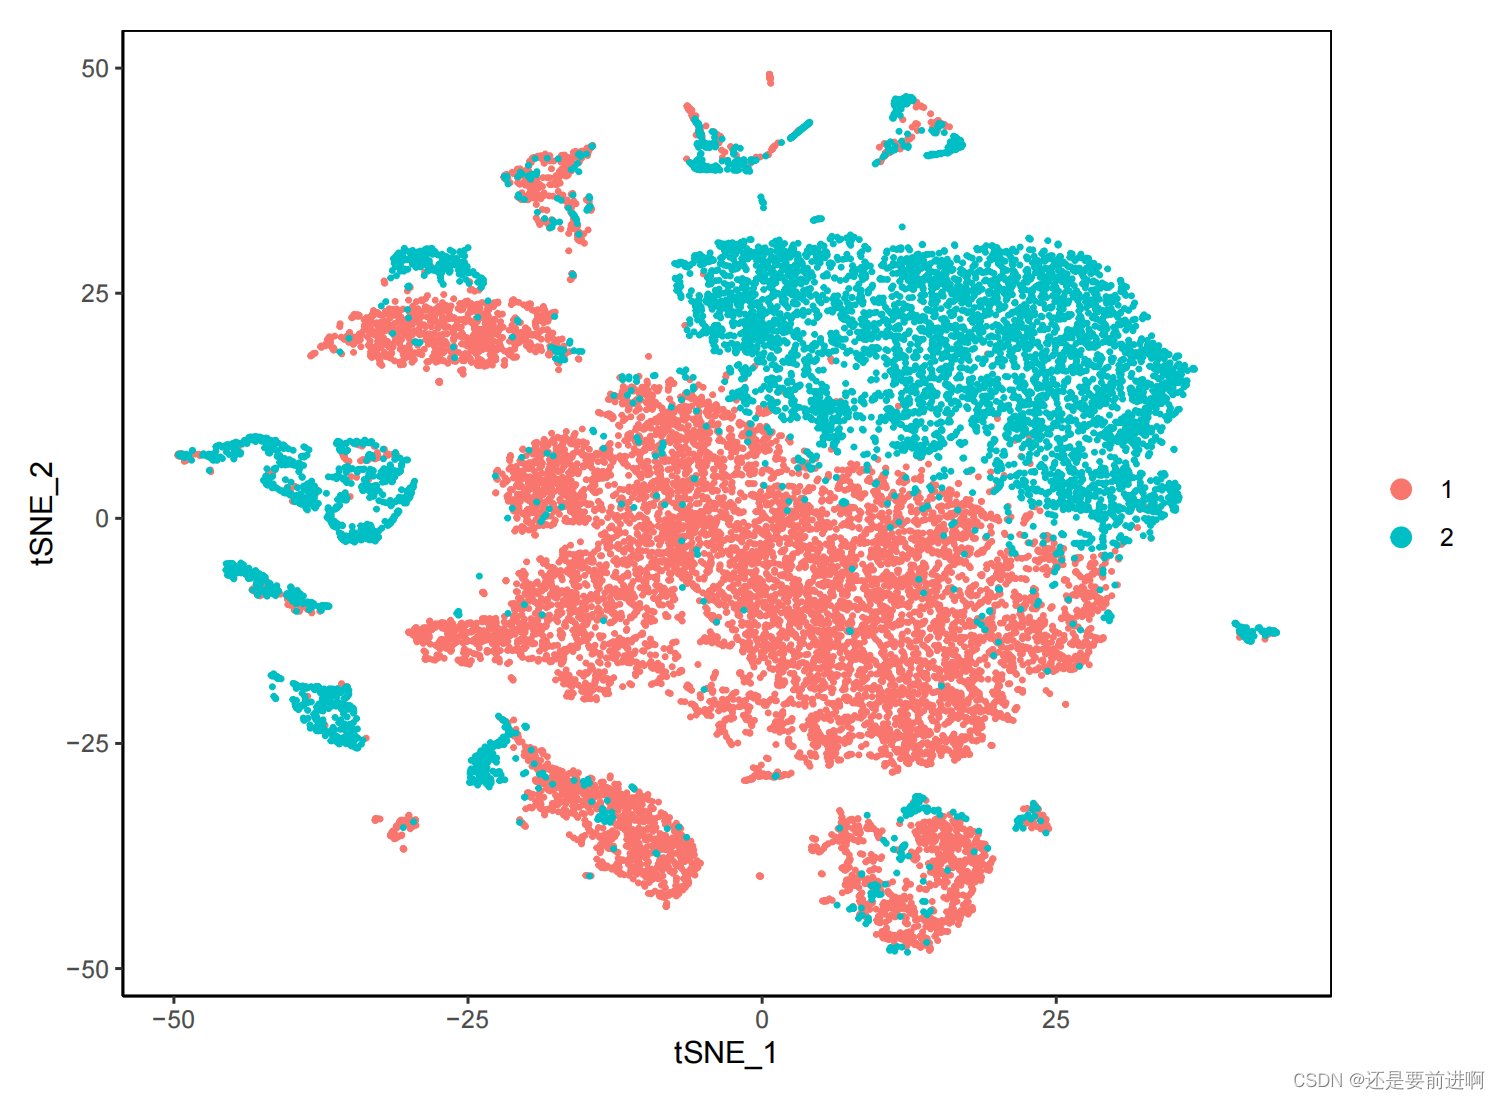
> seurat <- Seurat::RunTSNE(seurat,dims = 1:20)
> pdf(file = "降维tsne图.pdf",width =7.5,height = 5.5)
> DimPlot(seurat, reduction = "tsne",pt.size = 0.5)+theme_classic()+theme(panel.border = element_rect(fill=NA,color="black", size=0.5, linetype="solid"),legend.position = "right") #top为图列位置最上方,除此之外还有right、left、bottom(意思同英文)
> dev.off()
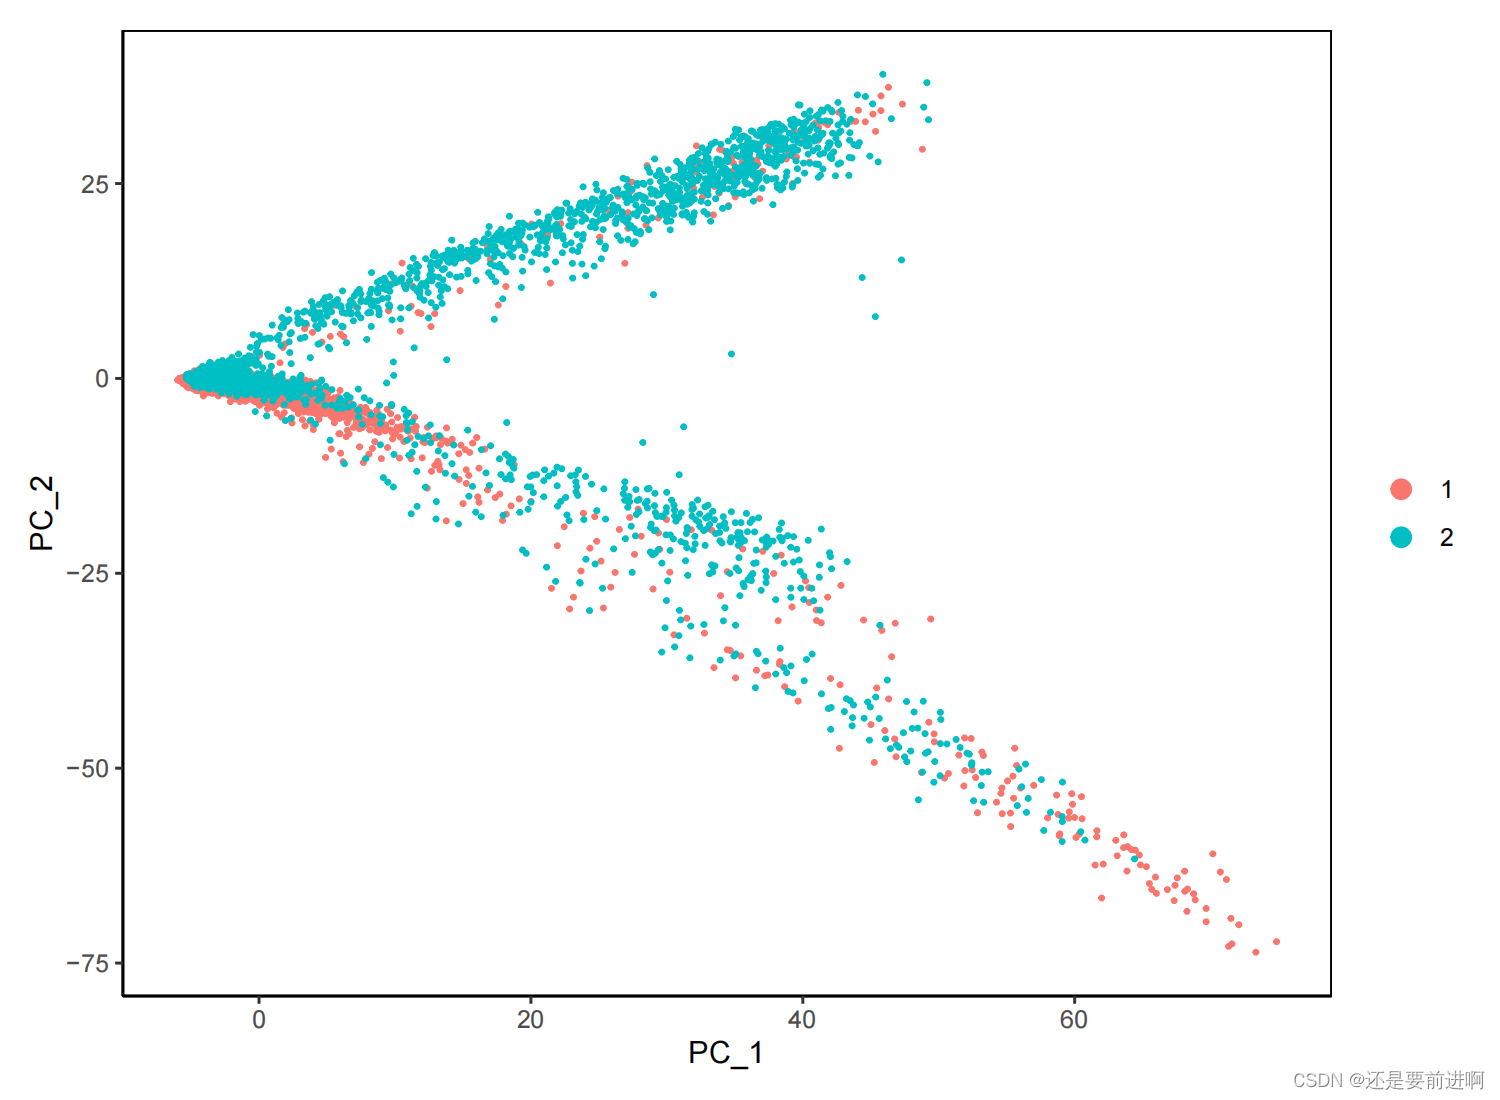
> pdf(file = "降维pca图.pdf",width =7.5,height = 5.5)
> DimPlot(seurat, reduction = "pca",pt.size = 0.5)+theme_classic()+theme(panel.border = element_rect(fill=NA,color="black", size=0.5, linetype="solid"),legend.position = "right")
> dev.off()
> colaa=distinctColorPalette(100)
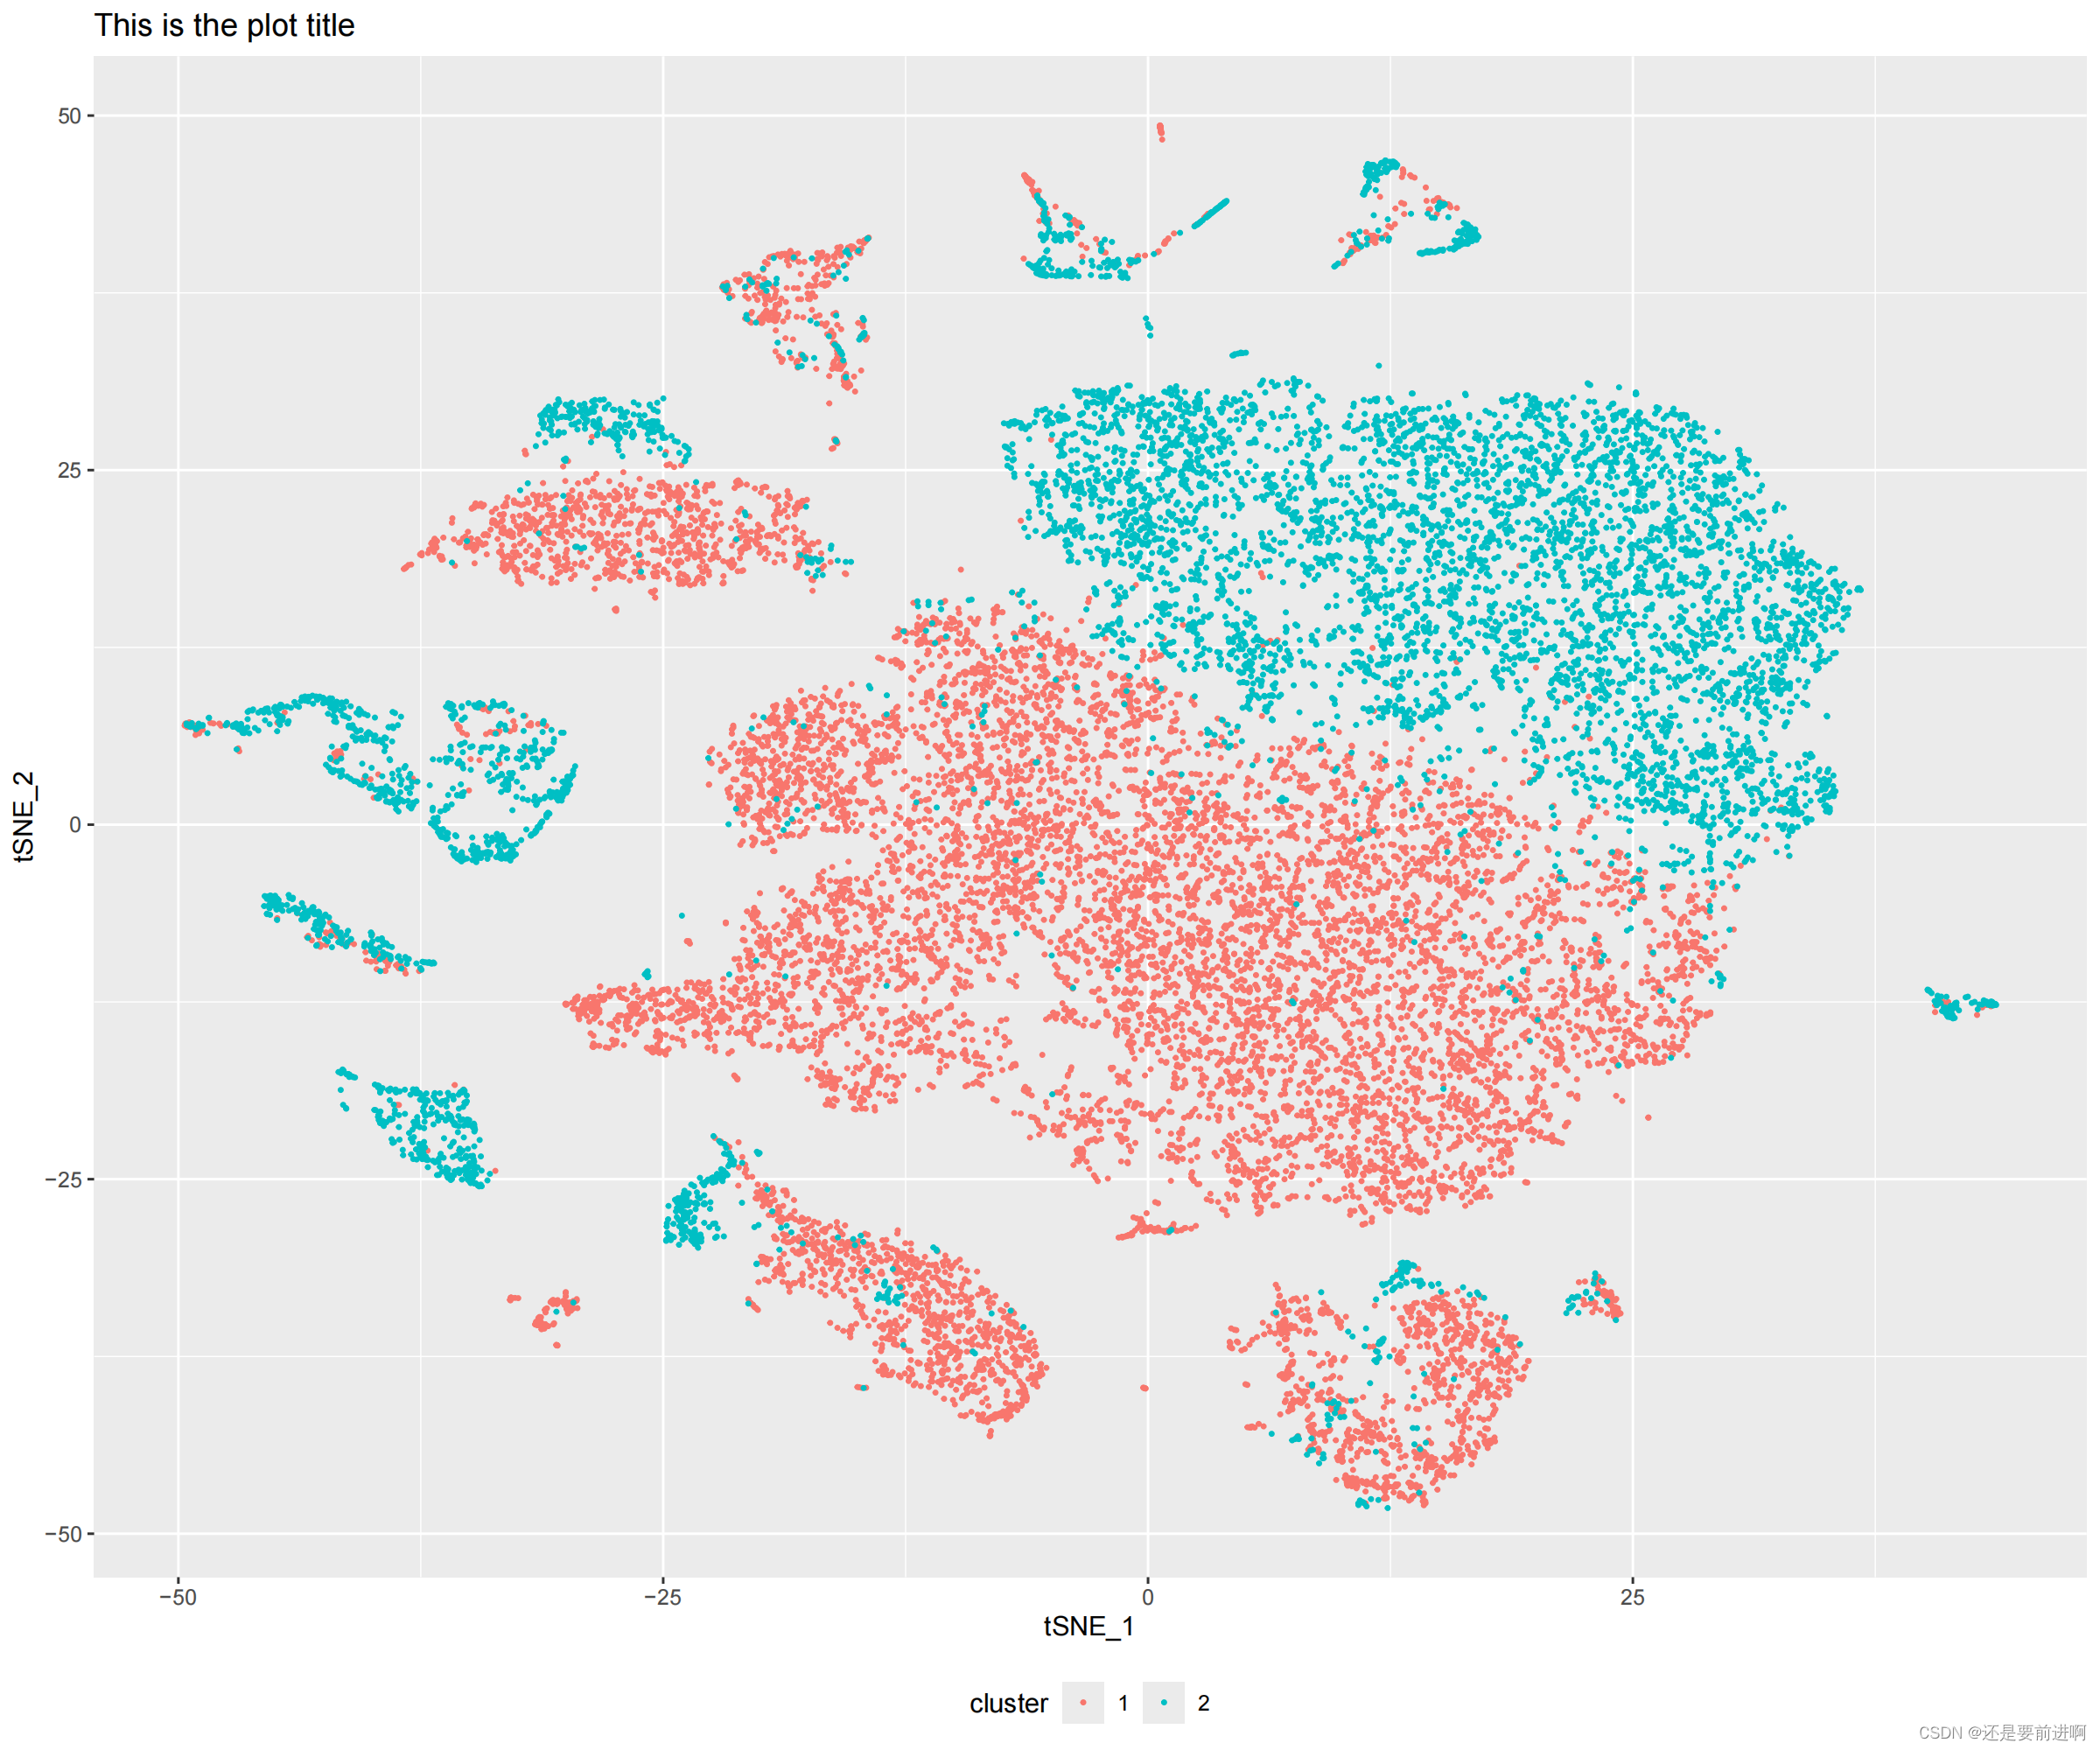
> pdf(file = "降维tsne单样品分布图.pdf",width =12,height = 10)
> coords <- as.data.frame(seurat@reductions$tsne@cell.embeddings[, c(1, 2)])
> names(coords) <- c("tSNE_1", "tSNE_2")
# 添加聚类信息
> coords$cluster <- seurat@meta.data$Type
# 绘制 t-SNE 图
> ggplot(coords, aes(x = tSNE_1, y = tSNE_2, color = cluster)) +
geom_point(size = 0.5) +
ggtitle("This is the plot title") +
theme(legend.position = "bottom")
> dev.off()
#harmony 去批次
> seurat <- RunHarmony(seurat, group.by.vars = "Type")
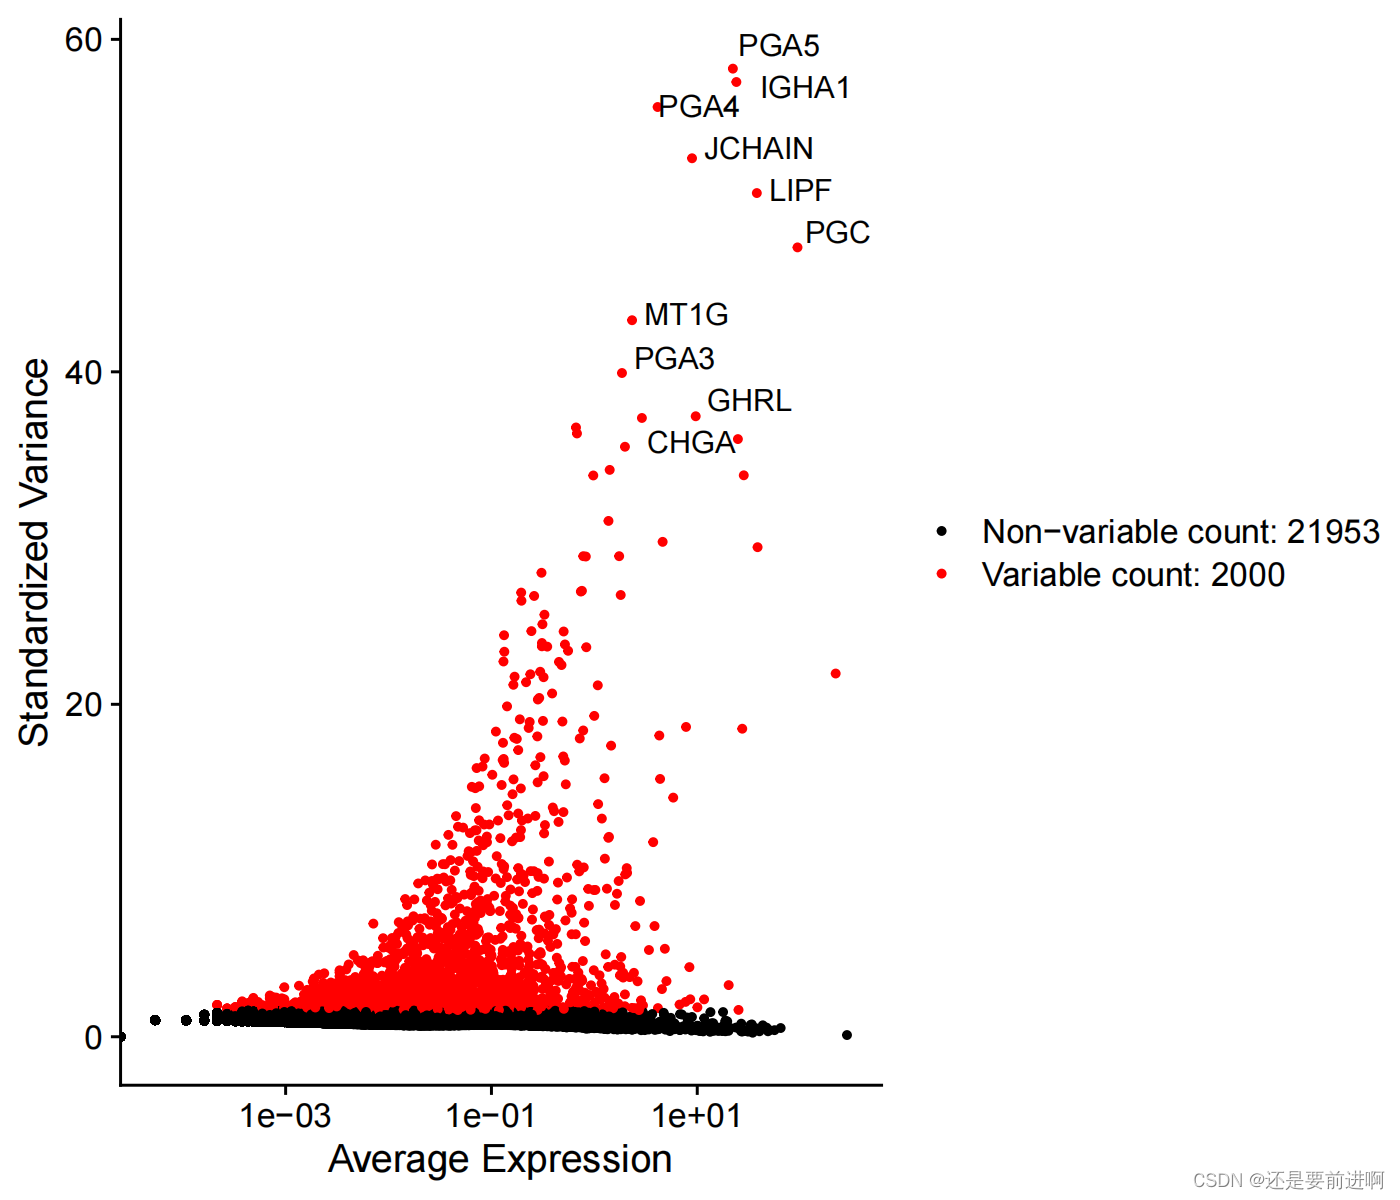
## 鉴定高变基因(由于去除了存在批次的细胞,高变基因可能会发生改变,因此需要重新鉴定高变基因)
> seurat <- FindVariableFeatures(seurat, selection.method = "vst", nfeatures = 2000)
# 提取前10的高变基因
> top10 <- head(VariableFeatures(seurat), 10)
# 展示高变基因
> plot1 <- VariableFeaturePlot(seurat)
> plot1
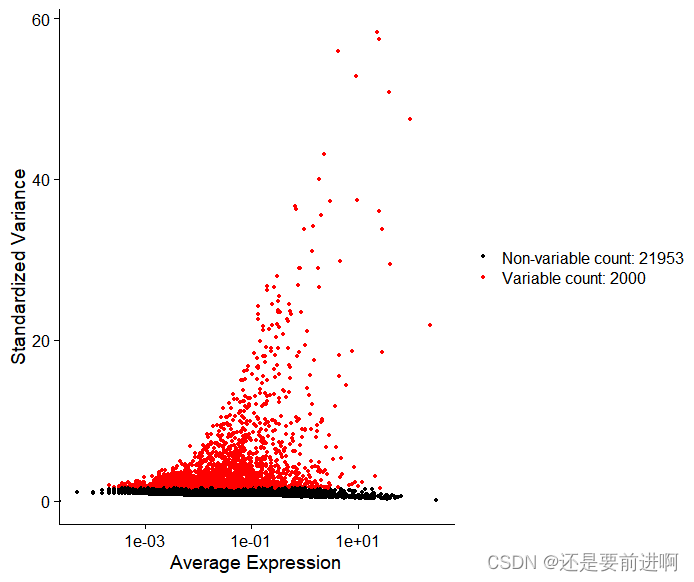
> plot2 <- LabelPoints(plot = plot1, points = top10, repel = TRUE)
> pdf(file = "去批次后鉴定高变基因.pdf",width =7,height = 6)
> plot2
> dev.off()
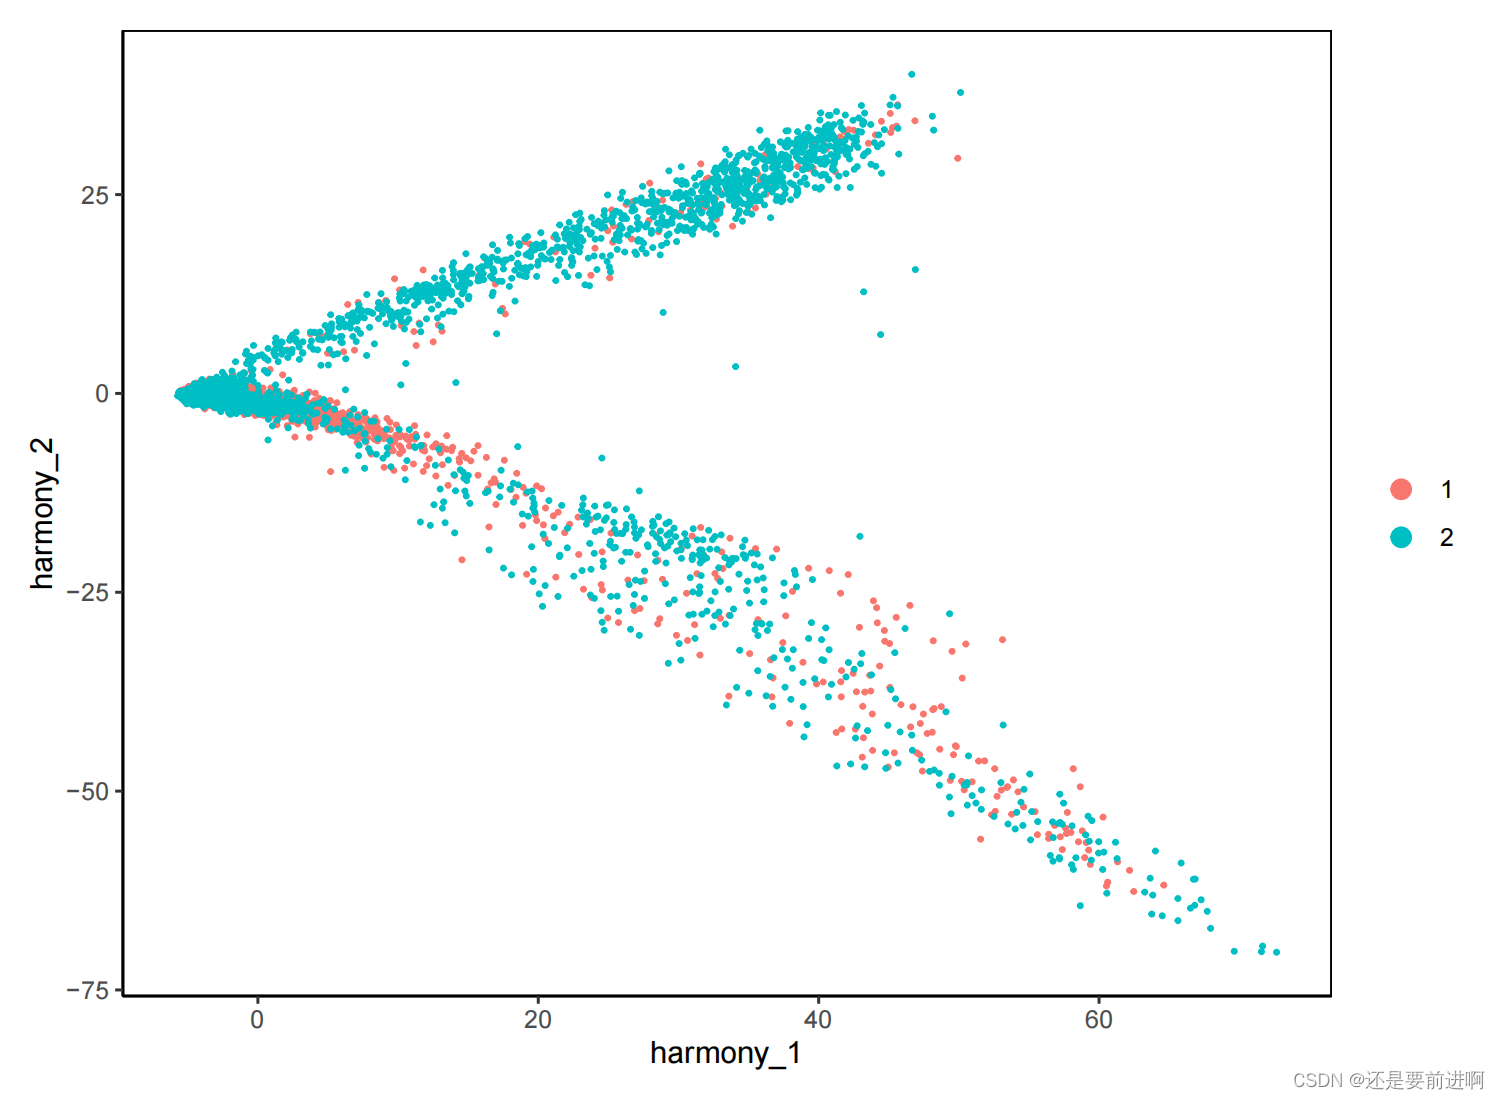
#降维可视化
> pdf(file = "harmony去批次pca图.pdf",width =7.5,height = 5.5)
> DimPlot(seurat, reduction = "harmony",pt.size = 0.5)+theme_classic()+theme(panel.border = element_rect(fill=NA,color="black", size=0.5, linetype="solid"),legend.position = "right")
> dev.off()
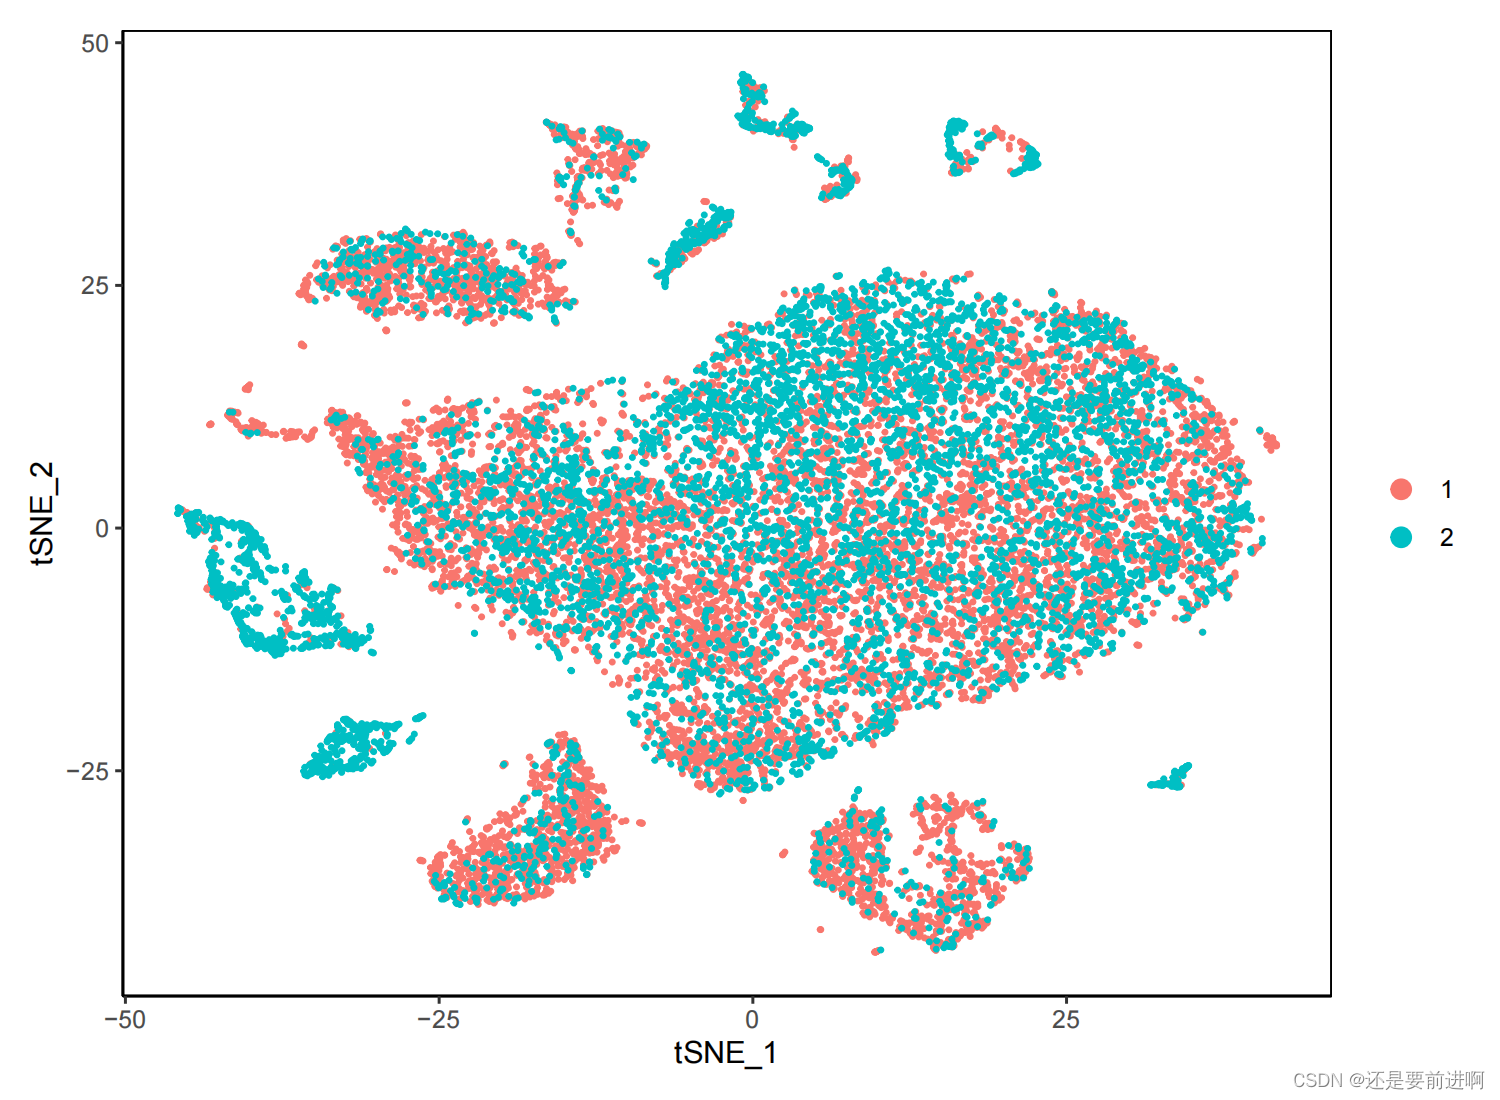
> seurat <- Seurat::RunTSNE(seurat,dims = 1:20,reduction ='harmony')
> pdf(file = "去批次后tsne图.pdf",width =7.5,height = 5.5)
> DimPlot(seurat, reduction = "tsne",pt.size = 0.5)+theme_classic()+theme(panel.border = element_rect(fill=NA,color="black", size=0.5, linetype="solid"),legend.position = "right")
> dev.off()
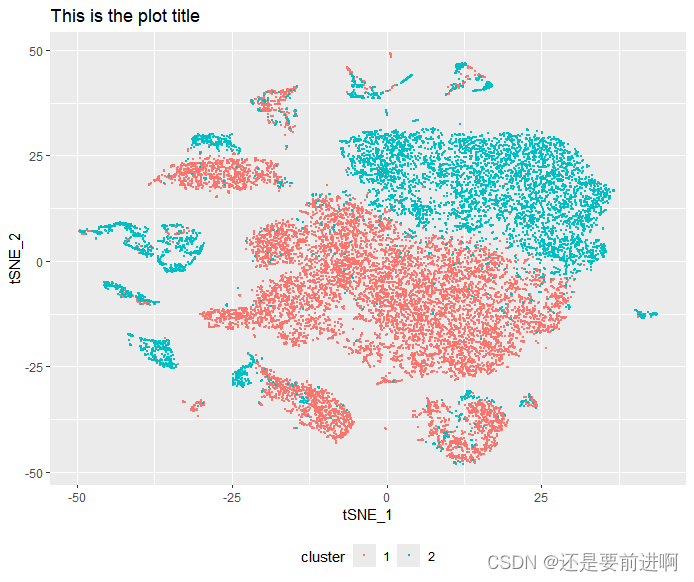
> pdf(file = "去批次后tsne单样本分布图.pdf",width =12,height = 7.5)
# 添加聚类信息
> coords$cluster <- seurat@meta.data$Type
# 绘制 t-SNE 图
> ggplot(coords, aes(x = tSNE_1, y = tSNE_2, color = cluster)) +
geom_point(size = 0.5) +
ggtitle("This is the plot title") +
theme(legend.position = "bottom")
> dev.off()
#绘制去批次后tsne单样本分布图
> ggplot(coords, aes(x = tSNE_1, y = tSNE_2, color = cluster)) +
geom_point(size = 0.5) +
ggtitle("This is the plot title") +
theme(legend.position = "bottom")
学习交流


 1970
1970


 被折叠的 条评论
为什么被折叠?
被折叠的 条评论
为什么被折叠?
 到【灌水乐园】发言


