


图像噪声是指存在于图像数据中的不必要的或多余的干扰信息。噪声的存在严重影响了图像的质量,而模型遇到噪声是很容易被干扰的,这很有可能会使得训练出来的模型指标和实际效果差。当我们需要对图像进行预处理工作时,就需要作去噪工作。本文简述常见的图像噪声种类、场景以及对应代码,解决之策,有需要补充的地方欢迎小伙伴们提出建议与意见。
1.常见的图像噪点的种类
图像噪点是指在图像中不期望出现的随机变化,这些变化可以由多种因素引起,比如传感器限制、长时间曝光、高ISO设置或信号传输中的干扰。根据其特性,图像噪点主要可以分为以下八种常见类型:
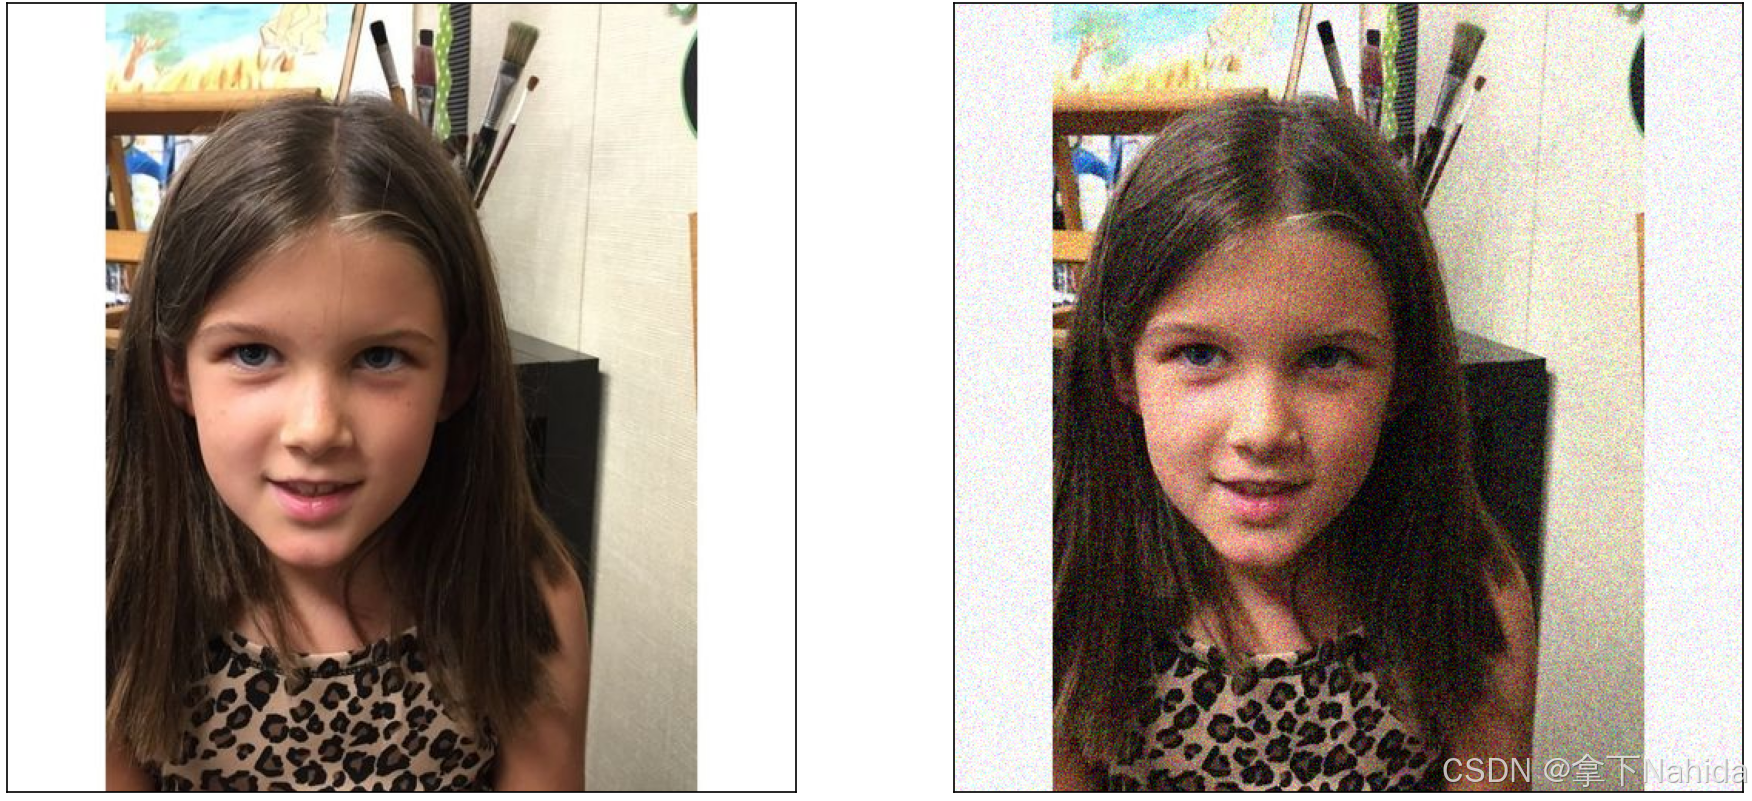
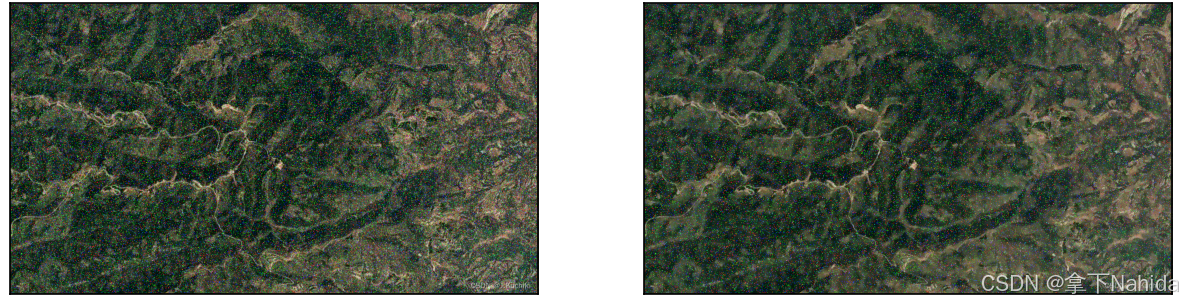
a.高斯噪声
这是最常见的一种噪点,它的幅度符合高斯分布。通常在模拟到数字转换过程中引入。例如,使用数码相机或手机拍照时,特别是在光线不足的情况下提高ISO值拍摄的照片中最为常见。这种噪声是由于传感器和电子电路中的热能随机波动造成的。
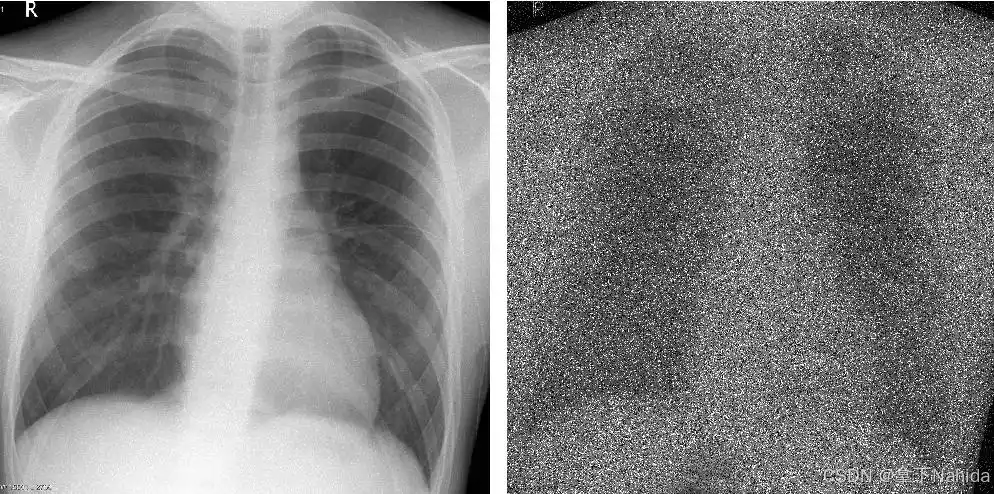
b.椒盐噪声
椒盐噪声也称为脉冲噪声。这种噪点表现为图像中随机分布的非常亮(255,理解为盐)或非常暗(0,理解为胡椒)的像素点,因此可以理解为在图像上撒了“盐”和“胡椒”。椒盐噪声可能出现在老旧电视屏幕、损坏的视频信号传输线或者不良的图像采集卡输出的图像上。同时,图像文件受损也可能导致此类噪点出现。

c.散粒噪声
又称泊松噪声,主要由光子到达图像传感器的数量随机性引起,在比较暗的条件下尤其明显。比如,在天文摄影等需要长时间曝光捕捉微弱光源的情境下容易显现。同时,在任何低光环境下的摄影都有可能出现此类型的噪点。
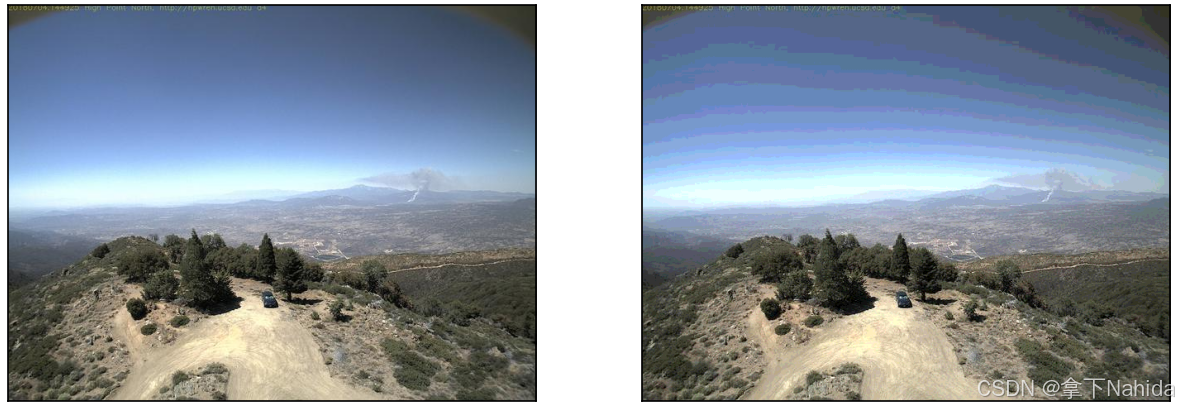
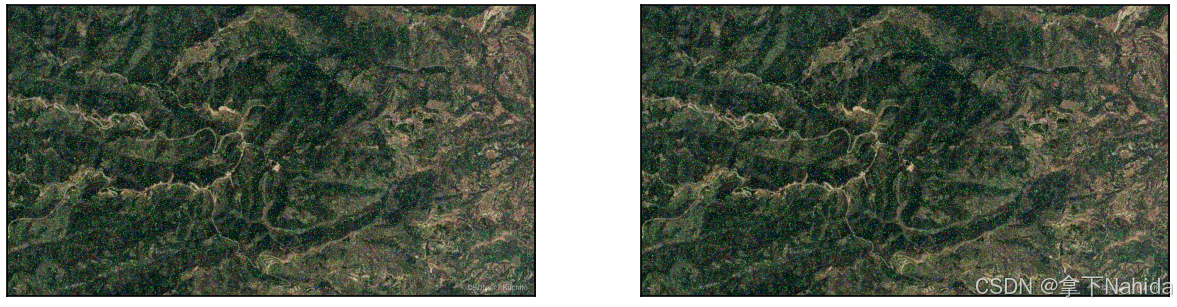
d.量化噪声
当模拟信号被数字化时,由于量化过程而产生的误差。例如,将模拟图像转换为数字格式(如扫描旧照片或底片)时,如果使用的位深度不够,则可能会引入量化噪声。
可以理解为,此时你打算用一台老式扫描仪扫描一张照片。需要经过以下流程:
先把照片放在扫描仪上,启动扫描->扫描仪开始工作,照片上的信息通过镜头传入传感器,在扫描仪内部产生连续变化的电流信号->电流信号被转化为数字信号->保存数字信号,存储图像
在电流信号被转化为数字信号的转换过程中,会根据设定的位深度对模拟信号进行量化。如果使用的位深度较低(比如8位),那么每个亮度级别的表示精度就会降低,导致一些细微的亮度差异无法准确表达,这就是量化误差。对于8位扫描仪,其只允许输入0-2^8-1(即255)个不同的亮度级别,当照片上的颜色相近且平滑变化(如逐渐变色,但色差很小)时,会导致色带现象,在图像上产生阶梯状的色素块。在某些颜色平滑渐变的区域或者在高对比度的地方看起来就会令人觉得有些不自然,或者颜色变化程度较大。
e.周期性噪声
这是由电子设备中的交流电源干扰等引起的,会在频域中表现为特定频率的峰值。周期性噪声通常由电力供应系统的交流电干扰引起,比如在某些老式监控摄像头或电视机上可以看到水平条纹或滚屏现象。
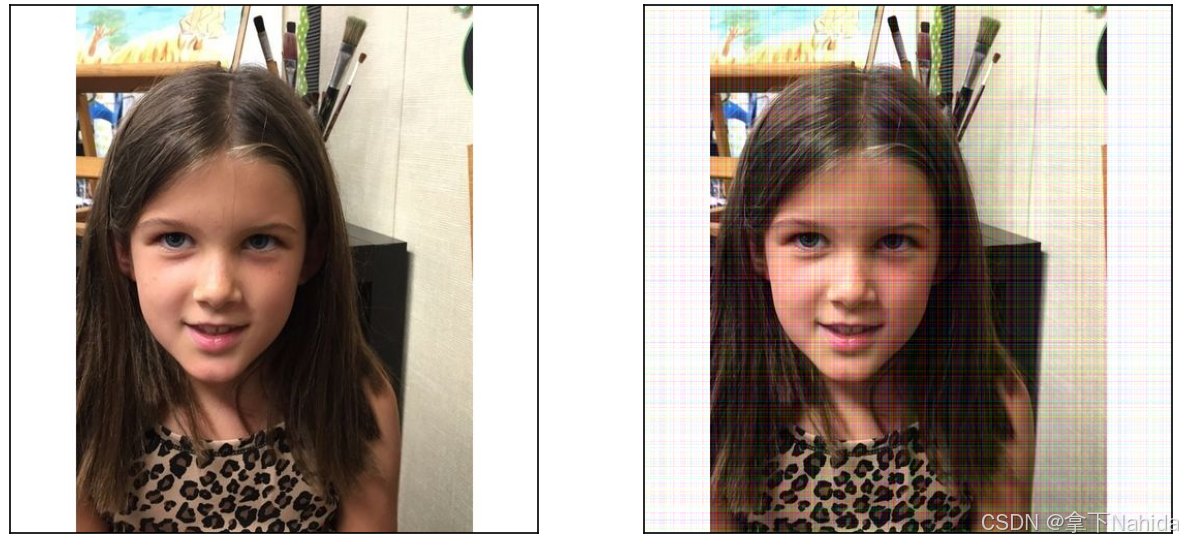
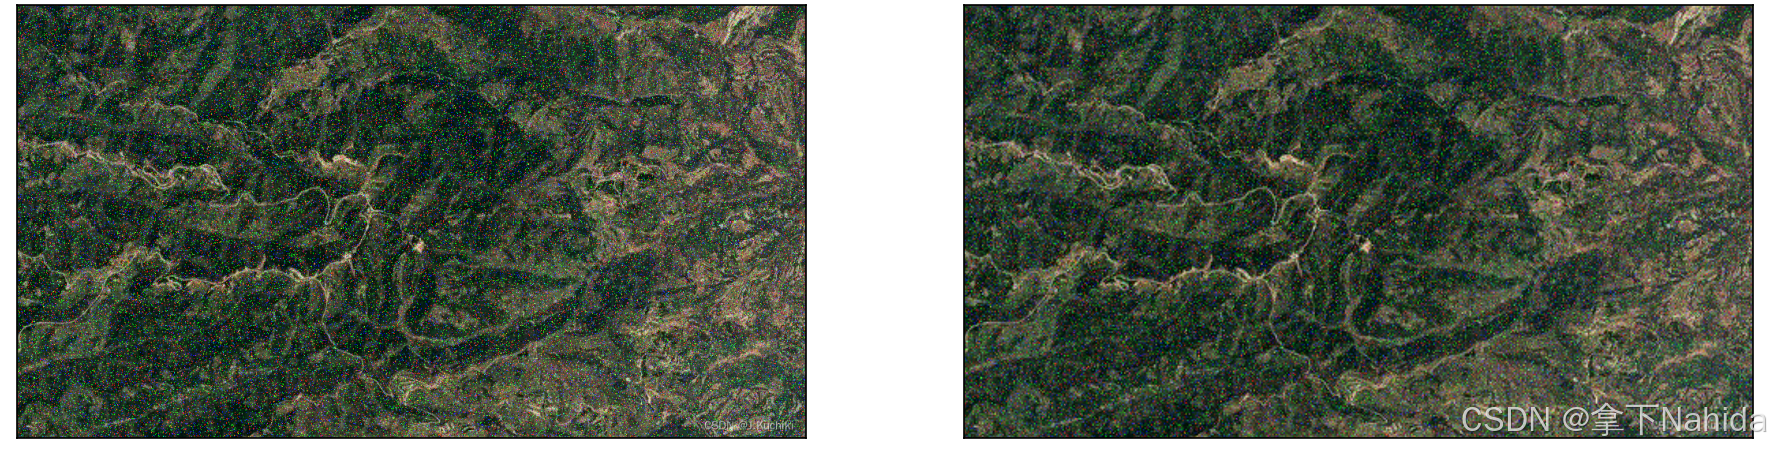
f.固定模式噪声
包括垂直条纹噪声和水平条纹噪声,通常是由图像传感器的非均匀响应造成的。这种噪点在一些低质量或过热作业的摄像头中比较明显,尤其是在黑暗环境中拍摄时,可以观察到连续的垂直或水平条纹。
g.热噪声
长时间曝光或者高温环境下,传感器即使没有接收到光也会产生电流,从而导致噪点。
常出现于长时间曝光的夜间摄影、红外摄影或者其他高温环境下工作的成像设备中。随着温度升高,传感器内部产生的暗电流增加,从而加剧了噪点的产生。
h.读出噪声
来自于传感器将电荷转换为电压以及后续放大和模数转换的过程中。
读出几乎存在于所有的数字图像采集过程中,尤其是对于那些对灵敏度要求较高的科学仪器来说,即使是正常光照条件下的拍摄也难以完全避免。
每种类型的噪点都有不同的特性和处理方法。在图像处理和计算机视觉领域,降噪是一个重要的预处理步骤,用以提高图像质量和后续分析的准确性。
2.常见的图像去噪方法
在硬件方面减少噪声通常更换传感器、采用更高精度的设备,显而易见的是成本易被提高。在软件方面则常用去噪算法。
常见的去噪方法如下:
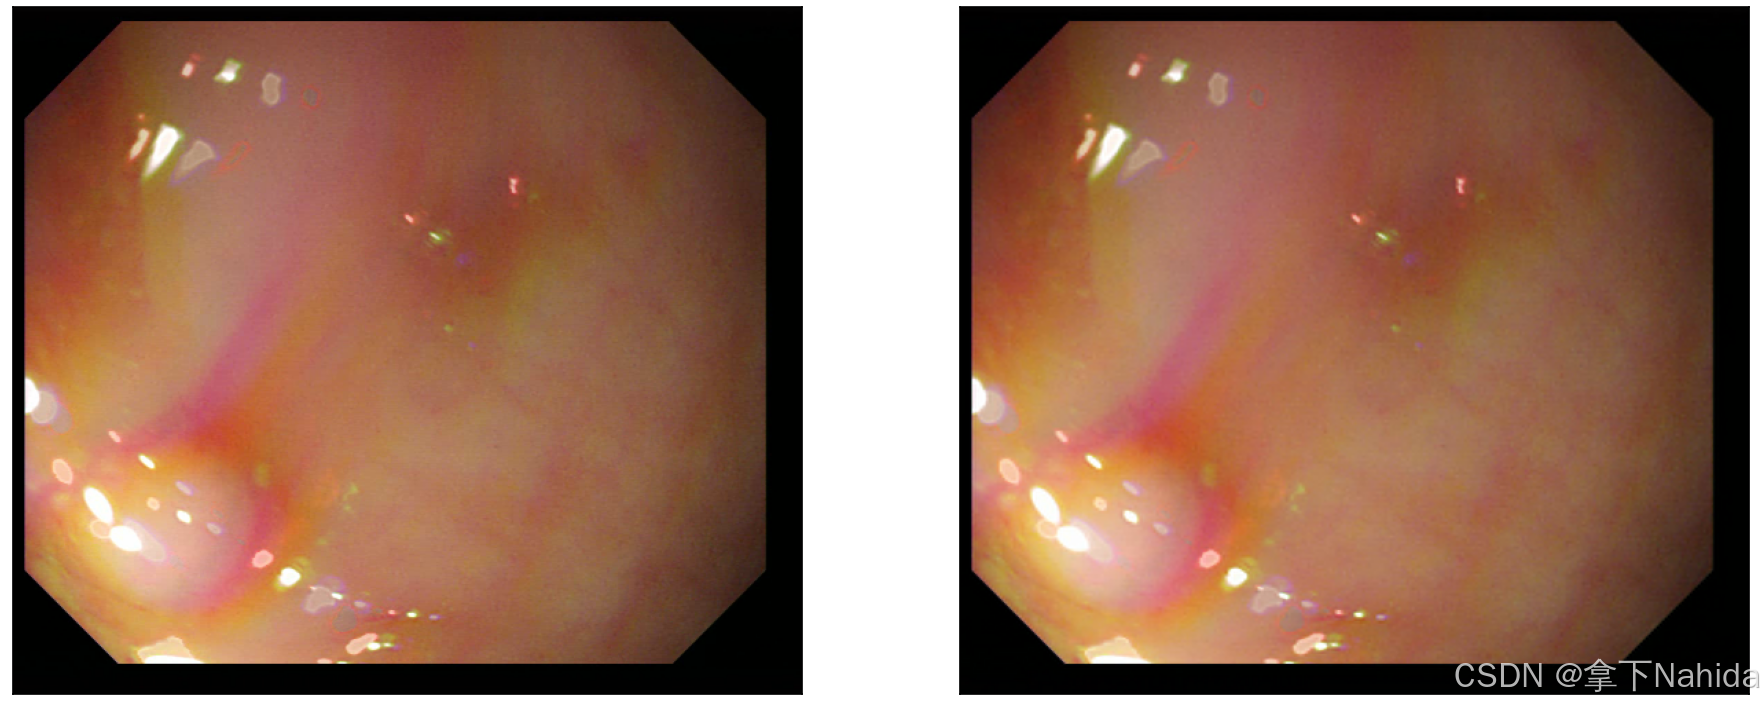
a.均值滤波
均值滤波是最简单的线性平滑滤波方法,它通过计算窗口内所有像素的平均值来代替中心像素的值,以此达到去除噪声的效果。
实例图如下。

看起来显得变得更模糊了,图像的颜色区间变化不那么尖锐,这样把噪点作出处理的同时牺牲了一定清晰度。
b.高斯滤波
高斯滤波是一种加权平均滤波,其权重按照高斯分布进行分配,使得靠近中心点的像素有更大的权重。相比均值滤波,它可以更好地保持边缘信息
c.中值滤波
中值滤波是非线性的滤波方法,它用窗口内的中值替代中心像素的值,对于去除椒盐噪声特别有效,因为它可以很好地保留边缘和其他细节。

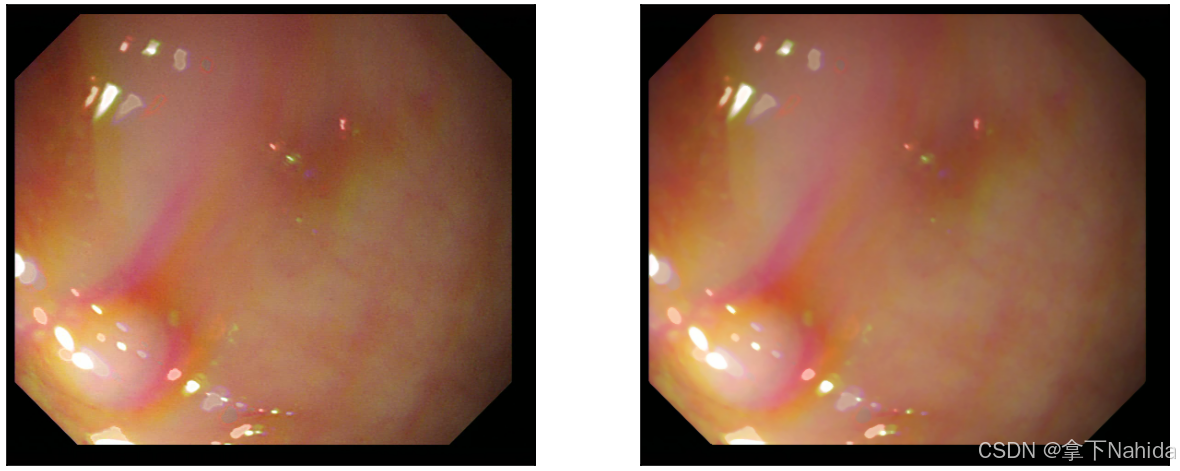
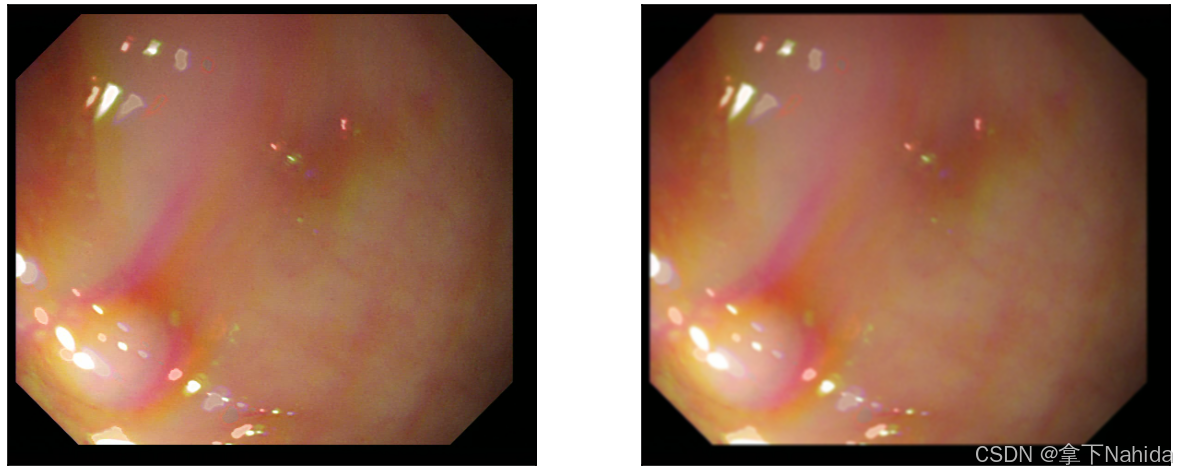
d.双边滤波
双边滤波在平滑图像的同时也考虑了像素的空间邻近性和强度相似性。因此,它可以有效地保护边缘,同时去除噪声。

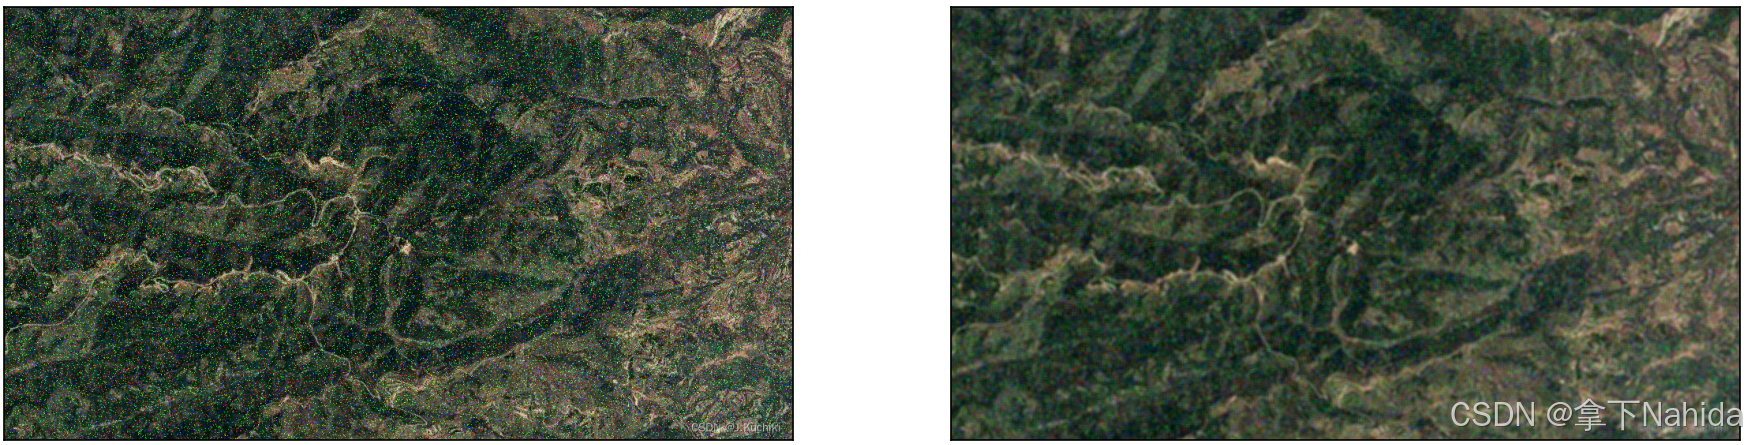
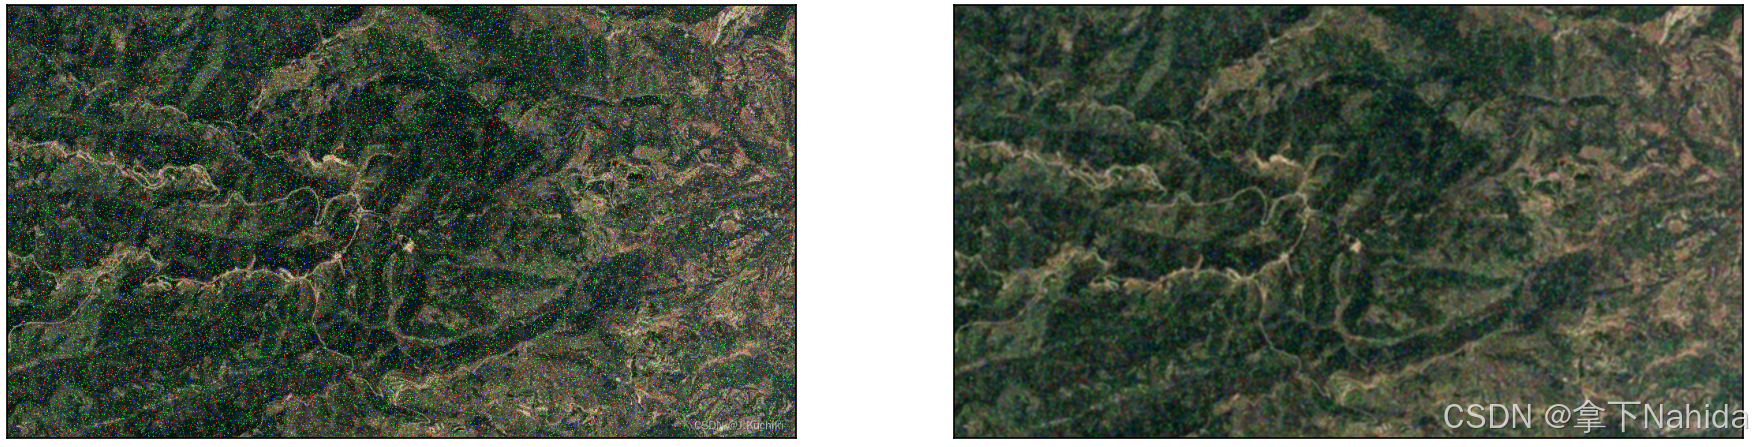
e.非局部均值滤波
NLM滤波基于这样一个假设:自然图像通常含有许多重复的模式。该算法通过寻找与当前块相似的所有其他块,并对它们取加权平均来估计每个像素的值。

f.自适应维纳滤波
维纳滤波是基于统计决策理论的最小均方误差准则设计的。自适应维纳滤波根据局部方差调整滤波参数,以优化不同区域的去噪效果。该方法在处理加性高斯白噪声(AWGN)时特别有效。
g.小波变换
小波变换将图像分解到不同的尺度上,在这些尺度上可以更容易地识别和去除噪声,然后重构图像以实现去噪。
h.导向滤波
导向滤波(Guided Filtering)是一种边缘保持的图像滤波方法,它使用一个引导图像来指导滤波过程,从而可以更精确地保持边缘信息。与双边滤波不同的是,导向滤波可以在不直接依赖于输入图像的情况下工作,这使得它可以处理更多种类的问题,如去雾、对比度增强等。
3.生成噪声的代码
由于网络数据较少,本文噪声图像生成代码如下。
a.高斯噪声
import cv2
import numpy as np
import matplotlib.pyplot as plt


def add_gaussian_noise(image, mean=0, sigma=25):
    """
    添加高斯噪声到图像。

    参数:
        image: 输入图像 (灰度或彩色)
        mean: 高斯噪声的均值,默认为0
        sigma: 高斯噪声的标准差,默认为25

    返回:
        noisy_image: 添加了高斯噪声后的图像
    """
    # Ensure the image is in float32 format and normalized to [0, 1]
    if len(image.shape) == 2:
        row, col = image.shape
        ch = 1
        img = image.astype(np.float32) / 255.0
    else:
        row, col, ch = image.shape
        img = image.astype(np.float32) / 255.0

    # Generate Gaussian noise
    gauss = np.random.normal(mean, sigma / 255.0, (row, col, ch))
    gauss = gauss.reshape(row, col, ch)

    # Add the Gaussian noise to the image
    noisy_image = img + gauss

    # Clip the values to stay within [0, 1] range and convert back to uint8
    noisy_image = np.clip(noisy_image, 0, 1)
    noisy_image = (noisy_image * 255).astype(np.uint8)

    return noisy_image


# Load an example image (grayscale or color)
image_path = 'person.jpg'  # Replace with your image path
image = cv2.imread(image_path)

# Convert BGR to RGB for displaying with matplotlib (if it's a color image)
if len(image.shape) == 3:
    image_rgb = cv2.cvtColor(image, cv2.COLOR_BGR2RGB)
else:
    image_rgb = image

# Add Gaussian noise to the image
noisy_image = add_gaussian_noise(image)

# Show the original and noisy images
plt.figure(figsize=(10, 5))
plt.subplot(121), plt.imshow(image_rgb, cmap='gray' if len(image.shape) == 2 else None), plt.title('Original Image')
plt.xticks([]), plt.yticks([])
plt.subplot(122), plt.imshow(cv2.cvtColor(noisy_image, cv2.COLOR_BGR2RGB) if len(image.shape) == 3 else noisy_image,
                             cmap='gray' if len(image.shape) == 2 else None), plt.title('Noisy Image')
plt.xticks([]), plt.yticks([])
plt.show()
b.椒盐噪声
import cv2
import numpy as np
import matplotlib.pyplot as plt


def add_salt_and_pepper_noise(image, salt_vs_pepper=0.5, amount=0.04):
    """
    添加椒盐噪声到图像。

    参数:
        image: 输入图像 (灰度或彩色)
        salt_vs_pepper: 盐与胡椒比例,默认为0.5
        amount: 噪声点占图像的比例,默认为0.04

    返回:
        noisy_image: 添加了椒盐噪声后的图像
    """
    # Ensure the image is in float32 format and normalized to [0, 1]
    img = image.astype(np.float32) / 255.0

    if len(image.shape) == 2:
        row, col = image.shape
        ch = 1
    else:
        row, col, ch = image.shape

    # Generate Salt '1' noise
    num_salt = np.ceil(amount * img.size * salt_vs_pepper)
    coords = [np.random.randint(0, i - 1, int(num_salt)) for i in img.shape[0:2]]
    img[coords[0], coords[1], :] = 1

    # Generate Pepper '0' noise
    num_pepper = np.ceil(amount * img.size * (1. - salt_vs_pepper))
    coords = [np.random.randint(0, i - 1, int(num_pepper)) for i in img.shape[0:2]]
    img[coords[0], coords[1], :] = 0

    # Convert back to uint8 without changing color space
    noisy_image = (img * 255).astype(np.uint8)

    return noisy_image


# Load an example image (grayscale or color)
image_path = 'person.jpg'  # Replace with your image path
image = cv2.imread(image_path)

# Add Salt and Pepper noise to the image
noisy_image = add_salt_and_pepper_noise(image)

# Show the original and noisy images
plt.figure(figsize=(10, 5))

# Convert BGR to RGB for display purposes only
plt.subplot(121), plt.imshow(cv2.cvtColor(image, cv2.COLOR_BGR2RGB)), plt.title('Original Image')
plt.xticks([]), plt.yticks([])
plt.subplot(122), plt.imshow(cv2.cvtColor(noisy_image, cv2.COLOR_BGR2RGB)), plt.title('Noisy Image')
plt.xticks([]), plt.yticks([])

plt.show()
c.量化噪声
import cv2
import numpy as np
import matplotlib.pyplot as plt


def apply_quantization_noise(image, levels=64):
    """
    应用量化噪声到图像。

    参数:
        image: 输入图像 (灰度或彩色)
        levels: 量化后的颜色级别,默认为64

    返回:
        quantized_image: 应用了量化噪声后的图像
    """
    # Ensure the image is in float32 format and normalized to [0, 1]
    img = image.astype(np.float32) / 255.0

    # Apply quantization by reducing the number of color levels
    if len(image.shape) == 2:
        # Grayscale image
        quantized_img = np.round(img * (levels - 1)) / (levels - 1)
    else:
        # Color image
        quantized_img = np.round(img * (levels - 1)) / (levels - 1)

    # Convert back to uint8
    quantized_image = (quantized_img * 255).astype(np.uint8)

    return quantized_image


# Load an example image (grayscale or color)
image_path = 'x.jpg'  # Replace with your image path
image = cv2.imread(image_path)

# Apply quantization noise to the image
quantized_image = apply_quantization_noise(image, levels=16)

# Show the original and quantized images
plt.figure(figsize=(10, 5))

# Convert BGR to RGB for display purposes only
plt.subplot(121), plt.imshow(cv2.cvtColor(image, cv2.COLOR_BGR2RGB)), plt.title('Original Image')
plt.xticks([]), plt.yticks([])
plt.subplot(122), plt.imshow(cv2.cvtColor(quantized_image, cv2.COLOR_BGR2RGB)), plt.title('Quantized Image')
plt.xticks([]), plt.yticks([])

plt.show()
d.固定模式噪声
import cv2
import numpy as np
import matplotlib.pyplot as plt


def add_fixed_pattern_noise(image, row_std=10, col_std=10):
    """
    添加固定模式噪声到图像。

    参数:
        image: 输入图像 (灰度或彩色)
        row_std: 行噪声的标准差
        col_std: 列噪声的标准差

    返回:
        noisy_image: 添加了固定模式噪声后的图像
    """
    if len(image.shape) == 2:
        # Grayscale image
        rows, cols = image.shape
        row_noise = np.random.normal(0, row_std, (rows, 1)).astype(np.int32)
        col_noise = np.random.normal(0, col_std, (1, cols)).astype(np.int32)
        noisy_img = image + row_noise + col_noise
    else:
        # Color image
        rows, cols, channels = image.shape
        row_noise = np.random.normal(0, row_std, (rows, 1, channels)).astype(np.int32)
        col_noise = np.random.normal(0, col_std, (1, cols, channels)).astype(np.int32)
        noisy_img = image + row_noise + col_noise

    # Clip the values to stay within [0, 255] range for uint8 images
    noisy_image = np.clip(noisy_img, 0, 255).astype(np.uint8)

    return noisy_image


# Load an example color or grayscale image
image_path = 'person.jpg'  # Replace with your image path
image = cv2.imread(image_path)

# Ensure the image is loaded correctly
if image is None:
    raise ValueError("Image not found or unable to load.")

# Add Fixed Pattern noise to the image
noisy_image = add_fixed_pattern_noise(image)

# Convert images from BGR to RGB for displaying using matplotlib
image_rgb = cv2.cvtColor(image, cv2.COLOR_BGR2RGB)
noisy_image_rgb = cv2.cvtColor(noisy_image, cv2.COLOR_BGR2RGB)

# Show the original and noisy images
plt.figure(figsize=(10, 5))
plt.subplot(121), plt.imshow(image_rgb), plt.title('Original Image')
plt.xticks([]), plt.yticks([])
plt.subplot(122), plt.imshow(noisy_image_rgb), plt.title('Noisy Image with Fixed Pattern Noise')
plt.xticks([]), plt.yticks([])
plt.show()
4.解决噪声的代码
a.均值滤波
import cv2
import numpy as np
import matplotlib.pyplot as plt


def apply_mean_filter(image, kernel_size=3):
    """
    应用均值滤波到图像。

    参数:
        image: 输入图像 (灰度或彩色)
        kernel_size: 滤波器窗口大小,默认为3x3

    返回:
        filtered_image: 应用了均值滤波后的图像
    """
    # Ensure the kernel size is odd and greater than 1
    if kernel_size % 2 == 0 or kernel_size <= 1:
        raise ValueError("Kernel size must be an odd integer greater than 1.")

    # Apply mean filter using OpenCV's blur function
    filtered_image = cv2.blur(image, (kernel_size, kernel_size))

    return filtered_image


# Load an example color or grayscale image with noise
image_path = '3.png'  # Replace with your noisy image path
image = cv2.imread(image_path)

# Ensure the image is loaded correctly
if image is None:
    raise ValueError("Image not found or unable to load.")

# Apply Mean Filter to the image
filtered_image = apply_mean_filter(image, kernel_size=5)  # You can change the kernel size as needed

# Convert images from BGR to RGB for displaying using matplotlib
image_rgb = cv2.cvtColor(image, cv2.COLOR_BGR2RGB)
filtered_image_rgb = cv2.cvtColor(filtered_image, cv2.COLOR_BGR2RGB)

# Show the original and filtered images
plt.figure(figsize=(10, 5))
plt.subplot(121), plt.imshow(image_rgb), plt.title('Noisy Image')
plt.xticks([]), plt.yticks([])
plt.subplot(122), plt.imshow(filtered_image_rgb), plt.title('Filtered Image with Mean Filter')
plt.xticks([]), plt.yticks([])
plt.show()
b.高斯滤波
import cv2
import numpy as np
import matplotlib.pyplot as plt


def apply_gaussian_filter(image, kernel_size=5, sigmaX=0):
    """
    应用高斯滤波到图像。

    参数:
        image: 输入图像 (灰度或彩色)
        kernel_size: 滤波器窗口大小,默认为5x5
        sigmaX: 高斯核在X方向的标准差;默认为0表示根据kernel_size自动计算

    返回:
        filtered_image: 应用了高斯滤波后的图像
    """
    # Ensure the kernel size is odd and greater than 1
    if kernel_size % 2 == 0 or kernel_size <= 1:
        raise ValueError("Kernel size must be an odd integer greater than 1.")

    # Apply Gaussian filter using OpenCV's GaussianBlur function
    filtered_image = cv2.GaussianBlur(image, (kernel_size, kernel_size), sigmaX=sigmaX)

    return filtered_image


# Load an example color or grayscale image with noise
image_path = '3.png'  # Replace with your noisy image path
image = cv2.imread(image_path)

# Ensure the image is loaded correctly
if image is None:
    raise ValueError("Image not found or unable to load.")

# Apply Gaussian Filter to the image
filtered_image = apply_gaussian_filter(image, kernel_size=5, sigmaX=1.5)  # You can change the parameters as needed

# Convert images from BGR to RGB for displaying using matplotlib
image_rgb = cv2.cvtColor(image, cv2.COLOR_BGR2RGB)
filtered_image_rgb = cv2.cvtColor(filtered_image, cv2.COLOR_BGR2RGB)

# Show the original and filtered images
plt.figure(figsize=(10, 5))
plt.subplot(121), plt.imshow(image_rgb), plt.title('Noisy Image')
plt.xticks([]), plt.yticks([])
plt.subplot(122), plt.imshow(filtered_image_rgb), plt.title('Filtered Image with Gaussian Filter')
plt.xticks([]), plt.yticks([])
plt.show()
c.中值滤波
import cv2
import numpy as np
import matplotlib.pyplot as plt


def apply_median_filter(image, kernel_size=3):
    """
    应用中值滤波到图像。

    参数:
        image: 输入图像 (灰度或彩色)
        kernel_size: 滤波器窗口大小,默认为3x3

    返回:
        filtered_image: 应用了中值滤波后的图像
    """
    # Ensure the kernel size is odd and greater than 1
    if kernel_size % 2 == 0 or kernel_size <= 1:
        raise ValueError("Kernel size must be an odd integer greater than 1.")

    # Apply median filter using OpenCV's medianBlur function
    filtered_image = cv2.medianBlur(image, kernel_size)

    return filtered_image


# Load an example color or grayscale image with noise
image_path = '3.png'  # Replace with your noisy image path
image = cv2.imread(image_path)

# Ensure the image is loaded correctly
if image is None:
    raise ValueError("Image not found or unable to load.")

# Apply Median Filter to the image
filtered_image = apply_median_filter(image, kernel_size=5)  # You can change the kernel size as needed

# Convert images from BGR to RGB for displaying using matplotlib
image_rgb = cv2.cvtColor(image, cv2.COLOR_BGR2RGB)
filtered_image_rgb = cv2.cvtColor(filtered_image, cv2.COLOR_BGR2RGB)

# Show the original and filtered images
plt.figure(figsize=(10, 5))
plt.subplot(121), plt.imshow(image_rgb), plt.title('Noisy Image')
plt.xticks([]), plt.yticks([])
plt.subplot(122), plt.imshow(filtered_image_rgb), plt.title('Filtered Image with Median Filter')
plt.xticks([]), plt.yticks([])
plt.show()
d.非局部均值滤波
import cv2
import numpy as np
import matplotlib.pyplot as plt


def apply_non_local_means_filter(image, h=10, hForColorComponents=10, templateWindowSize=7, searchWindowSize=21):
    """
    应用非局部均值滤波到图像。

    参数:
        image: 输入图像 (灰度或彩色)
        h: 滤波强度参数,用于控制滤波器在亮度上的敏感度,默认为10
        hForColorComponents: 仅对彩色图像有效,用于控制滤波器在颜色分量上的敏感度,默认为10
        templateWindowSize: 模板窗口大小,默认为7x7
        searchWindowSize: 搜索窗口大小,默认为21x21

    返回:
        filtered_image: 应用了非局部均值滤波后的图像
    """
    # Apply non-local means filter using OpenCV's fastNlMeansDenoisingColored function for color images,
    # or fastNlMeansDenoising for grayscale images.
    if len(image.shape) == 2:
        # Grayscale image
        filtered_image = cv2.fastNlMeansDenoising(image, None, h, templateWindowSize, searchWindowSize)
    else:
        # Color image
        filtered_image = cv2.fastNlMeansDenoisingColored(image, None, h, hForColorComponents, templateWindowSize,
                                                         searchWindowSize)

    return filtered_image


# Load an example color or grayscale image with noise
image_path = 'x.png'  # Replace with your noisy image path
image = cv2.imread(image_path)

# Ensure the image is loaded correctly
if image is None:
    raise ValueError("Image not found or unable to load.")

# Apply Non-Local Means Filter to the image
filtered_image = apply_non_local_means_filter(image, h=10, hForColorComponents=10, templateWindowSize=7,
                                              searchWindowSize=21)

# Convert images from BGR to RGB for displaying using matplotlib
image_rgb = cv2.cvtColor(image, cv2.COLOR_BGR2RGB)
filtered_image_rgb = cv2.cvtColor(filtered_image, cv2.COLOR_BGR2RGB)

# Show the original and filtered images
plt.figure(figsize=(10, 5))
plt.subplot(121), plt.imshow(image_rgb), plt.title('Noisy Image')
plt.xticks([]), plt.yticks([])
plt.subplot(122), plt.imshow(filtered_image_rgb), plt.title('Filtered Image with Non-Local Means Filter')
plt.xticks([]), plt.yticks([])
plt.show()
e.双边滤波
import cv2
import numpy as np
import matplotlib.pyplot as plt


def apply_bilateral_filter(image, d=9, sigma_color=75, sigma_space=75):
    """
    应用双边滤波到图像。

    参数:
        image: 输入图像 (灰度或彩色)
        d: 邻域直径;较大的d意味着更大的邻域参与过滤,默认为9
        sigma_color: 颜色空间的标准差,较大值意味着颜色差异对权重的影响较小,默认为75
        sigma_space: 坐标空间的标准差,较大值意味着距离对权重的影响较小,默认为75

    返回:
        filtered_image: 应用了双边滤波后的图像
    """
    # Apply bilateral filter using OpenCV's bilateralFilter function
    filtered_image = cv2.bilateralFilter(image, d, sigma_color, sigma_space)

    return filtered_image


# Load an example color or grayscale image with noise
image_path = 'x.png'  # Replace with your noisy image path
image = cv2.imread(image_path)

# Ensure the image is loaded correctly
if image is None:
    raise ValueError("Image not found or unable to load.")

# Apply Bilateral Filter to the image
filtered_image = apply_bilateral_filter(image, d=9, sigma_color=75,
                                        sigma_space=75)  # You can change the parameters as needed

# Convert images from BGR to RGB for displaying using matplotlib
image_rgb = cv2.cvtColor(image, cv2.COLOR_BGR2RGB)
filtered_image_rgb = cv2.cvtColor(filtered_image, cv2.COLOR_BGR2RGB)

# Show the original and filtered images
plt.figure(figsize=(10, 5))
plt.subplot(121), plt.imshow(image_rgb), plt.title('Noisy Image')
plt.xticks([]), plt.yticks([])
plt.subplot(122), plt.imshow(filtered_image_rgb), plt.title('Filtered Image with Bilateral Filter')
plt.xticks([]), plt.yticks([])
plt.show()
f.小波变换
import numpy as np
import cv2
import pywt
import matplotlib.pyplot as plt


def apply_wavelet_denoising_to_channel(channel, wavelet='db4', level=1, threshold=None):
    """
    对单个颜色通道应用小波变换去噪。

    参数:
        channel: 输入的颜色通道 (灰度)
        wavelet: 使用的小波类型,默认为'db4'(Daubechies 4)
        level: 分解级别,默认为1
        threshold: 阈值,默认为None表示根据VisuShrink自动计算

    返回:
        denoised_channel: 应用了小波变换去噪后的灰度通道
    """
    # Normalize the channel to [0, 1] range
    channel_f = channel.astype(np.float64) / 255.0

    # Perform multilevel 2D discrete wavelet transform
    coeffs = pywt.wavedec2(channel_f, wavelet, level=level)

    # Extract approximation and detail coefficients
    cA = coeffs[0]
    coeffs_H = list(coeffs[1:])  # Detail coefficients at each level

    # If no threshold is provided, use VisuShrink method to compute it
    if threshold is None:
        sigma = np.median(np.abs(coeffs_H[-1][0])) / 0.6745
        threshold = sigma * np.sqrt(2 * np.log(channel_f.size))

    # Apply thresholding to detail coefficients
    coeffs_H_thresholded = []
    for i in range(len(coeffs_H)):
        # Ensure that we keep the tuple structure of the detail coefficients
        coeffs_H_thresholded.append(tuple(pywt.threshold(detail, threshold, mode='soft') for detail in coeffs_H[i]))

    # Reconstruct the modified coefficients with the updated detail coefficients
    coeffs_mod = [cA] + coeffs_H_thresholded

    # Reconstruct the channel from modified coefficients
    denoised_channel_f = pywt.waverec2(coeffs_mod, wavelet)

    # Clip the values to stay within [0, 1] range and convert back to uint8
    denoised_channel_f = np.clip(denoised_channel_f, 0, 1)
    denoised_channel = (denoised_channel_f * 255).astype(np.uint8)

    return denoised_channel


def apply_wavelet_denoising_to_image(image, wavelet='db4', level=4, threshold=None):
    """
    对彩色图像的每个颜色通道应用小波变换去噪。

    参数:
        image: 输入图像 (彩色)
        wavelet: 使用的小波类型,默认为'db4'(Daubechies 4)
        level: 分解级别,默认为1
        threshold: 阈值,默认为None表示根据VisuShrink自动计算

    返回:
        denoised_image: 应用了小波变换去噪后的彩色图像
    """
    # Split the image into its color channels
    b, g, r = cv2.split(image)

    # Apply wavelet denoising to each channel
    denoised_b = apply_wavelet_denoising_to_channel(b, wavelet, level, threshold)
    denoised_g = apply_wavelet_denoising_to_channel(g, wavelet, level, threshold)
    denoised_r = apply_wavelet_denoising_to_channel(r, wavelet, level, threshold)

    # Merge the denoised channels back into a color image
    denoised_image = cv2.merge([denoised_b, denoised_g, denoised_r])

    return denoised_image


# Load an example color image with noise
image_path = '3.png'  # Replace with your noisy image path
image = cv2.imread(image_path)  # Load image as color

# Ensure the image is loaded correctly
if image is None:
    raise ValueError("Image not found or unable to load.")

# Apply Wavelet Denoising to the image
denoised_image = apply_wavelet_denoising_to_image(image, wavelet='db3', level=1)#改此处

# Convert images from BGR to RGB for displaying using matplotlib
image_rgb = cv2.cvtColor(image, cv2.COLOR_BGR2RGB)
denoised_image_rgb = cv2.cvtColor(denoised_image, cv2.COLOR_BGR2RGB)

# Show the original and denoised images
plt.figure(figsize=(10, 5))
plt.subplot(121), plt.imshow(image_rgb), plt.title('Noisy Image')
plt.xticks([]), plt.yticks([])
plt.subplot(122), plt.imshow(denoised_image_rgb), plt.title('Denoised Image with Wavelet Transform')
plt.xticks([]), plt.yticks([])
plt.show()
欢迎在评论区批评指正补充。
注:本文图片来自于网络数据集。


 4177
4177

 被折叠的 条评论
为什么被折叠?
被折叠的 条评论
为什么被折叠?
 到【灌水乐园】发言


