


在Kaggle竞赛中,"Garbage in, garbage out"的法则永远成立。特别是在LLM微调任务中,如何从原始文本中提炼出有价值的偏好信号,将直接影响模型的最终表现。
本文将以LLM Classification Finetuning比赛为实战场景,带深入探索数据预处理和分析的全流程。通过本文,你将掌握构建高质量训练集的核心技巧,并为后续模型训练打下坚实基础。
赛题背景
1、赛题
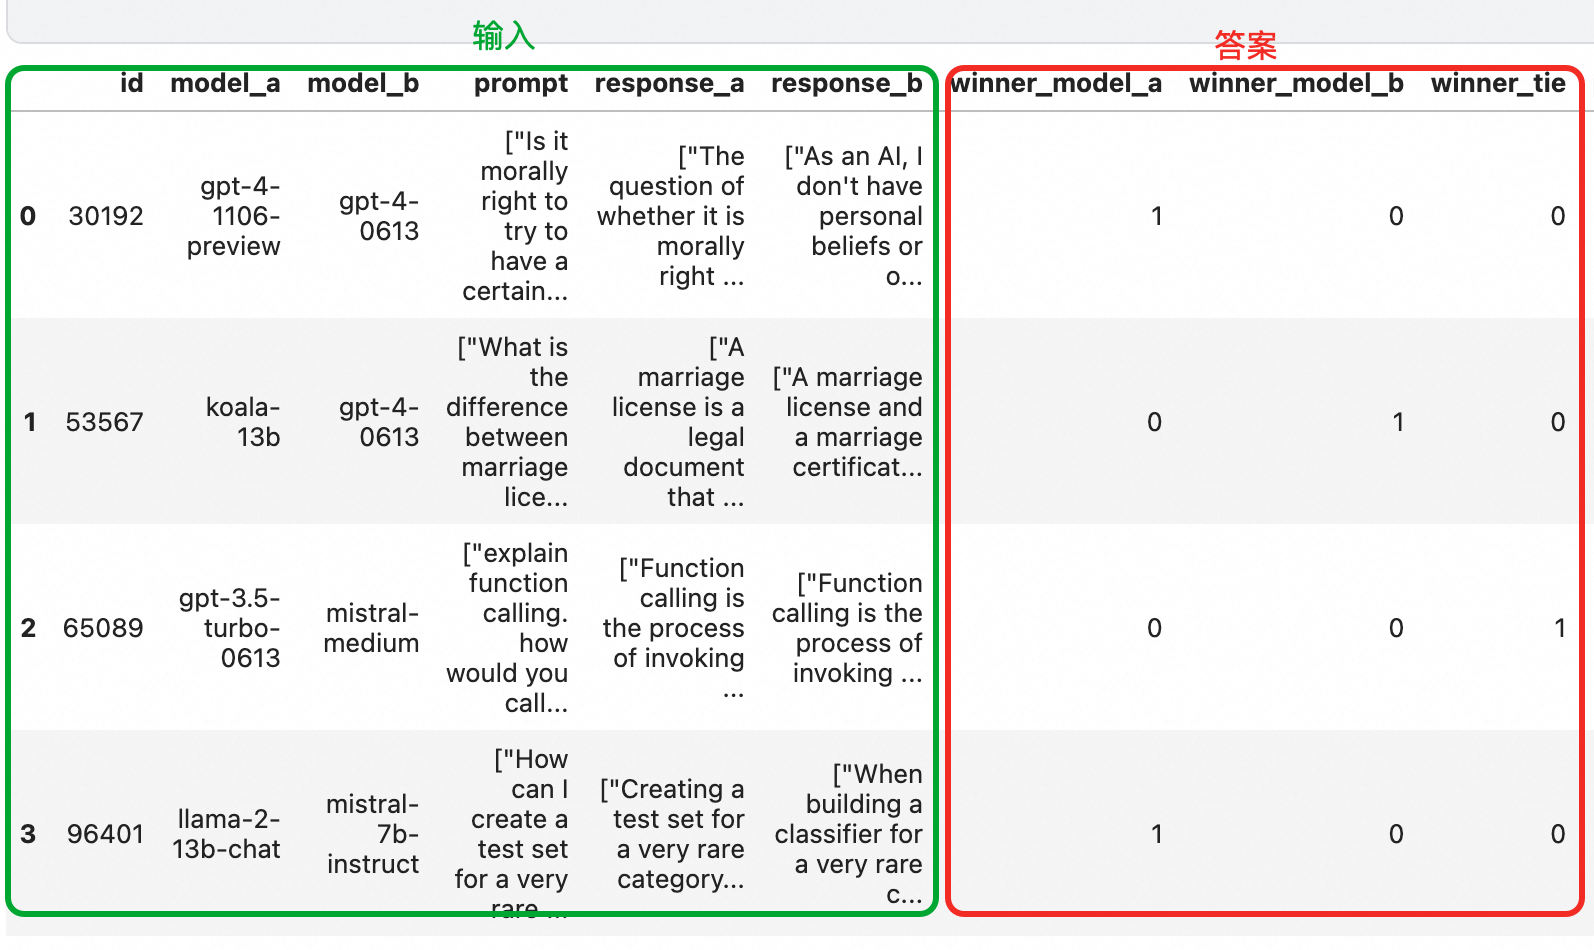
对于同一个prompt,model_a和b会给出不同回答response_a、response_b。参赛者需要构造一个模型,用来判断哪个回答更好:最后返回的是一个softmax分布,分别对应a获胜、b获胜还是平手
2、意义
构造的模型能判断哪个更符合人类偏好,那么就可以用来做reward model 奖励模型(后续给强化学习训练),或者用于DPO环节,向人类偏好对齐
分析
意义
遇到这种题目,大概的思路就是用训练集来微调一个LLM,从而让模型输出三者的预测结果。想要模型微调后的效果好,就需要输入的训练集数据是好的
那么比赛给的数据一定是好的吗? nonono,通常需要进行分析之后才有结果
分析维度
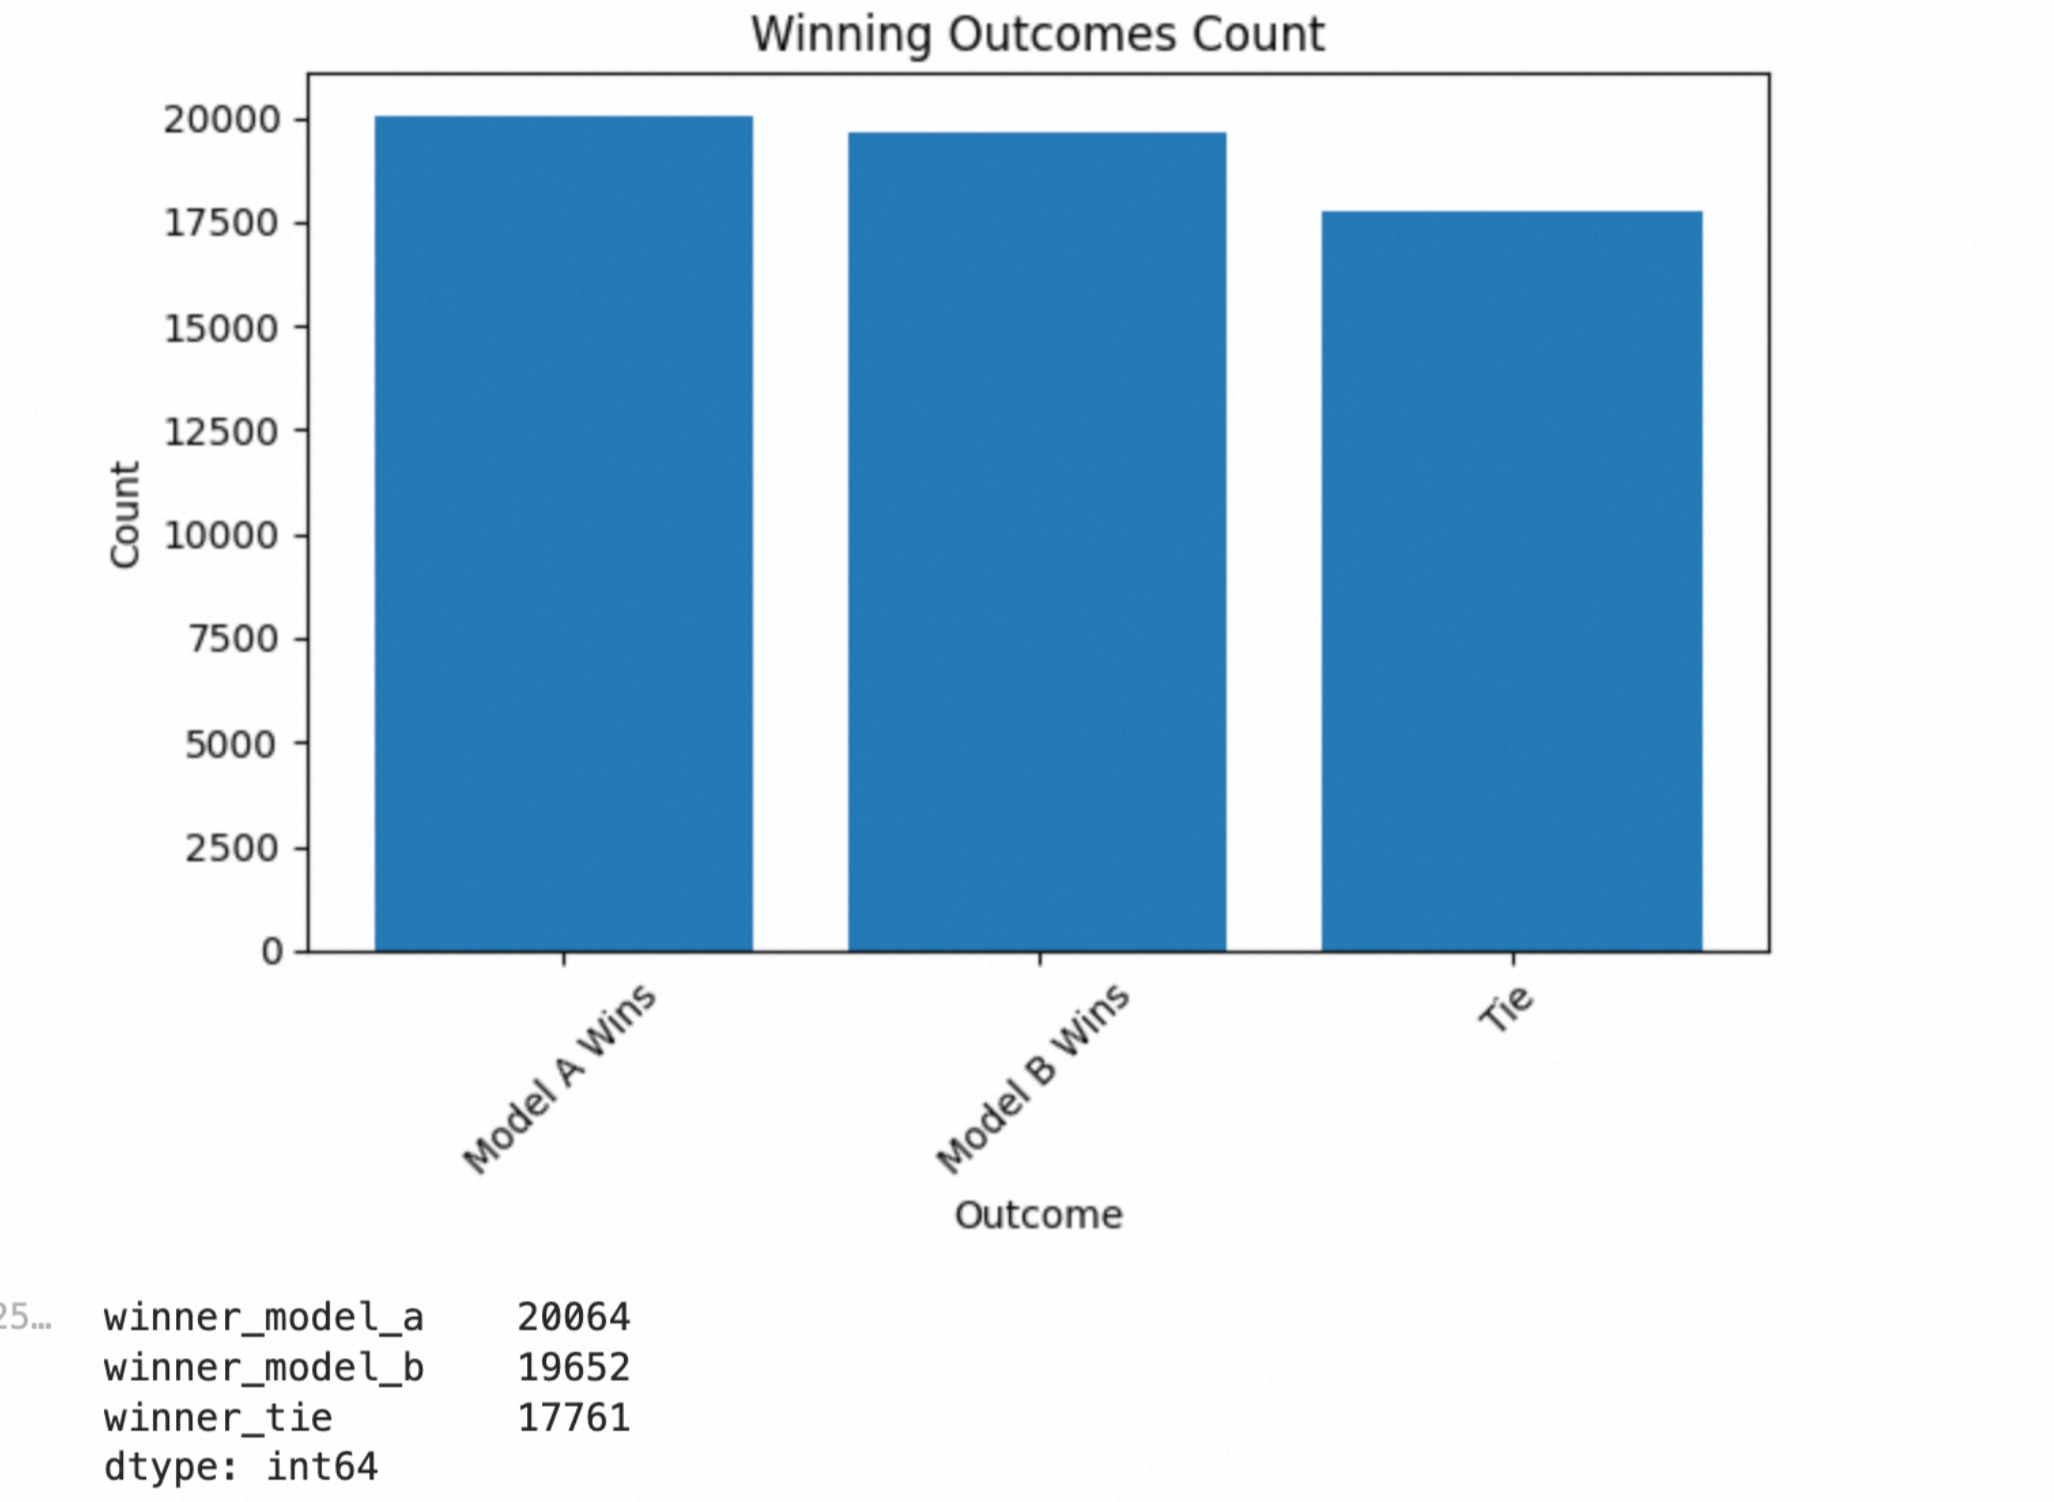
1、数据集的类别分布是否均衡
在分类问题中,数据集的类别分布是否均衡是一个重要的考量因素。如果数据集中“a”、“b”、“平手”这三种情况的分布不均衡,可能会导致模型在训练过程中偏向于出现频率较高的类别,从而影响模型的性能。
import pandas as pd
import matplotlib.pyplot as plt
import seaborn as sns
import numpy as np
from lightgbm import early_stopping,log_evaluation,LGBMClassifier
from sklearn.pipeline import FeatureUnion
from sklearn.compose import ColumnTransformer
from sklearn.feature_extraction.text import TfidfVectorizer
from sklearn.model_selection import train_test_split
from textblob import TextBlob #for sentiment analysis
path = "/kaggle/input/llm-classification-finetuning/"
train = pd.read_csv(path+"train.csv")
test = pd.read_csv(path+"test.csv")
# 统计获胜情况
vc = train[['winner_model_a', 'winner_model_b', 'winner_tie']].sum()
# 创建一个新的索引,以便在图表中显示更清晰的标签
labels = ['Model A Wins', 'Model B Wins', 'Tie']
# 创建柱状图
plt.bar(labels, vc.values)
# 自定义柱状图以获得更好的可视化效果
plt.xlabel('Outcome')
plt.ylabel('Count')
plt.title('Winning Outcomes Count')
plt.xticks(rotation=45) # 旋转标签以提高可读性
plt.tight_layout() # 调整布局以防止元素重叠
plt.show()
vc结果:
vc = train[['winner_model_a', 'winner_model_b', 'winner_tie']].sum()

# Plot the pie chart
plt.pie(vc.values, labels=vc.index, autopct="%1.1f%%")  # Add percentages to pie slices
plt.title('Winner Models')
plt.show()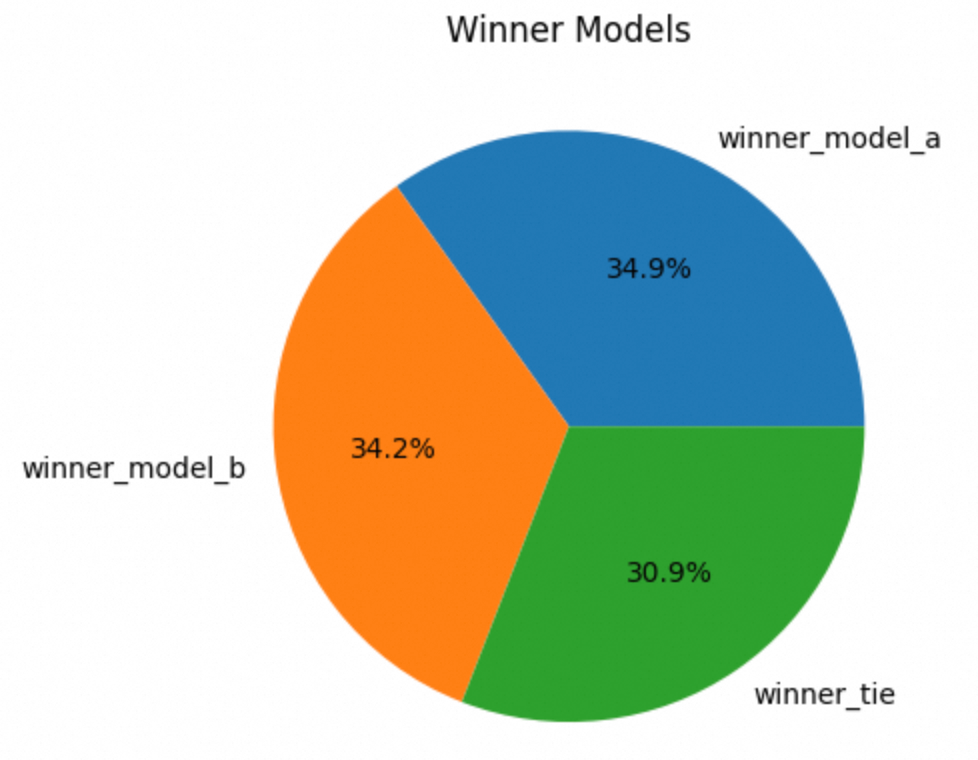
占比差不多,不用调整
2、情感偏好是否中性
输入的prompt、response_a和response_b的情感维度确实对最后的判断有重要影响。情感维度通常包括积极、消极和中性三种类别,这些情感特征会直接影响模型对文本的理解和判断。
如果prompt、response_a和response_b的情感维度都是中性的,模型可能会更倾向于基于语义内容而非情感倾向进行判断。中性情感通常意味着文本中没有明显的积极或消极情绪,因此模型会更加关注文本的逻辑、事实和上下文关系。
如果prompt、response_a和response_b中有一个或多个具有明显的情感倾向(积极或消极),模型可能会在判断时受到这些情感倾向的影响。
def sentiment_analysis(text):
    blob = TextBlob(text)
    sentiment = blob.sentiment.polarity
    return sentiment

# Apply sentiment analysis to each column
train['prompt_sentiment'] = train['prompt'].apply(sentiment_analysis)
train['response_a_sentiment'] = train['response_a'].apply(sentiment_analysis)
train['response_b_sentiment'] = train['response_b'].apply(sentiment_analysis)
test['prompt_sentiment'] = test['prompt'].apply(sentiment_analysis)
test['response_a_sentiment'] = test['response_a'].apply(sentiment_analysis)
test['response_b_sentiment'] = test['response_b'].apply(sentiment_analysis)
分别画图
# DataFrame 'train' with the column 'winner'
vc = train['prompt_sentiment'].value_counts()  # Count occurrences of each value
# vc = train['response_a_sentiment'].value_counts()  # Count occurrences of each value
# vc = train['response_b_sentiment'].value_counts()  # Count occurrences of each value


# Create a bar chart
plt.bar(vc.index, vc.values)  # Use index for category labels
# Customize the bar chart for better visualization
plt.xlabel('Sentiment')
plt.ylabel('Count')
plt.title('Prompt Sentiment')
plt.xticks(ha='right')  # Rotate category labels for readability
plt.tight_layout()  # Adjust spacing to prevent overlapping elements

plt.show()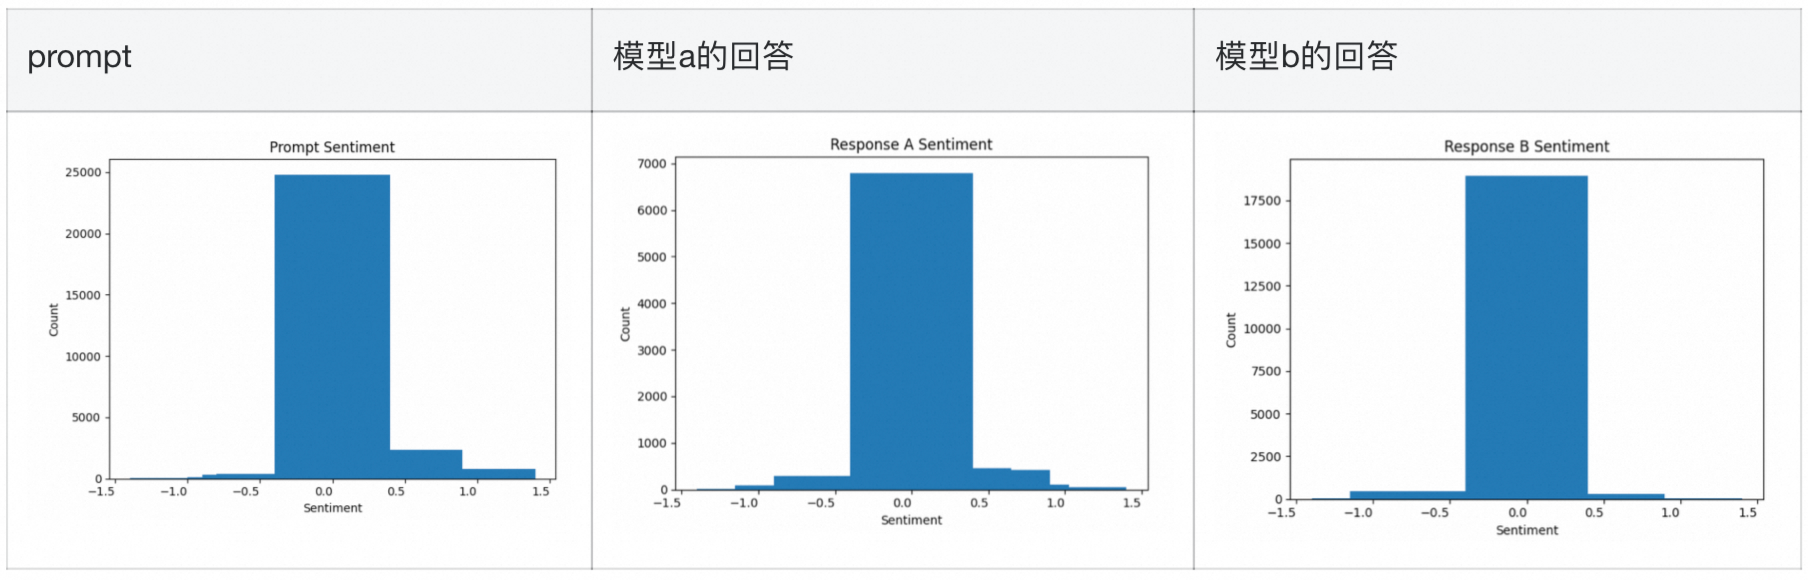
3、模型使用分布
画出用来生成response的最常用模型,model_a和model_b选用的模型越接近越好
# DataFrame 'train' with the column 'model_a'
vc = train['model_a'].value_counts()  # Count occurrences of each value
# Increase plot size (adjust width and height as needed)
plt.figure(figsize=(12, 6))  # Set width to 12, height to 6
# Create a bar chart
plt.bar(vc.index, vc.values)  # Use index for category labels
# Customize the bar chart for better visualization
plt.xlabel('Model_A')
plt.ylabel('Count')
plt.title('Models Used as Model A')
plt.xticks(rotation=90, ha='right')  # Rotate category labels for readability
plt.tight_layout()  # Adjust spacing to prevent overlapping elements

plt.show()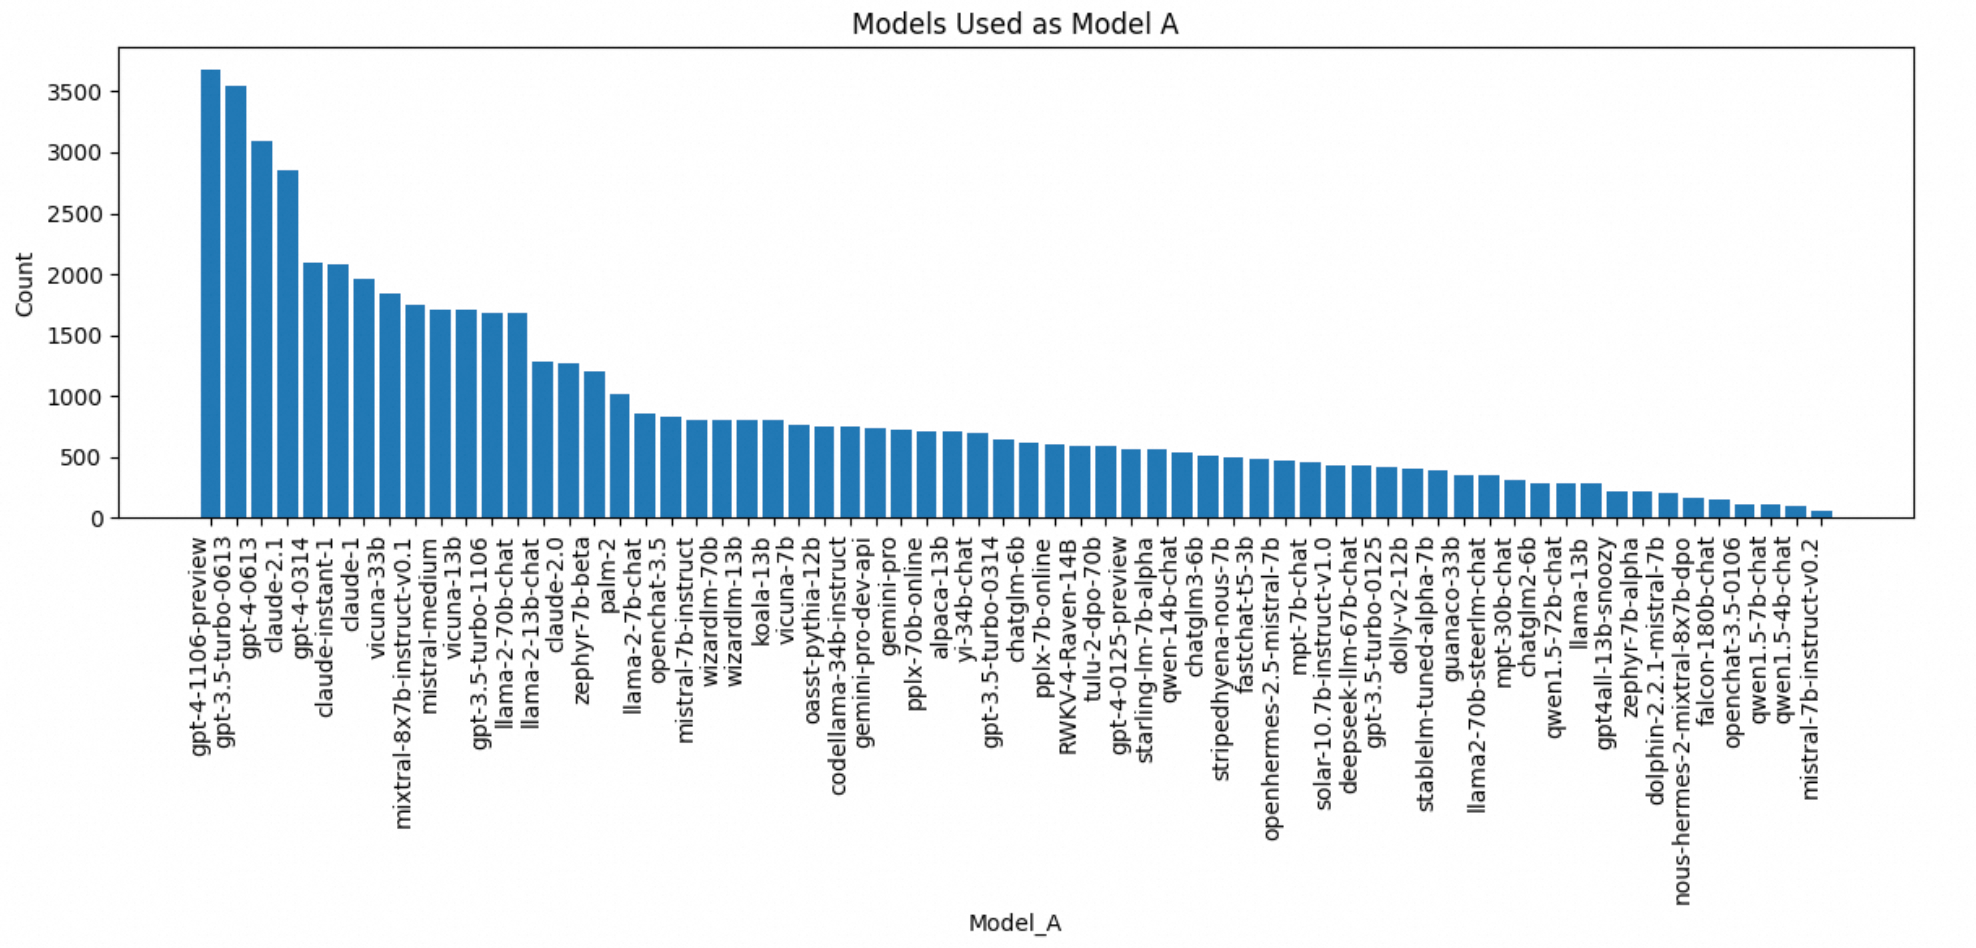

4、特征工程
目的是从文本中提取结构化特征,用于分析。例如:
- 文本长度:可能影响用户对回复的选择(如长回复 vs 短回复)。
- 标点符号/括号平衡:可能反映文本的规范性(如代码或结构化文本)。
- 特殊字符比例:可能帮助区分不同语言或内容类型(如中文 vs 英文、代码 vs 自然语言)。
- 关键词(如 "json"):可能暗示用户请求的格式(如要求返回 JSON 数据)。
这些特征可以用于训练模型(如分类或排序模型)或直接分析数据分布
# compute some features
def compute_feats(df):
    for col in ["response_a","response_b","prompt"]:
        # response lenght is a key factor when choosing between two responses
        df[f"{col}_len"]=df[f"{col}"].str.len()

        # Some characters counting features
        df[f"{col}_spaces"]=df[f"{col}"].str.count("\s")
        df[f"{col}_punct"]=df[f"{col}"].str.count(",|\.|!")
        df[f"{col}_question_mark"]=df[f"{col}"].str.count("\?")
        df[f"{col}_quot"]=df[f"{col}"].str.count("'|\"")
        df[f"{col}_formatting_chars"]=df[f"{col}"].str.count("\*|\_")
        df[f"{col}_math_chars"]=df[f"{col}"].str.count("\-|\+|\=")
        df[f"{col}_curly_open"]=df[f"{col}"].str.count("\{")
        df[f"{col}_curly_close"]=df[f"{col}"].str.count("}")
        df[f"{col}_round_open"]=df[f"{col}"].str.count("\(")
        df[f"{col}_round_close"]=df[f"{col}"].str.count("\)")
        df[f"{col}_special_chars"]=df[f"{col}"].str.count("\W")
        df[f"{col}_digits"]=df[f"{col}"].str.count("\d")>0
        df[f"{col}_lower"]=df[f"{col}"].str.count("[a-z]").astype("float32")/df[f"{col}_len"]
        df[f"{col}_upper"]=df[f"{col}"].str.count("[A-Z]").astype("float32")/df[f"{col}_len"]
        df[f"{col}_chinese"]=df[f"{col}"].str.count(r'[\u4e00-\u9fff]+').astype("float32")/df[f"{col}_len"]

        # Feature that show how balanced are curly and round brackets
        df[f"{col}_round_balance"]=df[f"{col}_round_open"]-df[f"{col}_round_close"]
        df[f"{col}_curly_balance"]=df[f"{col}_curly_open"]-df[f"{col}_curly_close"]

        # Feature that tells if the string json is present somewhere (e.g. asking a json response or similar)
        # This for example could be expanded also to yaml, but analyses on train set are required to see if enough data is present for this to be really useful
        df[f"{col}_json"]=df[f"{col}"].str.lower().str.count("json")
    return df

train=compute_feats(train)
test=compute_feats(test)
总结
对于每一项分析之后,没问题再将数据用于后续训练


 6959
6959

 被折叠的 条评论
为什么被折叠?
被折叠的 条评论
为什么被折叠?
 到【灌水乐园】发言


