


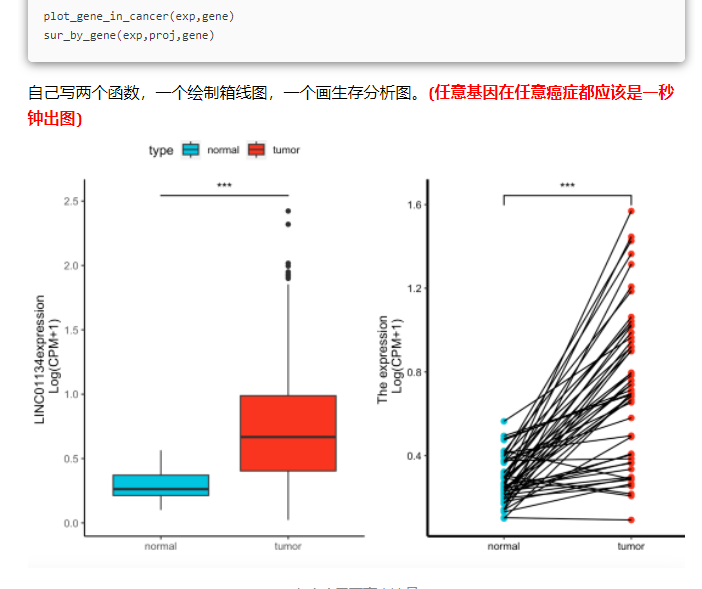
前几天看到了生信技能树的推文:什么情况下我们可以修改基因名字
里面提到了2个函数很好用:
其实这个需求我知道在小洁老师的R包tinyarray里有函数可以实现:宝藏R包tinyarray:常用图表一键收走
我还知道果子老师在2018年就介绍过这个技能了:多个基因在多亚组疾病中的展示
感觉这个函数非常实用,于是我也想写一个。
写好之后我把它们加在easyTCGA包里了。
目前easyTCGA已经完美支持TCGA常见5种组学数据的下载和整理:gene、miRNA、Copy Number Variation、
simple nucleotide variation、DNA methylation
批量生存分析也默认支持最佳截点了。
大家可以去github了解详情:https://github.com/ayueme/easyTCGA
今天主要说下几个可视化小函数。
准备数据
以TCGA-BRCA为例。
library(easyTCGA)
#getmrnaexpr("TCGA-BRCA") # 下载只要1行代码
load(file = "G:/easyTCGA_test/output_mRNA_lncRNA_expr/TCGA-BRCA_mrna_expr_tpm.rdata")
load(file = "G:/easyTCGA_test/output_mRNA_lncRNA_expr/TCGA-BRCA_clinical.rdata")
准备表达数据,分子,和组别。
expr <- log2(mrna_expr_tpm+0.1)
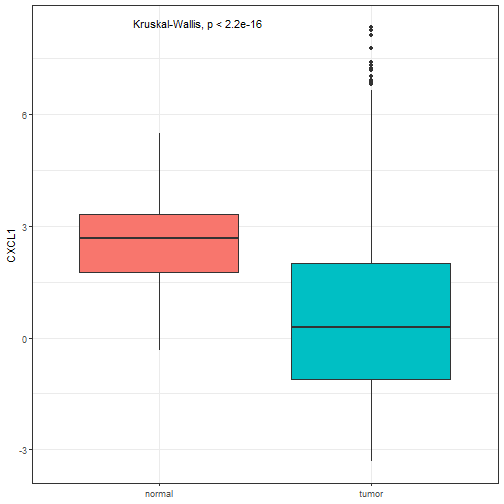
marker <- "CXCL1"
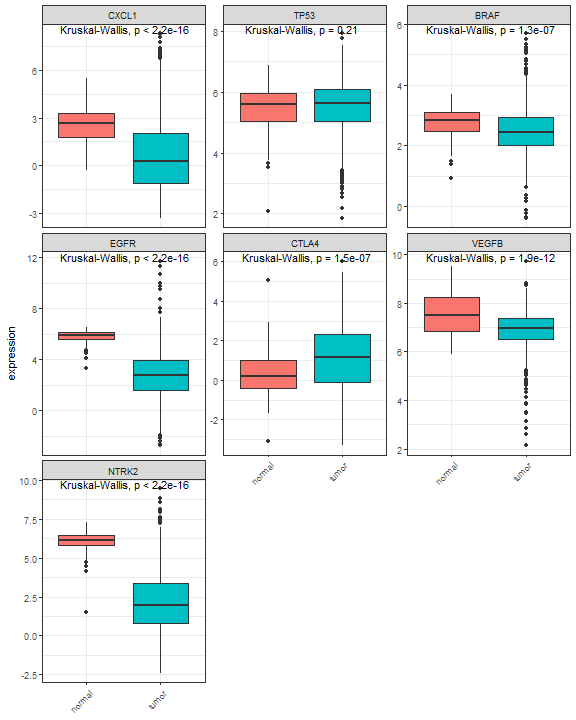
markers <- c("CXCL1","TP53","BRAF","EGFR","CTLA4","VEGFB","NTRK2")
sample_group <- ifelse(as.numeric(substr(colnames(expr),14,15))<10,"tumor","normal")
table(sample_group)
## sample_group
## normal tumor
## 113 1118
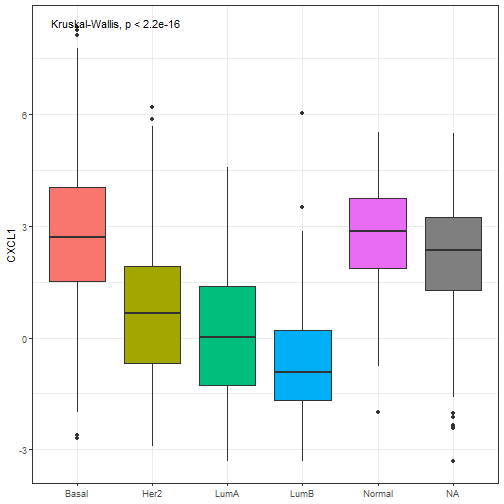
sample_groups <- clin_info$paper_BRCA_Subtype_PAM50 #临床信息非常丰富!
table(sample_groups)
## sample_groups
## Basal Her2 LumA LumB Normal
## 197 82 571 209 40
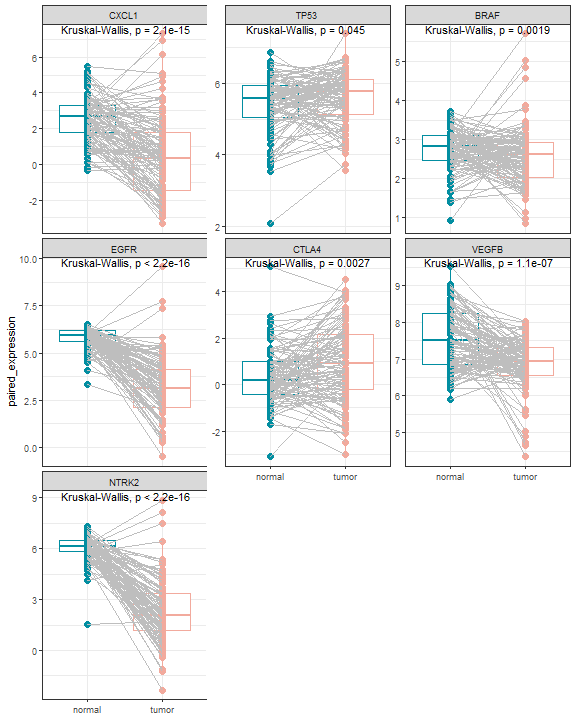
plot_gene
首先是plot_gene。可以实现:任意数量基因在任意癌种(TCGA33种其中之一都可以)的任意分组中的表达量箱线图
1个基因在两个组的表达量:
res <- plot_gene(expr = expr,marker,sample_group)
多个基因在两个组的表达量:
res <- plot_gene(expr = expr,markers,sample_group)
1个基因在多个组的表达量:
res <- plot_gene(expr = expr,marker,sample_groups)
多个基因在多个组的表达量:
res <- plot_gene(expr = expr,markers,sample_groups)

当然大家对美的追求是无止境的,所以每个画图函数都可以返回画图数据,方便你DIY。
head(res)
##                      sample_id  group markers expression
## 1 TCGA-B6-A0RH-01A-21R-A115-07   Her2   CXCL1 -2.9072513
## 2 TCGA-BH-A1FU-11A-23R-A14D-07   <NA>   CXCL1  2.3879966
## 3 TCGA-BH-A1FU-01A-11R-A14D-07 Normal   CXCL1  3.7425560
## 4 TCGA-AR-A0TX-01A-11R-A084-07   Her2   CXCL1  1.5995082
## 5 TCGA-A1-A0SE-01A-11R-A084-07   LumA   CXCL1 -0.7147754
## 6 TCGA-BH-A1FC-11A-32R-A13Q-07   <NA>   CXCL1  5.1622906
plot_gene_paired
任意基因在某一癌种配对样本中的表达量箱线图;
pair_sam <- plot_gene_paired(expr = expr,marker = markers)
pair_sam <- plot_gene_paired(expr = expr,marker = "CXCL1")
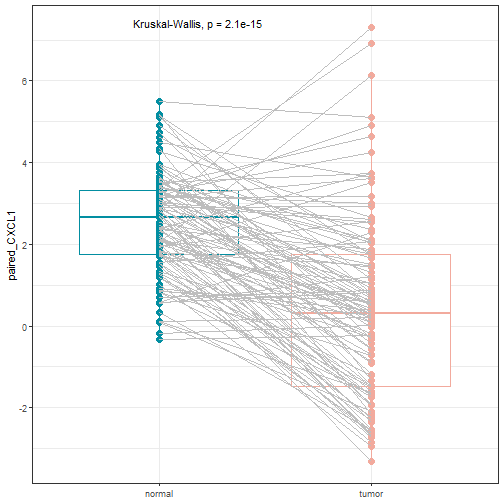
如果你不满意也可以自己用返回的数据画图。
plot_km
根据任意基因的表达量分组,并画出K-M生存曲线(支持最佳截点)
需要先准备下临床数据,需要一个数据框,只含有两列,列名是time和event,event用1表示死亡,0表示存活。
# 准备临床数据
clin <- clin_info[,c("days_to_last_follow_up","vital_status")]
names(clin) <- c("time","event")
clin$event <- ifelse(clin$event=="Dead",1,0)
画图,默认根据最佳截点,否则根据中位数,支持返回数据
res <- plot_KM(exprset = expr, marker = marker, clin = clin,optimal_cut = T)
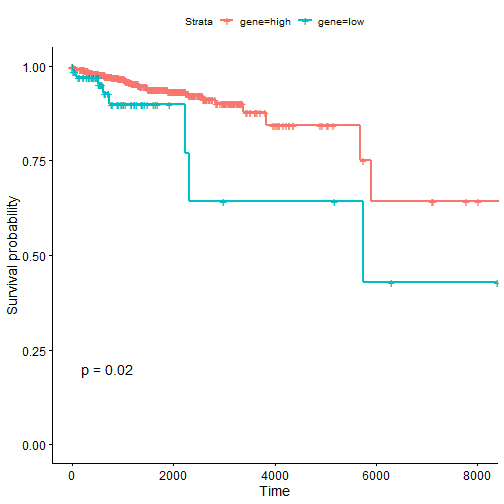
res <- plot_KM(exprset = expr, marker = marker, clin = clin,optimal_cut = F)
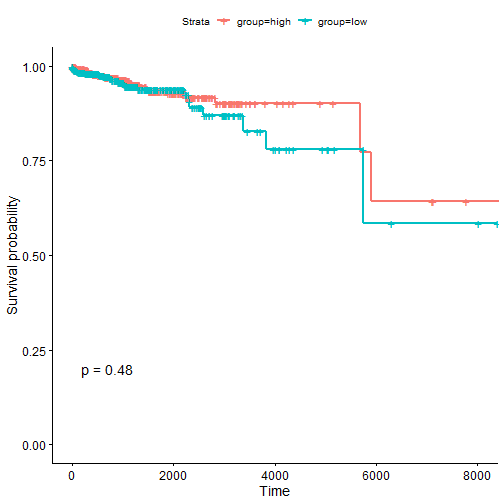
最佳截点效果还是很明的!
批量生存分析也是默认支持最佳截点的哦。


 2610
2610


 被折叠的 条评论
为什么被折叠?
被折叠的 条评论
为什么被折叠?
 到【灌水乐园】发言


