


//
To ensure your application runs with no performance issues, it’s important to understand how Unity uses and allocates memory. This section of the documentation explains how memory works in Unity, and is intended for readers who want to understand how they can improve the memory performance of their application.
Unity uses three memory management layers to handle memory in your application:
- Managed memory: A controlled memory layer that uses a managed heap and a garbage collector to automatically allocate and assign memory.
- C# unmanaged memory: A layer of memory management that you can use in conjunction with the Unity Collections namespace and package. This memory type is called “unmanaged” because it doesn’t use a garbage collector to manage unused parts of memory.
- Native memory: C++ memory that Unity uses to run the engine. In most situations, this memory is inaccessible to Unity users, but it’s useful to be aware of it if you want to fine-tune certain aspects of the performance of your application.
Managed memory
Mono and IL2CPP’s scripting virtual machines (VMs) implement the managed memory system, which is sometimes referred to as the scripting memory system. These VMs offer a controlled memory environment divided into the following different types:
- The managed heap: A section of memory that the VM automatically controls with a garbage collector (GC). Because of this, the memory allocated on the managed heap is referred to as GC Allocation. The Profiler
records any occurrence of such an allocation as a GC.Alloc sample. - The scripting stack: This is built up and unwound as your application steps into and out of any code scopes.
- Native VM memory: Contains memory related to Unity’s scripting layer. Most of the time, you won’t need to manipulate the native VM memory, but it’s useful to know that it includes memory related to the executable code that your code generates, in particular around the use of generics, type meta data that Reflection uses, and the memory required to run the VM.
Because the managed memory system uses VMs, it has a controlled environment that automatically tracks the references of allocations to manage their lifetime. This means that it’s less likely for your application to release memory too early, while other code is trying to access it. It also means that you have some safeguard against memory leaks that happen when memory is inaccessible from code, or from unused memory piling up.
Using managed memory in Unity is the easiest way to manage the memory in your application; but it has some disadvantages. The garbage collector is convenient to use, but it’s also unpredictable in how it releases and allocates memory, which might lead to performance issues such as stuttering, which happens when the garbage collector has to stop to release and allocate memory. To work around this unpredictability, you can use the C# unmanaged memory layer.
For more information on how managed memory works see the documentation on Managed memory.
C# unmanaged memory
The C# unmanaged memory layer allows you to access the native memory layer to fine-tune memory allocations, with the convenience of writing C# code.
You can use the Unity.Collectionsnamespace (including NativeArray) in the Unity core API, and the data structures in the Unity Collections package to access C# unmanaged memory. If you use Unity’s C# Job system, or Burst, you must use C# unmanaged memory. For more information about this, see the documentation on the Job system and Burst.
Native memory
The Unity engine’s internal C/C++ core has its own memory management system, which is referred to as native memory. In most situations, you can’t directly access or modify this memory type.
Unity stores the scenes
in your project, assets, graphics APIs, graphics drivers, subsystem and plug-in
buffers, and allocations inside native memory, which means that you can indirectly access the native memory via Unity’s C# API. This means that you can manipulate the data for your application in a safe and easy way, without losing the benefits of the native and performant code that’s at Unity’s native core.
Most of the time, you won’t need to interact with Unity’s native memory, but you can see how it affects the performance of your application whenever you use the Profiler, through Profiler markers
.
Managed memory
Unity’s managed memory system is a C# scripting environment based on the Mono or IL2CPP Virtual Machines (VMs). The benefit of the managed memory system is that it manages the release of memory, so you don’t need to manually request the release of memory through your code.
Unity’s managed memory system uses a garbage collector and a managed heap to automatically free memory allocations when your scripts
no longer hold any references to those allocations. This helps safeguard against memory leaks. Memory leaks occur when memory is allocated, the reference to it is lost, and then the memory is never freed because it needs a reference to it to free it.
This memory management system also guards memory access, which means that you can’t access memory that has been freed, or that was never valid for your code to access. However, this memory management process impacts runtime performance, because allocating managed memory is time-consuming for the CPU. Garbage collection might also stop the CPU from doing other work until it completes.
Value and reference types
When a method is called, the scripting back end copies the values of its parameters to an area of memory reserved for that specific call, in a data structure called a call stack. The scripting back end can quickly copy data types that occupy a few bytes. However, it’s common for objects, strings, and arrays to be much larger, and it’s inefficient for the scripting back end to copy these types of data on a regular basis.
All non-null reference-type objects and all boxed value-typed objects in managed code must be allocated on the managed heap.
It’s important that you are familiar with value and reference types, so that you can effectively manage your code. For more information, see Microsoft’s documentation on value types, and reference types.
Automatic memory management
When an object is created, Unity allocates the memory required to store it from a central pool called the heap, which is a section of memory that your Unity project’s selected scripting runtime (Mono or IL2CPP) automatically manages. When an object is no longer in use, the memory it once occupied can be reclaimed and used for something else.
Unity’s scripting back ends use a garbage collector to automatically manage your application’s memory, so that you don’t need to allocate and release these blocks of memory with explicit method calls. Automatic memory management requires less coding effort than explicit allocation/release and reduces the potential for memory leaks.
Managed heap overview
The managed heap is a section of memory that your Unity project’s selected scripting runtime (Mono or IL2CPP) automatically manages.
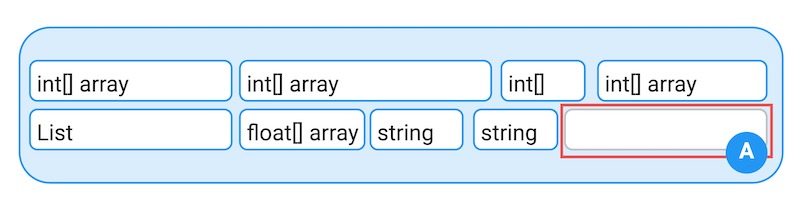
A quantity of memory. Marked A on the diagram is some free memory.
In the above diagram, the blue box represents a quantity of memory that Unity allocates to the managed heap. The white boxes within it represent data values that Unity stores within the managed heap’s memory space. When additional data values are needed, Unity allocates them free space from the managed heap (annotated A).
Memory fragmentation and heap expansion
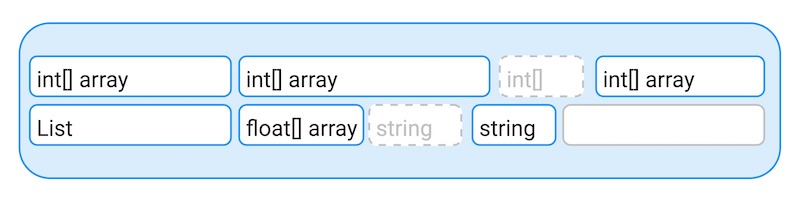
A quantity of memory, with some objects released represented by grey dashed lines.
The above diagram shows an example of memory fragmentation. When Unity releases an object, the memory that the object occupied is freed up. However, the free space doesn’t become part of a single large pool of “free memory.”
The objects on either side of the released object might still be in use. Because of this, the freed space is a “gap” between other segments of memory. Unity can only use this gap to store data of identical or lesser size than the released object.
This situation is called memory fragmentation. This happens when there is a large amount of memory available in the heap, but it is only available in the “gaps” between objects. This means that even though there is enough total space for a large memory allocation, the managed heap can’t find a large enough single block of contiguous memory to assign to the allocation.
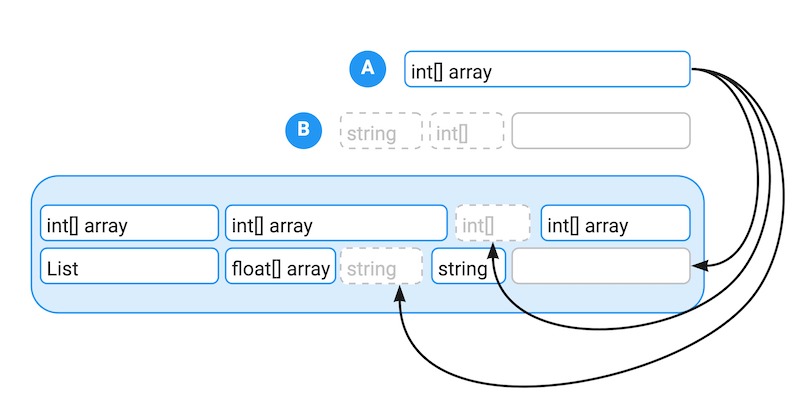
The object annotated A, is the new object needed to be added to the heap. The items annotated B are the memory space that the released objects took up, plus the free, unreserved memory. Even though there is enough total free space, because there isn’t enough contiguous space, the memory for the new object annotated A can’t fit on the heap, and the garbage collector must run.
If a large object is allocated and there is insufficient contiguous free space to accommodate it, as illustrated above, the Unity memory manager performs two operations:
- First, the garbage collector runs, if it hasn’t already done so. This attempts to free up enough space to fulfill the allocation request.
- If, after the garbage collector runs, there is still not enough contiguous space to fit the requested amount of memory, the heap must expand. The specific amount that the heap expands is platform-dependent; however, on most platforms, when the heap expands, it expands by double the amount of the previous expansion.
Managed heap expansion considerations
The unexpected expansion of the heap can be problematic. Unity’s garbage collection strategy tends to fragment memory more often. You should be aware of the following:
- Unity doesn’t release the memory allocated to the managed heap when it expands regularly; instead, it retains the expanded heap, even if a large section of it is empty. This is to prevent the need to re-expand the heap if further large allocations occur.
- On most platforms, Unity eventually releases the memory that the empty portions of the managed heap uses back to the operating system. The interval at which this happens isn’t guaranteed and is unreliable.
Garbage collector overview
Unity uses a garbage collector to reclaim memory from objects that your application and Unity are no longer using. When a script tries to make an allocation on the managed heap but there isn’t enough free heap memory to accommodate the allocation, Unity runs the garbage collector. When the garbage collector runs, it examines all objects in the heap, and marks for deletion any objects that your application no longer references. Unity then deletes the unreferenced objects, which frees up memory.
The garbage collector handles subsequent requests in the same way until there is no free area large enough to allocate the required block size. In this situation, it’s unlikely that all allocated memory is still in use. Unity’s scripting backends
can only access a reference item on the heap as long as there are still reference variables that can locate it. If all references to a memory block are missing (if the reference variables have been reassigned or if they’re local variables that are now out of scope) then the garbage collector can reallocate the memory it occupied.
To determine which heap blocks are no longer in use, the garbage collector searches through all active reference variables and marks the blocks of memory that they refer to as “live.” At the end of the search, the garbage collector considers any space between the “live” blocks empty and marks them for use for subsequent allocations. The process of locating and freeing up unused memory is called garbage collection (GC).
Note: The garbage collector works differently in WebGL
. For more information, see Garbage collection considerations.
In Unity, the garbage collector has the following modes:
- Incremental garbage collection: Enabled by default (Project Settings > Player > Configuration), this mode spreads out the process of garbage collection over multiple frames.
- Incremental garbage collection disabled: If you disable the Incremental GC Player Setting, the garbage collector stops running your application to inspect and process objects on the heap.
- Disable automatic garbage collection: Use the GarbageCollector.GCMode API to take full control of when Unity should run the garbage collector.
Tracking allocations
Unity has the following tools to keep track of memory allocations:
- Unity Profiler’s CPU Usage module: Provides details of the GC Alloc per frame
- Unity Profiler’s Memory module: Provides high-level memory usage frame by frame
- The Memory Profiler package: A separate Unity package which provides detailed information about memory usage during specific frames in your application
In the CPU Usage module, the Hierarchy view contains a GC Alloc column. This column displays the number of bytes that Unity allocated on the managed heap in a specific frame. It also displays the amount of memory that the garbage collector managed, and it includes memory that Unity might have allocated and reused in subsequent frames. This means that the sum of the GC Alloc over all frames doesn’t total how much the managed memory grew in that time.
To get the most accurate information, you should always profile your application on a development build
on the target platform or device you want to build to. The Unity Editor works in a different way to a build, and this affects the profiling data; for example, the GetComponent method always allocates memory when it’s executed in the Editor, but not in a built project.
You can also use the Call Stacks mode in the Profiler
to determine which method the allocations happen in. You can enable the full call stack traces for GC.Alloc samples, which then helps you determine where and when the garbage collector ran.
Incremental garbage collection
Incremental garbage collection (GC) spreads out the process of garbage collection over multiple frames. This is the default garbage collection behavior in Unity.
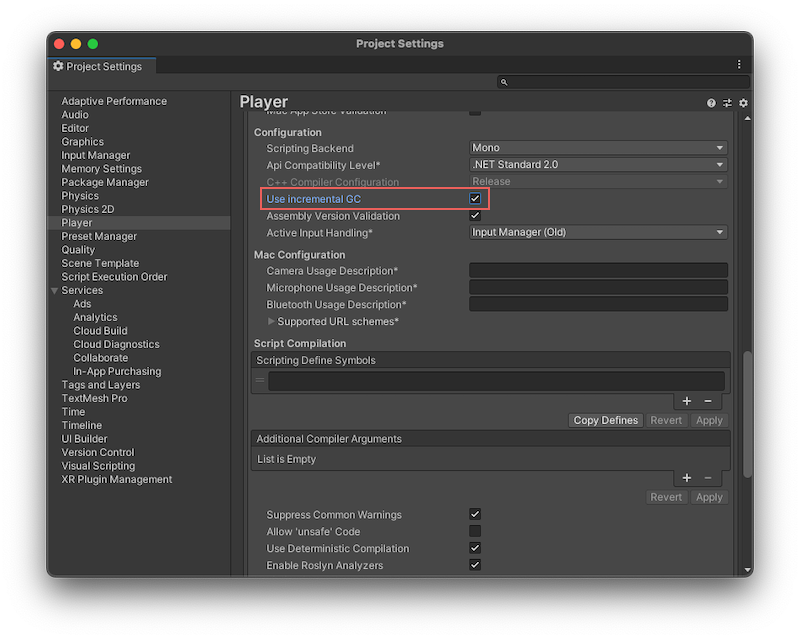
To enable incremental garbage collection, open the Player Settings and enable Use incremental GC. This is enabled by default.
Unity’s garbage collector uses the Boehm–Demers–Weiser garbage collector. By default, Unity uses it in incremental mode, which means that the garbage collector splits up its workload over multiple frames, instead of stopping the main CPU thread (stop-the-world garbage collection) to process all objects on the managed heap. This means that Unity makes shorter interruptions to your application’s execution, instead of one long interruption to let the garbage collector process the objects on the managed heap.
Incremental mode doesn’t make garbage collection faster overall, but because it distributes the workload over multiple frames, GC-related performance spikes are reduced. These interruptions are called GC spikes because they appear as large spikes in the Profiler window’s frame time graph.
If you disable incremental mode (menu: Edit > Project Settings > Player > Other Settings > Configuration > Use Incremental GC), the garbage collector must examine the entire heap when it performs a collection pass. This is known as stop-the-world garbage collection, because whenever the garbage collector runs, it stops the main CPU thread. It only resumes execution once it has processed all objects on the managed heap, which might lead to GC spikes affecting the performance of your application. The garbage collector is also non-compacting, which means that Unity doesn’t redistribute any objects in memory to close the gaps between objects.
Important: The WebGL
platform doesn’t support incremental garbage collection.
When incremental garbage collection is disabled, a GC spike happens when Unity stops running your program code to perform garbage collection. This delay might last for hundreds of milliseconds, depending on how many allocations the garbage collector needs to process, and the platform that your application is running on.
This is problematic for real-time applications such as games, because it’s difficult for your application to sustain the consistent frame rate that smooth animation requires when the garbage collector suspends your application’s execution.
Incremental garbage collection example
The following screenshots from the Profiler illustrate how incremental garbage collection reduces frame rate problems:
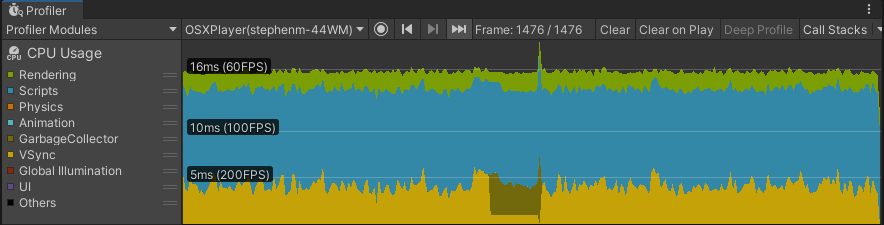
Profiling session with Incremental GC enabled
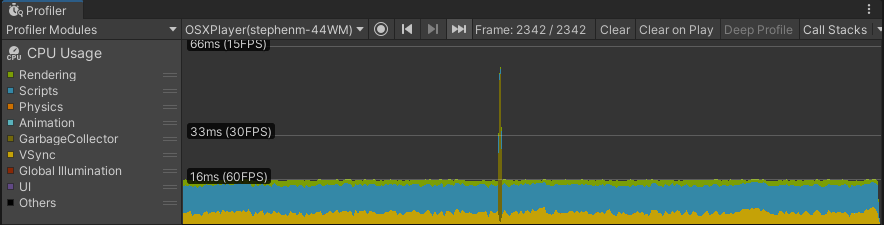
Profiling session with Incremental GC disabled
In the top profiling session, Incremental GC is enabled. The application has a consistent 60fps frame rate, because the garbage collector distributes the garbage collection operation over several frames, and uses a small time slice of each frame (the darker green fringe just above the yellow VSync trace).
The bottom profiling session has Incremental GC disabled, and there is a clear GC spike visible. This spike interrupts the otherwise smooth 60fps frame rate, and pushes the frame in which garbage collection happens over the 16 millisecond limit required to maintain 60fps.
If your application uses VSync
or Application.targetFrameRate, Unity adjusts the time it allocates to garbage collection based on the remaining available frame time. This way, Unity can run the garbage collection in the time it would otherwise spend waiting, and can carry out garbage collection with a minimal performance impact.
Note: If you set the VSync Count to anything other than Don’t Sync (in your project’s Quality settings or with the Application.VSync property) or you enable the Application.targetFrameRate property, Unity automatically uses any idle time left at the end of a given frame for incremental garbage collection.
To get more precise control over incremental garbage collection behavior, you can use the Scripting.GarbageCollector class. For example, if you don’t want to use VSync or a target frame rate, you can calculate the amount of time available before the end of a frame yourself, and provide that time to the garbage collector to use.
Disabling incremental garbage collection
Incremental garbage collection might be problematic for your application, because when the garbage collector divides its work in this mode, it also divides the marking phase. The marking phase is the phase in which the garbage collector scans all managed objects to determine which objects are still in use, and which objects it can clean up.
Dividing up the marking phase works well when most of the references between objects don’t change between slices of work. However, when an object reference changes, the garbage collector must scan those objects again in the next iteration. This means that too many changes can overwhelm the incremental garbage collector and create a situation where the marking phase never finishes because it always has more work to do. If this happens, the garbage collector falls back to doing a full, non-incremental collection.
When Unity uses incremental garbage collection, it generates additional code (known as write barriers) to inform the garbage collector whenever a reference changes, so that it knows if it needs to rescan an object. This adds some overhead when changing references, which has a performance impact in managed code.
To disable Incremental Garbage Collection, open the Player Settings window (Edit > Project Settings > Player > Configuration) and disable Use Incremental GC. Most Unity projects benefit from incremental garbage collection, especially if they suffer from garbage collection spikes, but you should always use the Profiler
to verify that your application performs as you expect.
Disabling garbage collection
You can use the GarbageCollector.GCMode to disable garbage collection at run time. This prevents CPU spikes, but the memory usage of your application never decreases, because the garbage collector doesn’t collect objects that no longer have any references.
Warning: Disabling the garbage collector requires careful memory management. If you don’t manage memory carefully, the managed heap continuously expands until your application runs out of memory, and the operating system shuts it down.
You can use the following APIs to fine-tune control over the automatic garbage collector:
System.GC.Collect: Performs a full, blocking garbage collection.- GarbageCollector.Mode.Disabled: Fully disables the garbage collector. Using
System.Gc.Collectin this mode has no effect. - GarbageCollector.Mode.Manual: Disables automatic invocations of the garbage collector, but you can still use
System.GC.Collectto run a full collection. GarbageCollection.CollectIncremental: Runs the garbage collector incrementally.
You should only disable garbage collection during short, performance-critical parts of your application, when you are able to calculate and control how much memory you need to allocate. You should immediately enable the garbage collector afterward, and profile your project often to ensure that you don’t trigger additional managed allocation which might cause the managed heap to get too big.
When you disable the garbage collector, it doesn’t stop your application to perform a garbage collection. Calling System.GC.Collect has no effect and doesn’t start a collection. To avoid increased memory usage over time, you must take care when managing memory. Ideally, you should allocate all memory before you disable the garbage collector and avoid additional allocations while it is disabled.
It’s best practice to only disable the garbage collector for long-lived allocations. For example, you might want to allocate all required memory for a level of your game before it loads, and then disable the garbage collector to avoid performance overhead during the level. After the level is completed and all memory is released, you can then enable the garbage collector again and use System.GC.Collect to reclaim memory before loading the next level.
For more details on how to enable and disable garbage collection at run time, see the GarbageCollector Scripting API page.
///
Unity内存分配和回收的底层原理
Unity由两部分内存来组成,原生内存(Native Memory)和托管内存(Managed Memory)。其中Native Memory大家接触的会比较少,而且可操控性也比较少,例如AssetBundle,Texture,Audio这些所占的内存,这一部分内存是由Unity自身来进行管理的。我们平时开发通常会接触到的是Managed Memory,也就是我们自己定义的各种类,如果这部分内存爆了,就需要我们自己去进行优化。
Native Memory
我们先来介绍一下Native Memory,看看Unity是如何分配和释放内存的。
new/malloc
由于Unity是一个C++引擎,那么分配和释放内存无非有下面两种方法:
第一种new和delete:
Obj *a = new Obj;
delete a;
第二种malloc和free:
Obj *a = (obj *)malloc(sizeof(obj));
free(a);
那么它们的区别是什么呢?主要有如下几种:
首先new属于c++的操作符(类似于 +、-等),而malloc是c里面的函数,理论上来讲操作符永远快于函数。
其次new分配成功时,返回的是对象类型的指针,无须进行类型转换,而分配失败则会抛出Exception。而malloc分配成功则是返回void * ,需要通过强制类型转换变为我们需要的类型,分配失败只会返回一个空(NULL)。
然后还有非常重要的一点就是,malloc基本上大家的实现是类似的,new却各有各的不同。我们知道new会去调用构造函数(constructor),所以很多人会把new理解成malloc+constructor,但是这种理解是错误的。因为在c++实现的standard里,你会发现new会不会调用malloc完全由new库的实现来自行决定,也就是说new和malloc是两者独立的。
另外从严格的c++和c的意义上来讲,他们分配内存的位置是不一样的,new会分配在自由存储区(Free Store),而malloc会分配在堆(heap)上。这两者的区别简单来说,你new分配的内存再delete后是否直接释放还给系统是由new自己来决定的,而malloc分配的内存再free后是一定会还回去的。
所以严格来讲new和malloc根本不是一件事,两者之间没有什么关系。
理解了原生的new和malloc之后就会发现,它们交给上层开发者去进行可控的单元其实并不多。也就是说当我去new的时候,具体c++怎么去new,实际上完全依赖于库实现。如果这个库实现的比较好,例如有些库的实现会包含内存池这样的机制,那么我们的new就不容易导致一些例如内存碎片化的问题。但是如果实现的并不好,就可能造成性能的瓶颈。
因此大部分的工业软件,在写软件的第一件事情就是去重载整个的new和malloc,例如重载operator new() 和operator delete()来重新定义new和delete操作符的功能。因此Unity也是这样的,即不会用原生的这套内存分配系统,而是自己去实现一套。
Unity的内存管理
Unity怎么做内存管理的呢?大致流程如下图:

Unity的内存管理
简单来说Unity会自定义一整套的宏,例如图中的UNITY_MALLOC,此外也会有自己的new等一系列的宏。当Unity代码里面通过这个宏去分配内存的时候,实际上并不会直接去调用库函数(malloc)或者说是我们对应的操作符(new),而是会交到一个叫Memory Manager的管理器里。如果大家去看一下我们的Profiler,里面会列出忙忙多的Manager(如下图),但是却找不到Memory Manager,因为我们看见的那些Manager信息大部分都是由它提供的,所以它自己并没有被包含进去。

在日常的开发当中我们也会意识到Unity有很多的Manager,比如说MeshManager、SoundManager,但是很少会意识到Unity自己有一个Manager,因为没把它写到profiler的数据里。
当Unity要去malloc一个东西的时候,我们会给这个内存一个标识符,也就是图中的Memory Label。我们在Profiler的Detailed信息里,能够看见很多的分类,这些分类里面展示了各个项的内存占用情况,如下图:

那么Unity如何在运行时区分出这块内存到底是谁的呢,就是通过Memory Label来进行区分的。
同时Memory Label还会帮Memory Manager去做一个筛选,Unity在底层会有一系列的内存分配策略,不同的策略会对应不同的分配器。图中列举了三个简单的分配器:栈分配器(Stack Allocator),批量分配器(Batch Allocator,在SRP和URP系统里经常会用到,此处又是一个饼),和比较常用的动态堆分配器(DynamicHeap Allocator),在读Unity源码时会经常碰见他们。
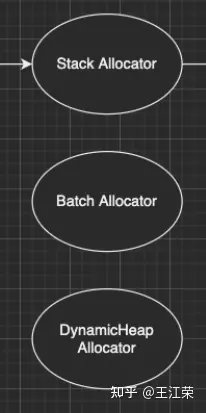
分配器
因此Memory Manager就可以通过Memory Label知道我们要做什么样的内存分配,从而选择一个合适的分配器来帮我们分配出一块合适的内存。unity底层大概有大概15-20种分配器,每种分配器适用的环境和它的场景是不同的。接下来我们举个例子,也就是栈分配器。
栈分配器(Stack Allocator)
栈分配器它有三个特点:
- 快
- 小
- 临时性
这个分配器大部分用来分配临时变量的。比如我们分配一个局部的内存,这个内存只在一个函数或者很短的一帧之内进行使用的话,可能就会用到它来进行分配。
它的内存结构如下:

图中一整个大块叫做一个Heap Block,当我们要分配一块内存的时候,实际上Unity帮我们分配的两块的内存:Header和User。
Header里面记录了我们当前这一次分配的一些信息,一般有如下几种:
- 当前这块是不是要被删掉,即图中的Deleted标记。
- 下面User这块真正要给用户的区域要有多大,即一个size。
- 当前这一块它前面的那一块是谁,应该是个指针吧。
User就是我们用户分配使用区域。也就是假如我们去分配一个16byte大小的内存,实际上消耗的可能是32byte的大小,因为会有个头。
这一整块内存在一开始的时候就已经预先分配好了,当我们进行栈分配的时候,实际上只是在不停的调整栈顶指针。例如示意图中我们分配了三块内存,那么每次分配时栈顶指针的位置如下图:

可以看出它是依次向下分配,每次只在栈的顶端或者说这一块内存的尾部再去分配。当预先分配的这一整块Block被分配完之后,会再额外拓展一个新的来,拓展时需要去malloc一块新的内存,然后移动栈顶指针。当然这个拓展并不是无限拓展的,它有如下限制:
- Editor模式下,主线程里有16MB的大小,在任何一个子线程(worker)里面会有256KB的大小。
- Runtime模式下,根据不同的平台,主线程里有128KB-1MB不等,每个子线程是64KB。
接着我们来看看回收的情况,比如我们要回收尾巴那一块,怎么做呢?会先把Header里的Deleted标记为1,表示这块内存无用了,然后把栈顶指针回弹,就做完了。如下图:
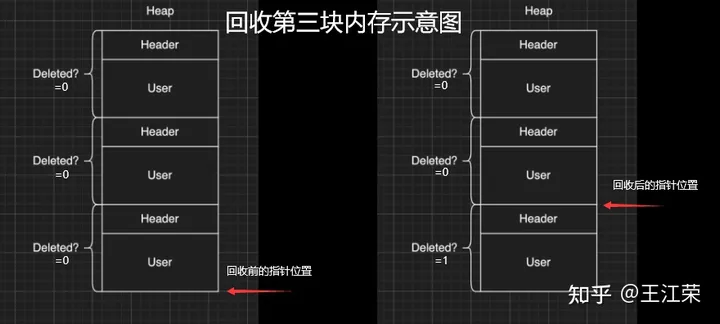
可以看出不管是分配还是回弹都是挪动栈指针,因此非常快。那么如果要回收中间那块的内存,要怎么做呢?那就更快了,只需要把中间的Header里的Deleted标记为1,然后别的什么都不做。如下图:

这样就会有个疑问,中间这块内存将来怎么去用呢?其实在尾巴被回收的时候还会做一个额外的动作,就是当我把自己回收并且栈顶指针回弹的时候,会再去检查上一块是不是也被删除了(因此在Header里面存了上一块的信息),如果是栈顶指针就再次向上移动,直到找到一个没有被删除的块,或者挪到了整个Block的头。例如我先回收第二块,然后在回收第三块,那么此时栈顶指针会直接回弹到第一块的末尾。
那么如果有几十几百个块,但是我们尾巴那块打死都不放,那么中间那些内存就永远无法再被复用了。因为我们只有回收最后一块的时候栈顶指针才会回弹,而每次分配都是从栈顶指针往下分配的。因此这也是栈分配器的一个限制,它无法快速立刻去重用已经被释放的内存,只有等栈顶被释放的时候才能回去寻找这些连续内存。
理解了这个机制之后,再看三个特点就会非常好理解:
- 快:因为每次分配只有移动指针,变更标记位,并没有做其他事情,并不实际的去malloc一块内存出来,所以非常非常的快。通过测试一万个对象的数据分配,它能比主分配器也就是动态堆分配器快三到五倍。
- 小:假如我分配了512M的内存给整个栈,会导致其中大量的内存可能会被浪费掉。因为这个Block一旦申请出来就不会被释放了,不会还给系统,所以这一块内存就永远在你的内存中杠着你,所以我们要设计的尽可能的小。
- 临时性:意味着内存栈会快速的收缩和膨胀,也就是说栈顶会经常的被释放,导致整个栈的内存可以高效和重复的利用。
上述这些原因也就是为什么我们的栈寄存器只用作临时的这块内存的分配。
MemoryManager.FallbackAllocation
有时候在我们通过Profiler底下那些Tag检查性能问题时,可能就会碰见一个叫MemoryManager.FallbackAllocation的Tag,如下图:

网上找的一个示意图
如果你见过这个东西,那么恭喜你中奖!今天的课对你就非常的有用了,你就能知道自己为什么碰见它了。
这个东西是干什么的呢?简单来说,刚刚我们说栈大小只有128KB-1MB,如果爆了怎么办。Unity整体的设计原则不会让大家的程序Crash。例如你拿到的Shader不一定是你想要的Shader,但是绝对会保证你不出错;以及你写的C#可能会抛异常,但是绝对不会让你的游戏崩溃。这是unity设计的一个理念,会做一个兜底行为(FallBack机制)。在写Shader时会要求你去写一个FallBack,不写就FallBack到一个Error Shader,也就是我们常见的紫红色效果,如下图:

对于整个栈管理同样有兜底机制,一旦用暴了,就会FallBack到我们的主堆分配器。主堆分配器的容量可以是非常非常大的,但是速度会比这个慢很多。因此当出现FallBack的时候,Unity会帮很贴心的帮你输出MemoryManager.FallbackAllocation的Tag。如果出现这个,会看见一个特别长的时间线,因为原来我们的分配可能就零点几毫秒,但是一旦FallBack出去就可能变成几毫秒,可以明显的感觉到一段东西加长。
什么时候可能出现呢?比如说我们的Animation/Animator系统,当我们的数据量很大的时候,Unity在计算整个Animator的时候,是用了大量的Tempory Location内存,也就是说用了大量的栈。在这个过程中,就有可能因为我们数据量过大而把整个栈撑爆。一旦撑爆了就会看见这个前面说的Tag,然后游戏出现卡顿。
这是因为动态堆分配的分配机制,分配原则和分配策略比这个要复杂很多,同时因为不能做Block的批量预分配,所以导致一次的分配会慢很多(老板再上一个饼)。
解决方法:
- 减少每一帧的数据量,例如原来一帧处理100个,变成一帧处理10个,分10帧去处理,这个速度会比一帧去处理快很多。
- 买unity源码,直接改底层代码,把栈加大一点就行了。
Managed Memory
接下来来讲讲托管内存,我们先来看下面一张图:
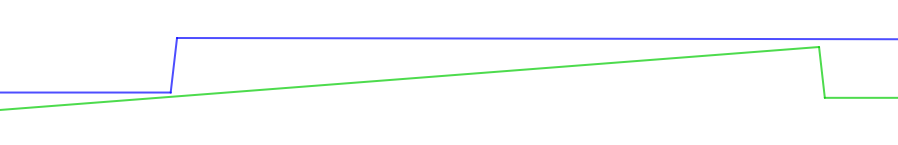
该图表示的是Unity的Mono Memory,蓝色的线表示预留的内存(Reserve),绿色的线表示已经使用了的内存(Use)。前半部分我们可以发现当使用的内存快达到和预留内存一样大小时,Unity会再申请一部分内存给预留内存。后半部分绿线突然降低说明此处发生了一次GC,使得很多使用内存被回收,但是预留内存并不会被回收,依旧保持现有的大小。
如果我们想要预留内存也被回收,那么首先我们的Scripting Backend要选IL2CPP,不能是Mono。然后当一个Block连续6次GC都没有被访问到,这块内存会被返回给系统,蓝线就会下来,条件非常苛刻。(之前的分享里讲到VM内存池时提到过)

上面的曲线是我们正常使用的一个曲线,接下里来看一个不正常的曲线,如下:

不正常在哪呢?我们可以发现当我们在预留内存还明显足够的情况下,分配了一小块使用内存,此时却导致了预留内存的增加。导致这个现象的其中一个问题就是内存碎片化,例如我们内存池里还有40byte的内存,但是却是由10个4byte的碎片内存组成的,此时我们想要分配一个6byte的内存(连续的内存),却没有地方可以放得下,因此只能增加预留内存。
因此内存池最根本的一个目的就是要减少内存碎片化。但是实际开发中还是会经常出现这样的问题,例如我们频繁的分配小内存,把整个内存打的特别散,这样就会出现内存碎片化的问题。
官方文档:
Boehm GC
简单来看下BDWGC(全称:Boehm-Demers-Weiser conservative garbage collector),也就是常说的Boehm回收器。其实它除了回收之外还做了很多分配的工作,甚至还可以用来检查内存泄漏。
而Unity用的是改良过的BDWGC,它属于保守式内存回收。目前主流的回收器有如下三种:
- 保守式回收(Conservative GC),以Boehm为代表。
- 分代式回收(Generational GC),以SGen(Simple Generational GC)为代表。
- 引用(计数)式内存回收(Reference Counting GC),例如Java就是使用的这种,但是它是结合了保守式的引用式内存回收。
那么为什么Unity不用分代式的呢?分代式的是否更好呢?答案是,虽然分代式确实有很多的优点,但是它们都要付出额外的代价。例如分代式的GC,它要进行内存块的移动,一块内存在频繁分配区长时间不动的话,会被移动到长时分配区,造成额外消耗。另外每次回收的时候还要进行一个评估,判断当前内存是否是一个活跃内存,这些东西都不是免费的,而是要消耗额外的CPU性能。当然sGen也有它的优势,例如它是可移动的,可以进行合并的(可以减少内存碎片)等等。但是在计算力本身就很紧张的移动平台上,再花费CPU去计算内存的搬迁和移动实际上是不合算的,引用计数也有类似的问题,所以unity还是使用相对比较保守的Boehm回收。
Boehm回收有两个特点,一是不分代和不合并的,所以可能会导致内存碎片。二是所有保守式内存回收都是非精准式内存回收。
何为非精准?常规理解是我分配出去的内存你可能收不回来。实际上还有另一层意思:你没分配的内存你可能也用不了。也就是说,一是我已经分配出去的内存在没有人在引用它的情况下,不一定能收得回来。二是我没有分配使用的内存,当你想去分配使用的时候也不一定用的了。
我们来从Boehm内存管理的简单模型入手(如下图),来理解为什么会导致前面的问题。

如图,Boehm在内存管理的时候实际上是两级的管理。第一级我们叫做类型(Kind),实际上就是一个三个元素的数组 GC_obj_kinds[3],如下图:

GC_obj_kinds[3]
它们用来区分不同的类型,例如无指针类型(ptrfree)、一般类型(normal)和不可回收类型(uncollectable)。不可回收类型一般是回收器自己要用的一块内存,都会分配到uncollectable。
每个Kind下面又包含一个列表:ok_freelist[MAXOBJGRANULES+1],其中MAXOBJGRANULES值为128,它也就是第二级的管理,如下图:

该数组中每一个元素它关联的内存块的大小,下标为index的元素对应大小为 16*index,因此下标为0的那个元素是没有用的。从下标为1元素开始对应着16字节,然后32字节,48字节...,以16字节为增量,最多到2KB(下标128*16=2048)。
在每个ok_freelist元素下又挂着一层链表,如图:

链表里面的每个元素代表的就是一小块内存,其内存大小就是 ok_freelist[i] 对应的大小。例如图中Size(16)下面挂着Block0,Block1,Block2,说明每个Block的大小都是16字节,Size(32)下面每个Block自然都是32字节。
所以总体来说,我们有一个GC_obj_kinds[3]数组,然后每个GC_obj_kinds元素下面会有一个ok_freelist[MAXOBJGRANULES+1]数组。而 ok_freelist[index] 里存的是一个链表指针,指向大小为 index*16 的内存块。
假如现在我们分配一个小于等于16字节大小的内存,那么就会把Size(16)链表里的空闲的内存块拿出来给用户来用。比如我就分配8字节的内存,但是会拿到一个16字节的内存块,那么多出来的8字节内存就会被浪费掉。但是如果在Size(16)的链表里找不到可用的内存块,那么就会去找Size(32)的链表。如果在32字节里找到一个可用的内存块,由于我们要的内存只有8字节,明显小于16,那么Unity会把这32字节的内存块一刀切成两块,给用户16字节,剩下的16字节挂到Size(16)的链表底下。若此时所有Size(n)里面都找不到可用的内存块,那么则会调用分配函数,分配较大一块内存,然后将大内存分割为小内存链表存储在ok_freelist中,可以理解为一个内存池。
假如我们先分配一个16字节的内存,使用掉Size(16)的Block0,然后再分配一个32字节的内存,使用掉Size(32)的Block0,此时这两块内存在物理上是连接的,虽然在逻辑上他们之前属于不同的链表。若此时这两块内存都不使用了,要回收它们,会怎么做呢?依旧分别插在对应的链表下么?并不是这样。当我们这两块内存同时被释放的时候,Unity在释放第一个Block0的时候会去找后面的物理内存(也就是第二个Block0)是否要被释放,发现这两块都要被释放的时候,那么就会把它们合并起来,让这个指针挂到更大的地方去,也就是Size(48)的链表下,从而去尽量减少整体内存碎片的问题。
也就是说Unity尽量会把空闲出来的内存合并成一个较大的内存块,同时以移动指针的方式(注意不是移动内存)把它挂到一个合适的链表下面,这就是整个内存分配的一个策略。
我们再来谈谈回收,以及为什么说他是非精准的原因。如下图,假如我们要回收ObjectA。

在保守内存回收器来看,当我要去回收一个内存块的时候,我会尝试找到这个内存块下面所有的指针(图中的0x011-0x013)指向的地址,并且标记为引用。例如图中ObjectA引用l ObjectB,当ObjectA发现不能被回收的时候,同时会标记ObjectB也不能被回收。这样的算法我们称之为标记清除算法(Mark&Sweep),即标记阶段通过标记所有根节点可达的对象,未被标记的对象则表示无引用、可回收,所有从堆中分配的内存Boehm中均有记录。
看着没什么问题,但是因为在内存这个层次上已经没有了整个class的信息,那怎么知道这个东西是一个数还是一个指针的呢?因为我们知道c++一份内存里东西它可以表示任何东西,它可以是个数也可以是个指针地址,它是什么都可以,你转是什么。比如0x011它可能是个地址指向了ObjectB,也可能单纯的就是个数而已。
那么我怎么知道它们是不是指针呢?Boehm用猜的,所以我们管它们叫潜在指针(potential pointer),并不确定是不是一个真的指针。Boehm会以一个pattern的方式来检查当前这个数有没有可能是一个指针。比如说我先去检查0x011地址里面有没有东西,发现有ObjectB,那么ObjectB就不会被回收。然后检查0x012,发现有ObjectC,那么ObjectC同样就不会被回收。但是实际上我们的0x012并不是一个指针,也就是说逻辑上来讲ObjectA和ObjectC没有引用关系,但是恰好分配在0x012内存上。但是对于Boehm来说发现0x012指的这块地方有东西,因此ObjectC就回收不了。最后检查0x013,发现它指向一块没有被使用的内存,那么Boehm就会把这块内存加到黑名单里,然后当你下次要进行大内存分配的时候,碰巧踩到了这个地址,Boehm会告诉你这块内存你不能用,得再去分配一块。这样就很好理解前面所说的非精准了,你要回收的内存可能收不回来,对于你没用的内存他也可能不让你用。
所以我们在做内存分配的时候要考虑先分配大内存,再分配小内存。因为当我们先分配大内存的时候,内存中对象较少,产生内存碎片和产生黑名单的概率都比较低。因为只有在分配大内存的时候,分配器才会去参考黑名单,看看这块内存是不是被黑掉了。如果我们先分配小内存,那么我们内存中的Object就会非常多,那么产生黑名单的概率就会变大,然后再分配大内存的时候就有可能你分配1MB内存,它给了你50MB内存用掉了,因为剩下那些内存全部被黑名单了(连续黑名单)。
另外一个原因是,当你先去分配大内存,比如1024字节的内存,用过大内存把它释放掉之后,那么这块内存就会被放到Size(1024)下。然后当我们需要扩展内存池的时候,会优先把已经分配出来的大内存切成一个个的小块,再去重复利用,并不会再去像系统申请新的物理内存。也就是说当我们先分配大内存再分配小内存的时候,之前表里的block会变多。
先分配小内存的话,此时内存已经被切散了,大的block都被变成一个个小的block了,当我们这些小内存被回收的时候,如果被回收的部分在物理上不是连续的,那么永远不会变回一个大的block。这样当我们需要扩展内存池的时候,就再也分配不出大内存,只能找系统去要了。就出现了之前曲线图里面的异常情况,再也分配不出来了,或者分配的这块被黑名单了,所以不得不再去向系统要一块内存。
//
Mono支持内存自动回收,因为MONO集成了内存回收算法。在1.X到2.X的版本中,MONO集成了贝母内存管理及回收算法;而在3.X或更高版本中,则开始启用SGEN内存管理及回收算法。本文研究了2.6.X版本的BOEHM(贝母)的内存管理及GC算法部分代码。
BOEHM属于一个开源项目,其实现为支持C/C的内存管理及GC,在C/C项目中,将分配内存部分接口(malloc或者其他分配内存等接口)替换成BOEHM提供的内存分配接口(GC_malloc),则可以在C/C++项目中实现内存自动管理,无需手动调用free等释放内存接口。而MONO正是基于BOEHM,实现了内存管理及自动GC。
GC实现的方式
引用计数算法:引用技术算法是唯一一种不用用到根集概念的GC算法。其基本思路是为每个对象加一个计数器,计数器记录的是所有指向该对象的引用数量。每次有一个新的引用指向这个对象时,计数器加一;反之,如果指向该对象的引用被置空或指向其它对象,则计数器减一。当计数器的值为0时,则自动删除这个对象。
Mark&Sweep算法:也叫标记清除算法,标记阶段通过标记所有根节点可达的对象,未被标记的对象则表示无引用,可回收,BOEHM正是使用该算法实现内存自动回收; 节点复制算法:将活的节点复制到新内存区,老内存区一次性释放,对象会被转移,应该还需要设置元数据中间层,具体实现未做研究;
BOEHM算法内存管理
BOEHM算法采用标记清除法,在标记阶段通过访问根节点,并遍历到叶子节点,最终将所有存在引用的内存都标记出来,而未标记的内存(所有从堆中分配的内存BOEHM中均有记录,因此可将未标记的部分清除释放掉)。
下面介绍BOEHM分配内存过程,在介绍分配流程之前,先介绍关键数据结构。
GC_size_map[2049]
一个MAXOBJBYTES(2048+1)个元素的数组,每个数组为一个整数值,分配该内存为了在分配内存时快速定位出分配的粒度的倍数(其实完全可以用(bytes+16-1)/16来规避掉这个数组,这么做应该是为了减少计算量…),而16这个是BOEHM分配内存的最小粒度,也就是说分配1字节,BOEHM也会给你分配16字节的内存(我这里看代码时是根据64位机器定义的宏来分析的,不同平台字节略有差异,不影响分析)。
同时若分配的内存大小大于2048时,此时要执行另一个大内存分配分支(由于流程大同小异,因此对大内存分配暂时做研究,下述介绍均为对2048个字节内的内存分配及回收介绍)。
GC_obj_kinds[3]
三个元素的数组,BOEHM定义这个数组是为了区分分配的内存类型,在BOEHM中,存在存储指针内存,普通内存和非回收内存之分,本周的分析为普通内存分配的流程(因为这是应用程序调用最为频繁,而非回收内存属于BOEHM自己为了最到内存管理而分配的内存,这些内存不需要标记和回收的),每个元素包含一个ok_freelist[MAXOBJGRANULES+1]的数组,MAXOBJGRANULES为128,为128的原因是,每个GRANULES是一个分配粒度,即16字节,那么12816=2048,刚好是能分配的小内存的上限。
ok_freelist这个数组每个元素为一个空闲链表的指针,指向的内存块大小是index16,即第一个元素存储16个字节大小块的内存块链表指针,而第128个元素存储的链表中内存块大小为128*16=2048的内存块大小的指针。
这个数组保存的内存块大小作用为:当分配内存时,会优先检查该链表是否存在FREE块,若存在,则直接可以在链表中取出一块返回给应用上层,若否,则会再调用分配函数,分配较大一块内存,然后将大内存分割为小内存链表存储在ok_freelist中(具体存储INDEX由上层分配的内存大小需要几个GRANULE决定)。
GC_hblkfreelist[N_HBLK_FLS+1]
数组N_HBLK_FLS=28(为何是这个值是因为设计就是这样),GC_hblkfreelist每个元素存储的也是一个空闲内存链表,与ok_freelist不同的是,它的内存基本块大小是PAGE_SIZE,即4096,与ok_freelist类似,每个元素存储的链表块大小与index相关,可以这么理解,第一个元素的链表内存块大小为PAGE_SIZE,第二个为PAGE_SIZE*2,以此类推。由于本文只介绍小内存分配,因此不需要考虑特别大内存分配的处理方式。
当需要分配内存时,例如当请求分配16个字节的内存时(上层调用下来的已经进行粒度GRANULE对齐了),此时会将其进行(bytes+PAGE_SIZE-1)/PAGE_SIZE得到index,然后检测GC_hblkfreelist[index]是否存在空闲快,若无则会继续向后遍历,找到后,将大块拆分成小块,再重新将两个小块的后一块推入GC_hblkfreelist合适的位置,将前一块用来分配,由于上层只分配16字节内存,当给了上层PAGE_SIZE大小的内存,此时会将该内存按照16字节划分,并生成链表(链表指针无需额外增加内存,只用16字节的中的前8个字节作为指针即可),将链表存储到ok_freelist[1]中,此时上层就能完成内存分配。
GC_hblkfreelist中的内存是通过下述调用来分配:

从上可以看出,一个内存分配过程,首先会检测ok_freelist链表,若存在FREE块,则直接取出返回(当然会设置使用标记,GC会使用),若ok_freelist中无对应大小的内存,则从GC_hblkfreelist调用获取PAGE_SIZE内存并存储,下次再分配就可以直接从ok_freelist中取得了,相当于做了一个简型内存池。
Hblkhdr数据结构
此数据结构为关键数据结构,GC能否正常运行全靠这个块信息描述。当从GC_hblkfreelist分配PAGE_SIZE的一块内存时,会生成一个hblkhdr的对象,此对象描述该PAGE_SIZE内存块,该hblkhdr会存储(hb_sz, hb_mark5,descr等信息),hb_sz存储上层分配的传递的内存块大小,当分配16字节时,hb_sz就会被设置为16。
设置这个元素的作用就是为了知晓存储在该PAGE中的元素的大小(若分配16字节,说明上层分配内存存储的对象最大为16字节),而hb_mark用来存储该PAGE哪些块被使用(每个BIT可以描述一个小块,每个小块最小为16字节,因此5个8字节有足够的BIT位来描述一个PAGE,因为可以描述588*16个字节,超过了4096个字节)。
分配好HBLKHDR结构后,它会被存储到二级数组中,存储方式为(这里假定PAGE的起始位置为P指针) top_index[p>>22]->bottom_index[p>>12 & 1024]的位置,12是因为每个PAGE为4096字节,即2的12次方。即会把每个PAGE的地址的高10位作为索引,中10位作为索引,在二级数组中存储该HBLKHDR(当然,这个二级数组并非一启动就生成这么大的二级数组,而是运行过程中生成(否则过于浪费内存,如果一开始就生成,则至少需要102410248,即8M内存,而很多巢位在运行期间根本不会被用到)),
生成了这个数据后,任何一个指针都可以找到它属于的HBLKHDR的描述符,而根据该描述符,可以知晓该指针指向的对象最大的内存块大小以及它的标记情况(hb_sz和hb_mark)。
介绍完上述之后,大概可以有一个思路,分配内存的大体流程为:先检查ok_freelist—->GC_hblkfreelist—>分配一个PAGE—>并分配描述HBLKHDR。
其进行的函数调用堆栈为:

也会调用setup_header用来初始化对应的HBLKHDR,调用GC_install_header来分配第二级数组及分配HBLKHDR(这个结构是从非回收内存中分配的)。
MemoryManager.FallbackAllocation
I should clarify that the profiler isn't lying about the fallback allocations. Those fallback allocations are indeed happening, but it may not be clear exactly where or how it occurs. Usually, they occur because someone forgot to free an allocation from the Allocator.TempJob allocator. If the leak starts to accumulate, it can exhaust Allocator.TempJob's fast memory arena and start to use the fallback instead to satisfy allocation requests. These fallback allocations are costly and that's what's being reported in the profiler. The way to fix this is to find the leak and plug it.
Most of the time, the leak is from forgetting to dispose a native container or forgetting to call UnsafeUtility.Free() on native memory that you explicitly requested. Usually, forgetting to dispose a native container is not a big problem since we have leak checking built in to Collections native containers to help you find those leaks. But if you have used UnsafeUtility.Malloc() to get memory on your own, there is no built in leak checking for that so you have to be very careful to UnsafeUtility.Free() everything. Finding this kinds of leak is very challenging at the moment and we are currently working on a solution to make it much easier to find these.
Another possibility is that Unity's code is leaking somewhere and as a side effect, your allocations may be hitting the fallback because the allocator is full. In these cases, the problem is still fundamentally the same but you may have less visibility into where the leak is originating from. This is a super frustrating case and we're working on finding these leaks and fixing them so they don't affect customers.
One diagnostic check to see if you're running into memory leaks is to see if you have this message in your log:
Internal: JobTempAlloc has allocations that are more than 4 frames old - this is not allowed and likely a leak If you have that, you are almost certainly running into this problem due to memory leaks and should start looking for any cases where a dispose or UnsafeUtility.Free call is missing. Unfortunately, if you don't have full source code access, you won't be able to get much help in terms of finding where the leak is originating from (this is what we're improving right now).
Finally, another way you can get fallback allocations without a leak is if you happen to be allocating memory that's too big for Allocator.TempJob to satisfy. For example, if you're allocating megabytes of memory in one allocation, then it's unlikely to fit in the fast arena that Allocator.TempJob maintains so it is forced to fallback allocate. These cases are uncommon and usually don't fill the profiler timeline the same way as having a leak because large, multi-megabyte allocations are done seldomly. But it's still worth checking to see how much memory you're requesting to see if this is the reason why the fallback allocation is done. Usually, the cutoff is 1 MB before you start to use the fallback allocator.
//


 4890
4890


 被折叠的 条评论
为什么被折叠?
被折叠的 条评论
为什么被折叠?
 到【灌水乐园】发言


