


介绍
ggpubr是我经常会用到的R包,它傻瓜式的画图方式对很多初次接触R绘图的人来讲是很友好的。该包有个stat_compare_means函数可以做组间假设检验分析。
安装R包
install.packages("ggpubr")
devtools::devtools::install_github("kassambara/ggpubr")
library(ggpubr)
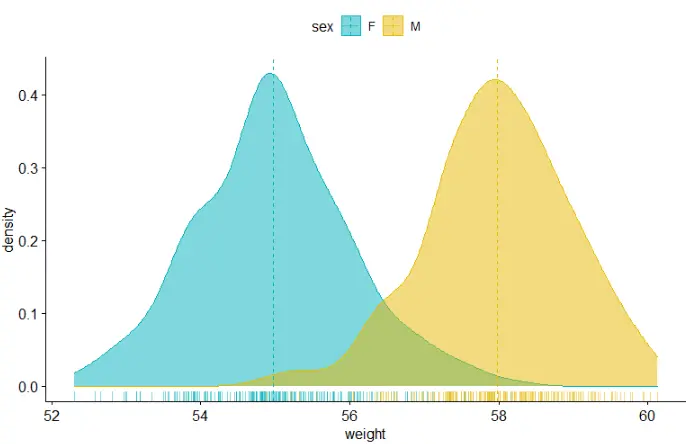
plotdata <- data.frame(sex = factor(rep(c("F", "M"), each=200)),
weight = c(rnorm(200, 55), rnorm(200, 58)))
密度图density
ggdensity(plotdata,
          x = "weight",
          add = "mean",
          rug = TRUE,    # x轴显示分布密度
          color = "sex",
          fill = "sex",

 订阅专栏 解锁全文


 366
366

 被折叠的 条评论
为什么被折叠?
被折叠的 条评论
为什么被折叠?
 到【灌水乐园】发言


