


✅博主简介:热爱科研的Matlab仿真开发者,修心和技术同步精进,Matlab项目合作可私信。
🍎个人主页:海神之光
🏆代码获取方式:
海神之光Matlab王者学习之路—代码获取方式
⛳️座右铭:行百里者,半于九十。
更多Matlab仿真内容点击👇
Matlab图像处理(进阶版)
路径规划(Matlab)
神经网络预测与分类(Matlab)
优化求解(Matlab)
语音处理(Matlab)
信号处理(Matlab)
车间调度(Matlab)
⛄一、DWA算法简介
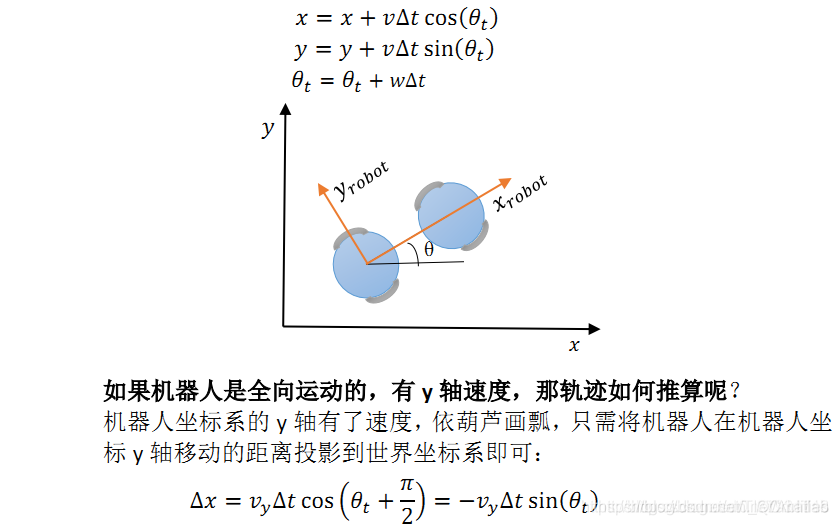
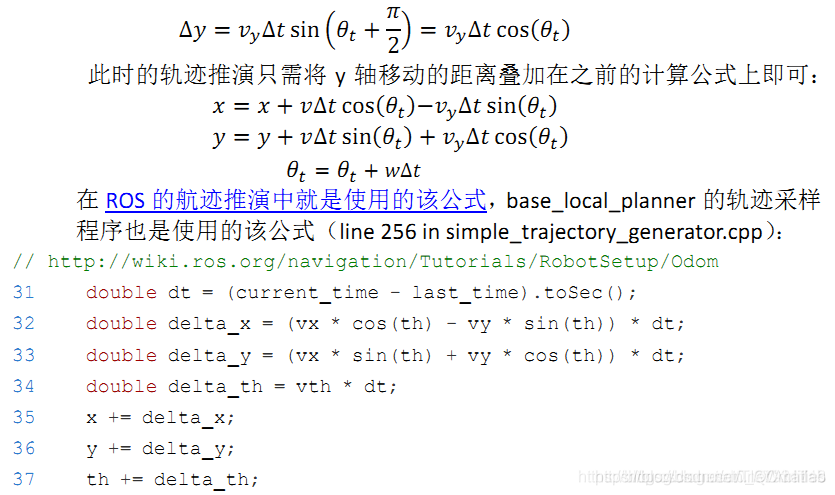
DWA算法全称为dynamic window approach,其原理主要是在速度空间(v,w)中采样多组速度,并模拟这些速度在一定时间内的运动轨迹,再通过一个评价函数对这些轨迹打分,最优的速度被选择出来发送给下位机。
1 原理分析
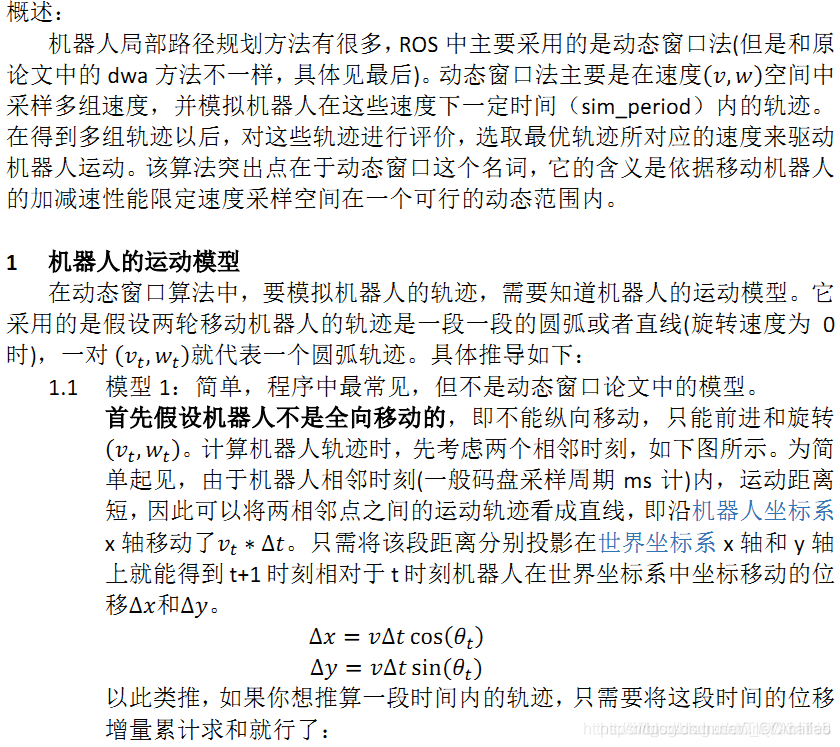
2 速度采样
机器人的轨迹运动模型有了,根据速度就可以推算出轨迹。
因此只需采样很多速度,推算轨迹,然后评价这些轨迹好不好就行了。
(一)移动机器人受自身最大速度最小速度的限制
(二) 移动机器人受电机性能的影响:由于电机力矩有限,存在最大的加減速限制,因此移动机器人軌迹前向模拟的周期sim_period内,存在一个动态窗口,在该窗口内的速度是机器人能够实际达到的速度:
(三) 基于移动机器人安全的考虑:为了能够在碰到障碍物前停下来, 因此在最大减速度条件下, 速度有一个范围。
⛄二、部分源代码
function varargout = Simulate(varargin)
clc
SamplingPeriod = 0.1;
time = 0;
timer1 = [];
txt_timer = [];
FuzzyLoaded = 0;
Z1 = [];
Z2 = [];
W_Zone = 20;
H_Zone = 20;
data = importdata (‘fuzzytabledata.mat’);
OUT1 = data.OUT1;
OUT2 = data.OUT2;
Z1 = reshape(OUT1(102:end,1)‘,101,[]);
Z2 = reshape(OUT2(102:end,1)’,101,[]);
FuzzyLoaded = 1;
scrsz = get(0,‘ScreenSize’);
% Create a figure that will have a uitable, axes and checkboxes
figure(‘Position’,[15scrsz(3)/100 70 scrsz(3)-2(15*scrsz(3)/100) scrsz(4)-100],…
‘WindowStyle’, ‘normal’,…
‘CloseRequestFcn’,{@CloseFcn},…
‘Name’, ‘具有动态障碍物的DWA仿真’,… % Title figure
‘NumberTitle’, ‘off’) % Do not show figure number
% figure(‘Position’,[15scrsz(3)/100 70 scrsz(3)-2(15*scrsz(3)/100) scrsz(4)-100],…
% ‘WindowStyle’, ‘normal’,…
% ‘CloseRequestFcn’,{@CloseFcn},…
% ‘Name’, ‘具有动态障碍物的DWA仿真’,… % Title figure
% ‘NumberTitle’, ‘off’,… % Do not show figure number
% ‘MenuBar’, ‘none’); % Hide standard menu bar menus
% Create an axes set x and y limits to the value extremes, and format labels
W_Zone = ceil(W_Zone/10)*10;
H_Zone = ceil(H_Zone/10)*10;
haxes = axes(‘Units’, ‘normalized’,…
‘Position’, [.25 .05 0.75 0.9],…
‘XLim’, [-W_Zone/2 W_Zone/2],…
‘YLim’, [-H_Zone/2 H_Zone/2],…
‘XLimMode’, ‘manual’,…
‘YLimMode’, ‘manual’,…
‘XTick’,-W_Zone/2:1:W_Zone/2,…
‘YTick’,-H_Zone/2:1:H_Zone/2);%,…
% ‘XTickLabel’,…
% {‘-10 m’,‘-5 m’,‘0’,‘5 m’,‘10 m’},…
% ‘YTickLabel’,…
% {‘-10 m’,‘-5 m’,‘0’,‘5 m’,‘10 m’});
set(haxes,‘DataAspectRatio’,[1 1 1]);
title(haxes, ‘移动机器人动态避障仿真’) % Describe data set
% Prevent axes from clearing when new lines or markers are plotted
hold(haxes, ‘all’)
grid on;
uicontrol(‘Style’, ‘pushbutton’,…
‘Units’, ‘normalized’,…
‘Position’, [.02 .86 .2 .05],…
‘String’, ‘开始仿真’,…
‘Value’, 0,…
‘Callback’, {@StartSimulation});
uicontrol(‘Style’, ‘pushbutton’,…
‘Units’, ‘normalized’,…
‘Position’, [.02 .81 .2 .05],…
‘String’, ‘重新仿真’,…
‘Value’, 0,…
‘Callback’, {@ResetSimulation});
% % Create a text to show timer;
txt_timer = uicontrol(‘Style’, ‘text’,…
‘Units’, ‘normalized’,…
‘Position’, [.02 .915 .2 .035],…
‘FontWeight’, ‘bold’,…
‘ForegroundColor’, [0 .2 .8],…
‘fontname’, ‘Helvetica’,…
‘fontsize’, 14,…
‘BackgroundColor’, ‘w’, ‘String’,‘00:00 00’);
% % Create some texts to monitor variables;
txt_inp1 = uicontrol(‘Style’, ‘text’, ‘Units’, ‘normalized’, ‘Position’, [.05 .54 .08 .035],…
‘FontWeight’, ‘bold’, ‘ForegroundColor’, [0 0 0], ‘fontname’, ‘Helvetica’, ‘fontsize’, 12, ‘BackgroundColor’, [0.9 0.9 0.9]);
txt_inp2 = uicontrol(‘Style’, ‘text’, ‘Units’, ‘normalized’, ‘Position’, [.14 .54 .08 .035],…
‘FontWeight’, ‘bold’, ‘ForegroundColor’, [0 0 0], ‘fontname’, ‘Helvetica’, ‘fontsize’, 12, ‘BackgroundColor’, [0.9 0.9 0.9]);
txt_out1 = uicontrol(‘Style’, ‘text’, ‘Units’, ‘normalized’, ‘Position’, [.05 .47 .08 .035],…
‘FontWeight’, ‘bold’, ‘ForegroundColor’, [0 0 0], ‘fontname’, ‘Helvetica’, ‘fontsize’, 12, ‘BackgroundColor’, [0.9 0.9 0.9]);
txt_out2 = uicontrol(‘Style’, ‘text’, ‘Units’, ‘normalized’, ‘Position’, [.14 .47 .08 .035],…
‘FontWeight’, ‘bold’, ‘ForegroundColor’, [0 0 0], ‘fontname’, ‘Helvetica’, ‘fontsize’, 12, ‘BackgroundColor’, [0.9 0.9 0.9]);
uicontrol(‘Style’, ‘text’,‘Units’, ‘normalized’, ‘Position’, [.05 .61 .15 .025],…
‘FontWeight’, ‘bold’, ‘fontname’, ‘Helvetica’, ‘fontsize’, 10,…
‘BackgroundColor’, [0.8 0.8 0.8], ‘String’, ‘DWA权值调整’);
uicontrol(‘Style’, ‘text’,‘Units’, ‘normalized’, ‘Position’, [.00 .55 .05 .02],…
‘FontWeight’, ‘bold’, ‘fontname’, ‘Helvetica’, ‘fontsize’, 9,…
‘BackgroundColor’, [0.8 0.8 0.8], ‘String’, ‘INPs :’);
uicontrol(‘Style’, ‘text’,‘Units’, ‘normalized’, ‘Position’, [.00 .48 .05 .02],…
‘FontWeight’, ‘bold’, ‘fontname’, ‘Helvetica’, ‘fontsize’, 9,…
‘BackgroundColor’, [0.8 0.8 0.8], ‘String’, ‘误差值 :’);
uicontrol(‘Style’, ‘text’,‘Units’, ‘normalized’, ‘Position’, [.05 .58 .08 .02],…
‘FontWeight’, ‘bold’, ‘fontname’, ‘Helvetica’, ‘fontsize’, 9,…
‘BackgroundColor’, [0.8 0.8 0.8], ‘String’, ‘目标航向角’);
uicontrol(‘Style’, ‘text’,‘Units’, ‘normalized’, ‘Position’, [.14 .58 .08 .02],…
‘FontWeight’, ‘bold’, ‘fontname’, ‘Helvetica’, ‘fontsize’, 9,…
‘BackgroundColor’, [0.8 0.8 0.8], ‘String’, ‘障碍物’);
uicontrol(‘Style’, ‘text’,‘Units’, ‘normalized’, ‘Position’, [.05 .51 .08 .02],…
‘FontWeight’, ‘bold’, ‘fontname’, ‘Helvetica’, ‘fontsize’, 9,…
‘BackgroundColor’, [0.8 0.8 0.8], ‘String’, ‘左偏离’);
uicontrol(‘Style’, ‘text’,‘Units’, ‘normalized’, ‘Position’, [.14 .51 .08 .02],…
‘FontWeight’, ‘bold’, ‘fontname’, ‘Helvetica’, ‘fontsize’, 9,…
‘BackgroundColor’, [0.8 0.8 0.8], ‘String’, ‘右偏离’);
uicontrol(‘Style’, ‘text’,‘Units’, ‘normalized’, ‘Position’, [.09 .78 .12 .025],…
‘FontWeight’, ‘bold’, ‘fontname’, ‘Helvetica’, ‘fontsize’, 10,…
‘BackgroundColor’, [0.8 0.8 0.8], ‘String’, ‘X Y’);
uicontrol(‘Style’, ‘text’,‘Units’, ‘normalized’, ‘Position’, [.02 .74 .06 .03],…
‘FontWeight’, ‘bold’, ‘fontname’, ‘Helvetica’, ‘fontsize’, 10,…
‘BackgroundColor’, [0.8 0.8 0.8], ‘String’, ‘起始点坐标:’);
uicontrol(‘Style’, ‘text’,‘Units’, ‘normalized’, ‘Position’, [.02 .7 .06 .03],…
‘FontWeight’, ‘bold’, ‘fontname’, ‘Helvetica’, ‘fontsize’, 10,…
‘BackgroundColor’, [0.8 0.8 0.8], ‘String’, ’ 目标点坐标:');
% % Create a text get Robot X0 Pos;
edit_robot_x0 = uicontrol(‘Style’, ‘edit’,…
‘Units’, ‘normalized’,…
‘Position’, [.09 .74 .06 .035],… %‘String’,… %‘Use Plot check boxes to graph columns’,…
‘FontWeight’, ‘bold’,…
‘fontname’, ‘Helvetica’,…
‘fontsize’, 12);
% % Create a text get Robot Y0 Pos;
edit_robot_y0 = uicontrol(‘Style’, ‘edit’,…
‘Units’, ‘normalized’,…
‘Position’, [.16 .74 .06 .035],… %‘String’,… %‘Use Plot check boxes to graph columns’,…
‘FontWeight’, ‘bold’,…
‘fontname’, ‘Helvetica’,…
‘fontsize’, 12);
% % Create a text get Goal X Pos;
edit_goal_x = uicontrol(‘Style’, ‘edit’,…
‘Units’, ‘normalized’,…
‘Position’, [.09 .7 .06 .035],… %‘String’,… %‘Use Plot check boxes to graph columns’,…
‘FontWeight’, ‘bold’,…
‘fontname’, ‘Helvetica’,…
‘fontsize’, 12);
% % Create a text get Goal Y Pos;
edit_goal_y = uicontrol(‘Style’, ‘edit’,…
‘Units’, ‘normalized’,…
‘Position’, [.16 .7 .06 .035],… %‘String’,… %‘Use Plot check boxes to graph columns’,…
‘FontWeight’, ‘bold’,…
‘fontname’, ‘Helvetica’,…
‘fontsize’, 12);
uicontrol(‘Style’, ‘pushbutton’,…
‘Units’, ‘normalized’,…
‘Position’, [.09 .655 .13 .04],… %‘TooltipString’, ‘Update Values Independently’,…
‘String’, ‘更新’,…
‘Value’, 0,…
‘Callback’, {@UpdateParams});
slider_x = uicontrol(‘Style’, ‘slider’,‘Units’, ‘normalized’, ‘Position’, [.02 .41 .2 .025],…
‘FontWeight’, ‘bold’, ‘fontname’, ‘Helvetica’, ‘fontsize’, 10,…
‘BackgroundColor’, [0.8 0.8 0.8],‘Min’,0,‘Value’,1,‘Max’,2,‘SliderStep’,[0.01 0.1]);
slider_y = uicontrol(‘Style’, ‘slider’,‘Units’, ‘normalized’, ‘Position’, [.02 .37 .2 .025],…
‘FontWeight’, ‘bold’, ‘fontname’, ‘Helvetica’, ‘fontsize’, 10,…
‘BackgroundColor’, [0.8 0.8 0.8],‘Min’,0,‘Value’,1,‘Max’,2,‘SliderStep’,[0.01 0.1]);
% uicontrol(‘Style’, ‘pushbutton’,…
% ‘Units’, ‘normalized’,…
% ‘Position’, [0.35 .95 .25 .05],… %‘TooltipString’, ‘Update Values Independently’,…
% ‘String’, ‘Save Data’,…
% ‘Value’, 0,…
% ‘Callback’, {@SaveData});
% % Create an invisible marker plot of the data and save handles
% % to the lineseries objects; use this to simulate data brushing.
% % hmkrs = plot([1:10],[1:10].^2, ‘LineStyle’, ‘none’,…
% % ‘Marker’, ‘o’,…
% % ‘MarkerFaceColor’, ‘y’,…
% % ‘HandleVisibility’, ‘off’,…
% % ‘Visible’, ‘on’);
% Create three check boxes to toggle plots for columns
% uicontrol(‘Style’, ‘checkbox’,…
% ‘Units’, ‘normalized’,…
% ‘Position’, [.10 .96 .09 .035],…
% ‘TooltipString’, ‘Check to plot column 1’,…
% ‘String’, ‘Col 1’,…
% ‘Value’, 0,…
% ‘Callback’, {@plot_callback,1});
%
% % Create a text label to say what the checkboxes do
% uicontrol(‘Style’, ‘text’,…
% ‘Units’, ‘normalized’,…
% ‘Position’, [.025 .955 .06 .035],…
% ‘String’, ‘Plot’,…
% ‘FontWeight’, ‘bold’);
⛄三、运行结果


⛄四、matlab版本及参考文献
1 matlab版本
2014a
2 参考文献
[1]卞永明,季鹏成,周怡和,杨濛.基于改进型DWA的移动机器人避障路径规划[J].中国工程机械学报. 2021,19(01)
3 备注
简介此部分摘自互联网,仅供参考,若侵权,联系删除
🍅 仿真咨询
1 各类智能优化算法改进及应用
生产调度、经济调度、装配线调度、充电优化、车间调度、发车优化、水库调度、三维装箱、物流选址、货位优化、公交排班优化、充电桩布局优化、车间布局优化、集装箱船配载优化、水泵组合优化、解医疗资源分配优化、设施布局优化、可视域基站和无人机选址优化
2 机器学习和深度学习方面
卷积神经网络(CNN)、LSTM、支持向量机(SVM)、最小二乘支持向量机(LSSVM)、极限学习机(ELM)、核极限学习机(KELM)、BP、RBF、宽度学习、DBN、RF、RBF、DELM、XGBOOST、TCN实现风电预测、光伏预测、电池寿命预测、辐射源识别、交通流预测、负荷预测、股价预测、PM2.5浓度预测、电池健康状态预测、水体光学参数反演、NLOS信号识别、地铁停车精准预测、变压器故障诊断
3 图像处理方面
图像识别、图像分割、图像检测、图像隐藏、图像配准、图像拼接、图像融合、图像增强、图像压缩感知
4 路径规划方面
旅行商问题(TSP)、车辆路径问题(VRP、MVRP、CVRP、VRPTW等)、无人机三维路径规划、无人机协同、无人机编队、机器人路径规划、栅格地图路径规划、多式联运运输问题、车辆协同无人机路径规划、天线线性阵列分布优化、车间布局优化
5 无人机应用方面
无人机路径规划、无人机控制、无人机编队、无人机协同、无人机任务分配
6 无线传感器定位及布局方面
传感器部署优化、通信协议优化、路由优化、目标定位优化、Dv-Hop定位优化、Leach协议优化、WSN覆盖优化、组播优化、RSSI定位优化
7 信号处理方面
信号识别、信号加密、信号去噪、信号增强、雷达信号处理、信号水印嵌入提取、肌电信号、脑电信号、信号配时优化
8 电力系统方面
微电网优化、无功优化、配电网重构、储能配置
9 元胞自动机方面
交通流 人群疏散 病毒扩散 晶体生长
10 雷达方面
卡尔曼滤波跟踪、航迹关联、航迹融合


 1286
1286


 被折叠的 条评论
为什么被折叠?
被折叠的 条评论
为什么被折叠?
 到【灌水乐园】发言


