


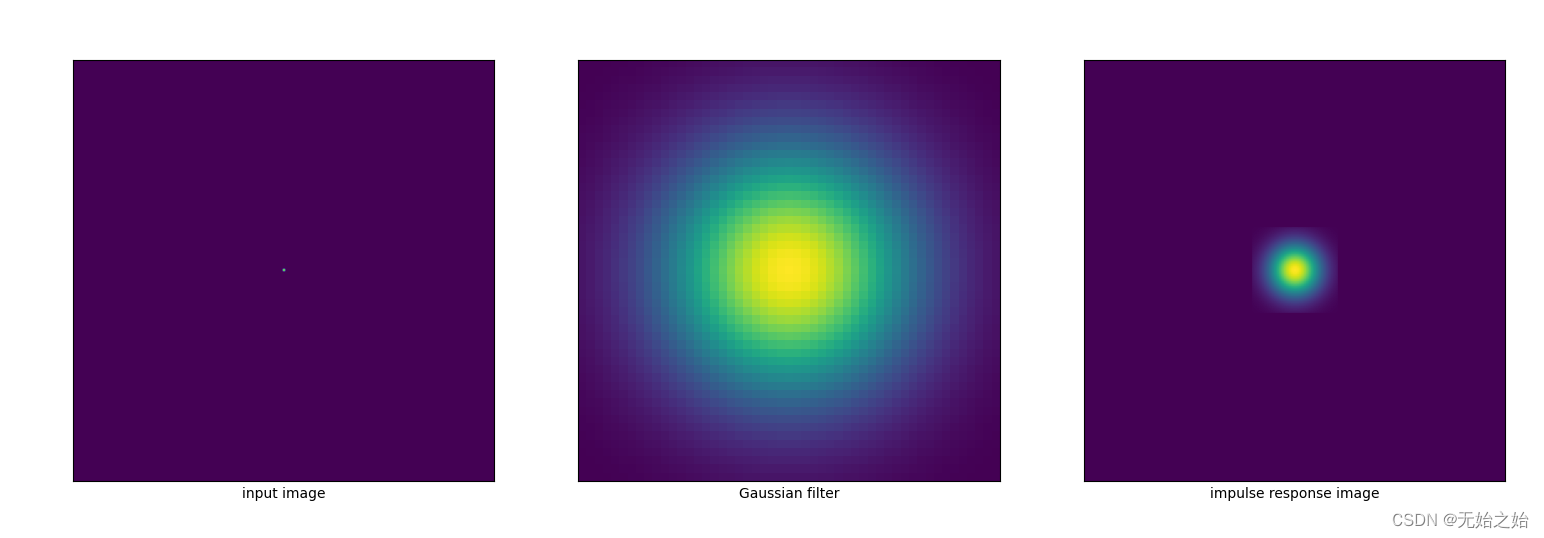
图像对滤波器的冲激响应实际上就是将滤波器看作一个传递函数,输入为一张只有某个像素点是1,其他像素点为0的空白图像,令该滤波器对这张图像作卷积运算。输出图像就是其滤波器的冲激响应。
import numpy as np
from scipy.signal import correlate
import matplotlib.pyplot as plt

# Create a gaussian filter
wDeg = 1
nPix = 50
xf = np.linspace(-wDeg/2, wDeg/2, nPix+1).reshape(1, -1)
yf = np.linspace(-wDeg/2, wDeg/2, nPix+1).reshape(-1, 1)
sigma = 0.3  # width of Gaussian (1/e half-width)
gau_filter = np.exp(-(np.power(xf, 2)+np.power(yf, 2))/sigma**2)
# plt.imshow(gau_filter)
# plt.show()

# Create a Dirac image
nPix = 200
dirac_img = np.zeros((nPix + 1, nPix + 1))
dirac_img[nPix//2, nPix//2] = 1
# plt.imshow(dirac_img)
# plt.show()

# Perform impulse response test
# - Dirac image as input
# - Gaussian filter as the system to be tested
# - Output convoluted image as the result image
res_img = correlate(dirac_img, gau_filter)
# plt.imshow(res_img)
# plt.show()

# Display intermediate and final results
plt.figure()
img_list = [dirac_img, gau_filter, res_img]
img_label = ['input image', 'Gaussian filter', 'impulse response image']
for i in range(1, 4):
    plt.subplot(1,3,i)
    plt.imshow(img_list[i-1])
    plt.xticks([])
    plt.yticks([])
    plt.xlabel(img_label[i-1])
plt.show()
最后输出结果如下:


 5419
5419


 被折叠的 条评论
为什么被折叠?
被折叠的 条评论
为什么被折叠?
 到【灌水乐园】发言


