1写在前面
当完成了对scRNAseq数据的Normalization和混杂因素去除后,我们就可以开始正式分析了。😘
本期我们介绍一下常用的聚类方法(clustering),主要是无监督聚类,包括:👇
-
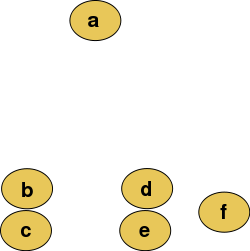
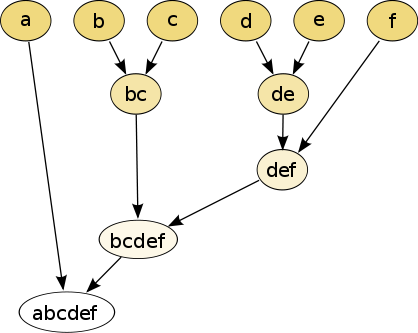
hierarchical clustering; -
k-means clustering; -
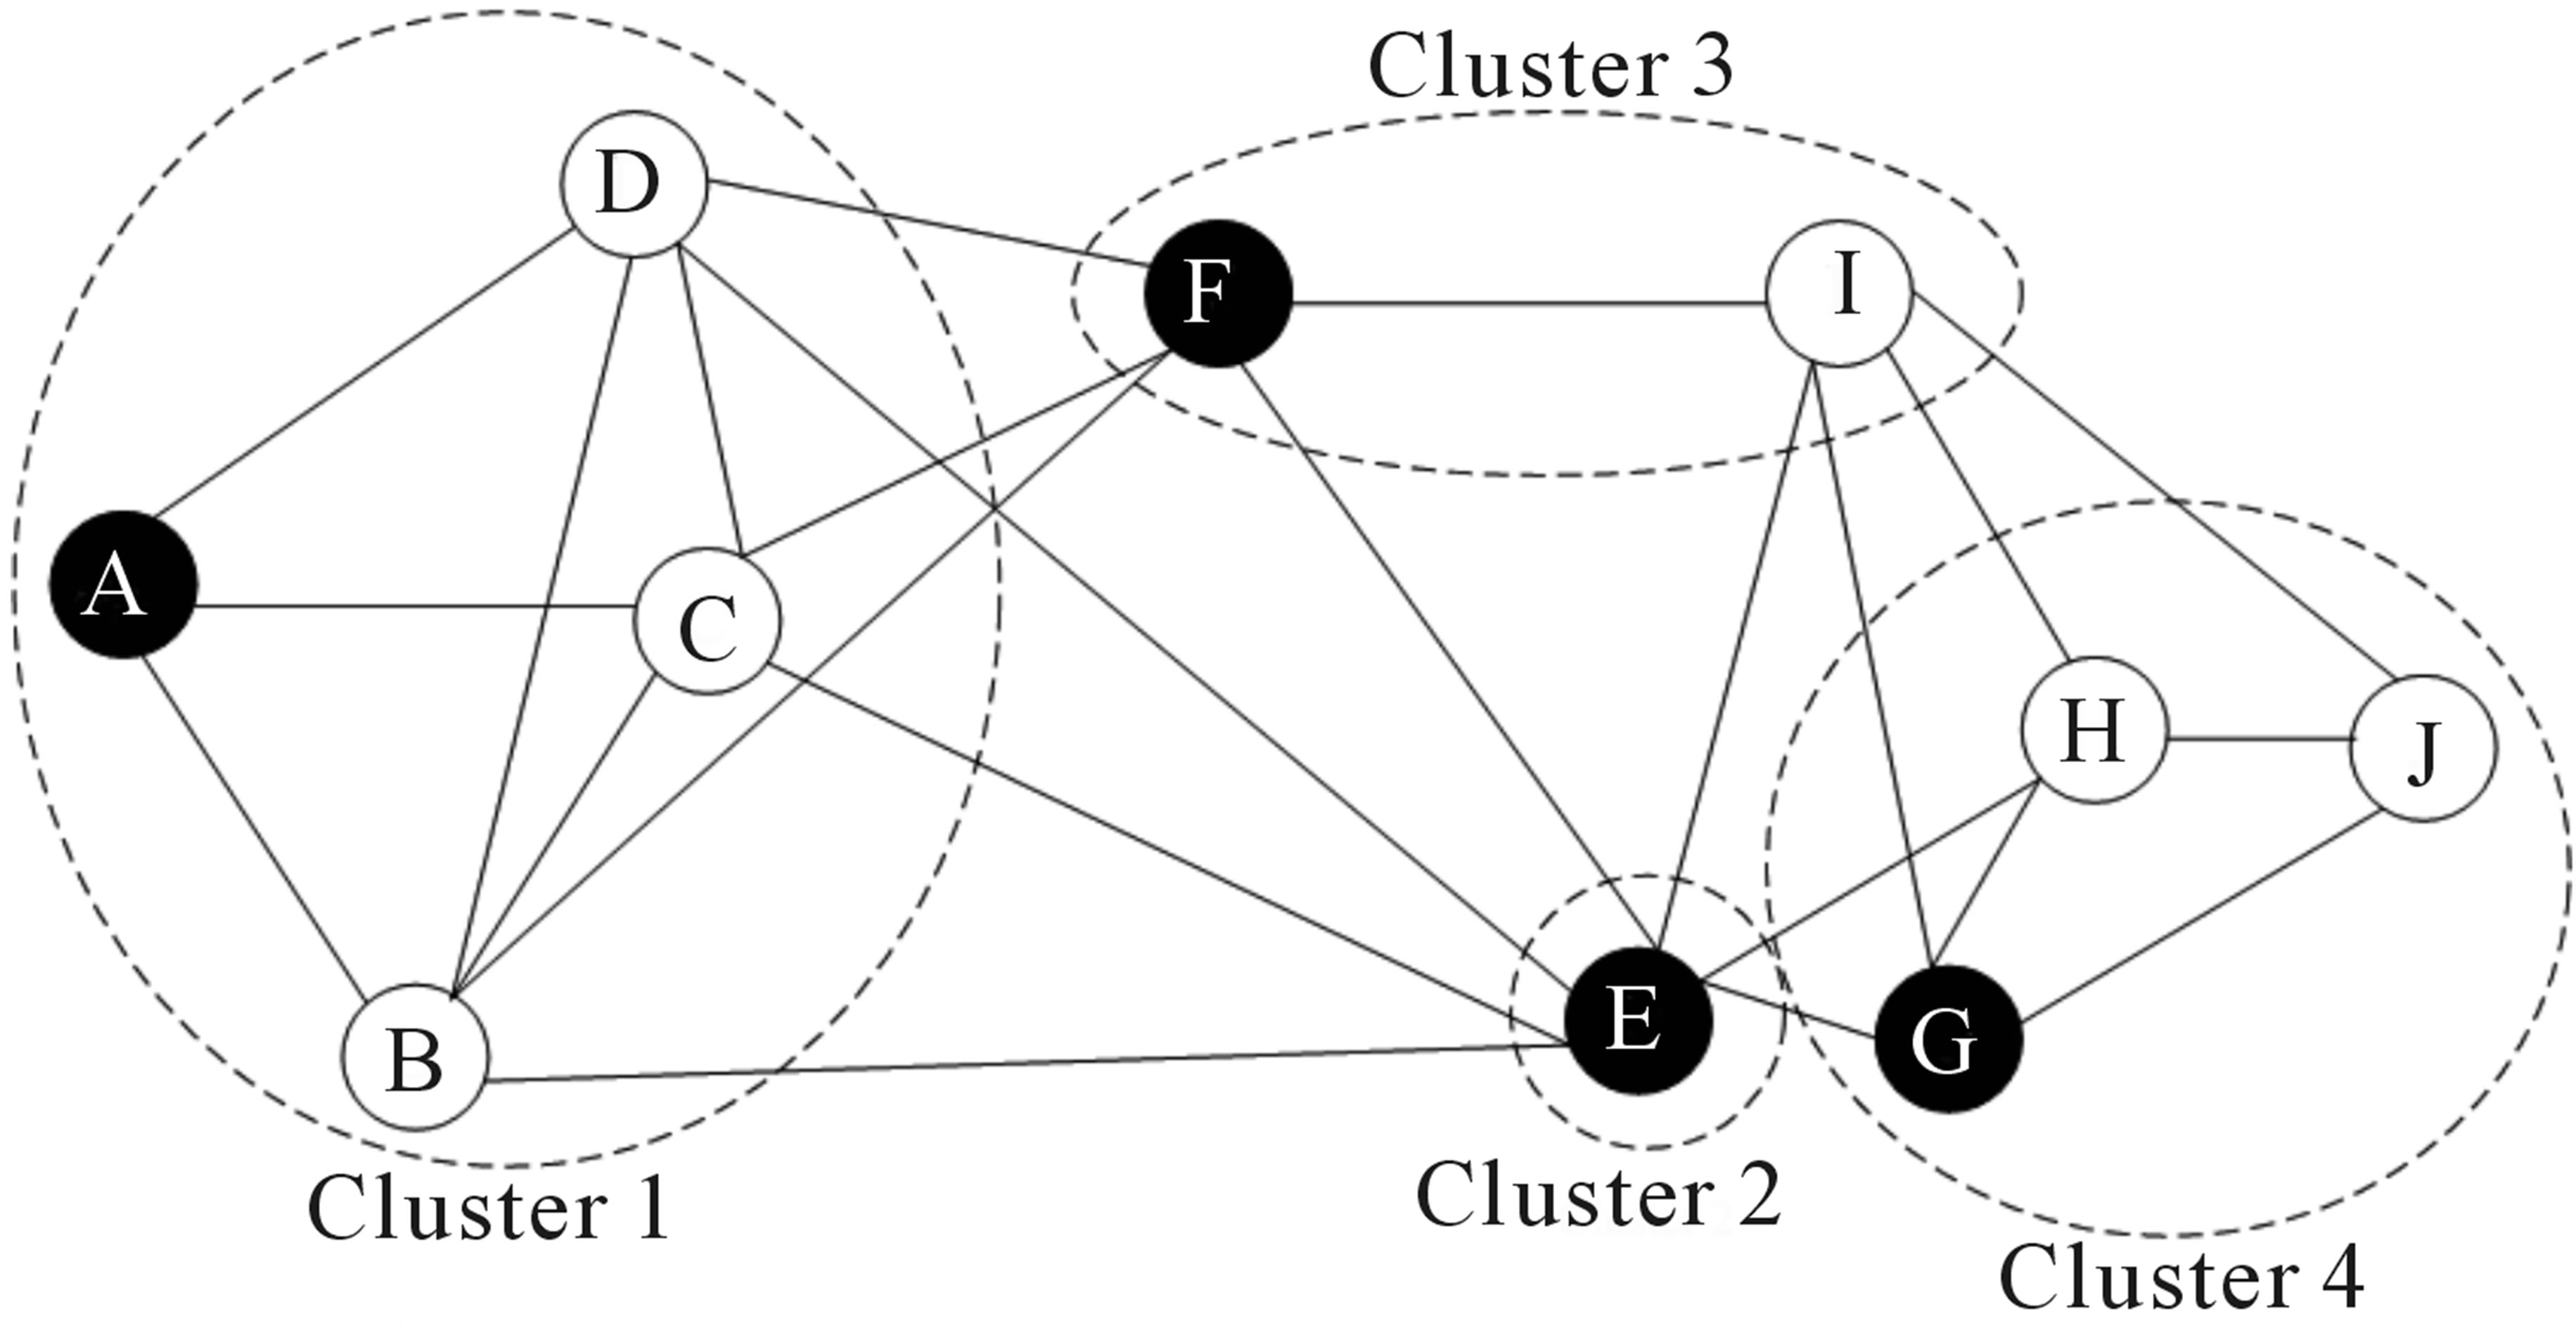
graph-based clustering。
1.1 hierarchical clustering
1.2 k-means clustering

1.3 graph-based clustering
2聚类工具
2.1 SINCERA
-
基于 hierarchical clustering; -
在聚类前需要进行 z-scores转换。
2.2 SC3
-
基于 PCA降维; -
k-means; -
共识聚类( consensus clustering)。🌟

2.3 tSNE + k-means
-
tSNE maps; -
k-means。
2.4 Seurat clustering
Seurat clustering主要是基于community的识别进行聚类,这里我们不做具体介绍了,后面会做Seurat包的详细教程。🤩
2.5 Comparing clustering
当我们需要比较两个聚类结果的时候,我们可以使用adjusted Rand index,区间在0~1,大家可以简单理解为,1表示聚类相同,0表示偶然相似,即adjusted Rand index越大,聚类结果越相似。🤗
3用到的包
rm(list = ls())
library(pcaMethods)
library(SC3)
library(scater)
library(SingleCellExperiment)
library(pheatmap)
library(mclust)
library(ggsci)
4示例数据
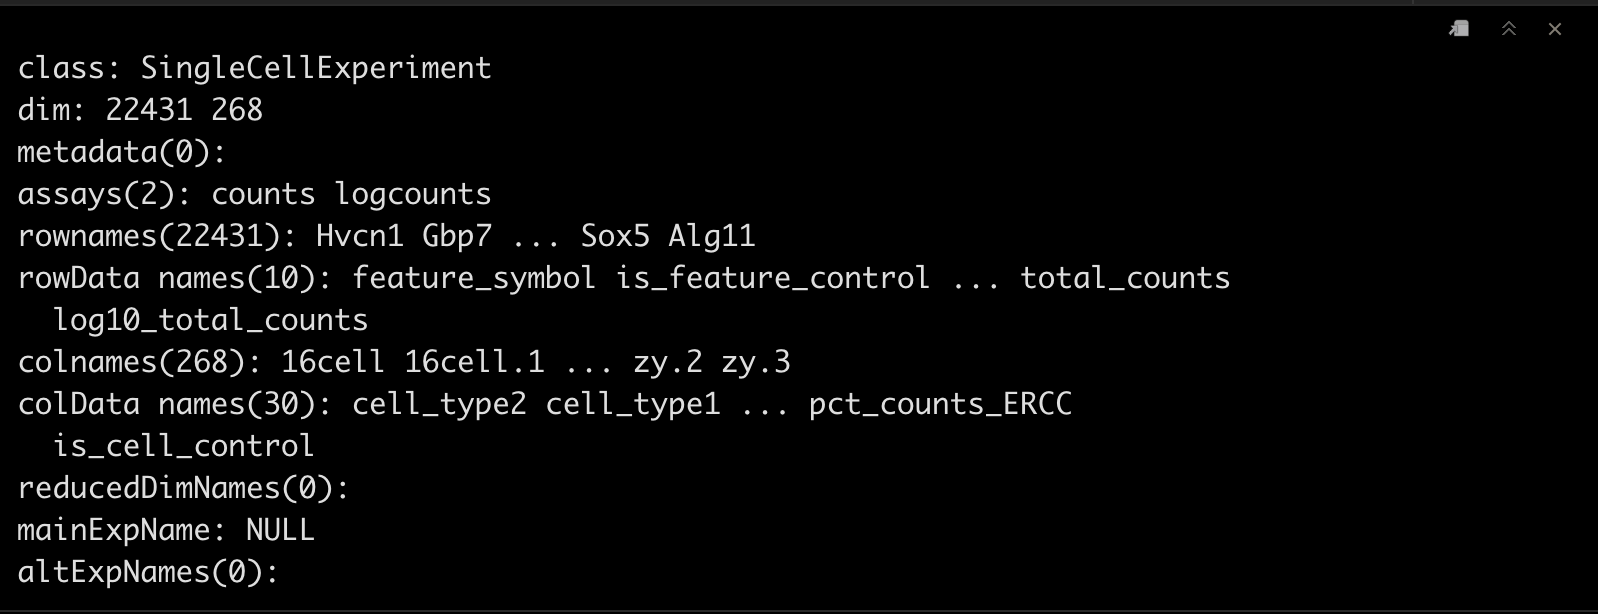
这里我为大家准备了一个小鼠的胚胎scRNAseq数据,文件格式为.rds。
dat <- readRDS("./deng-reads.rds")
dat
5数据初探
我们先看下细胞类型。
table(colData(dat)$cell_type2)

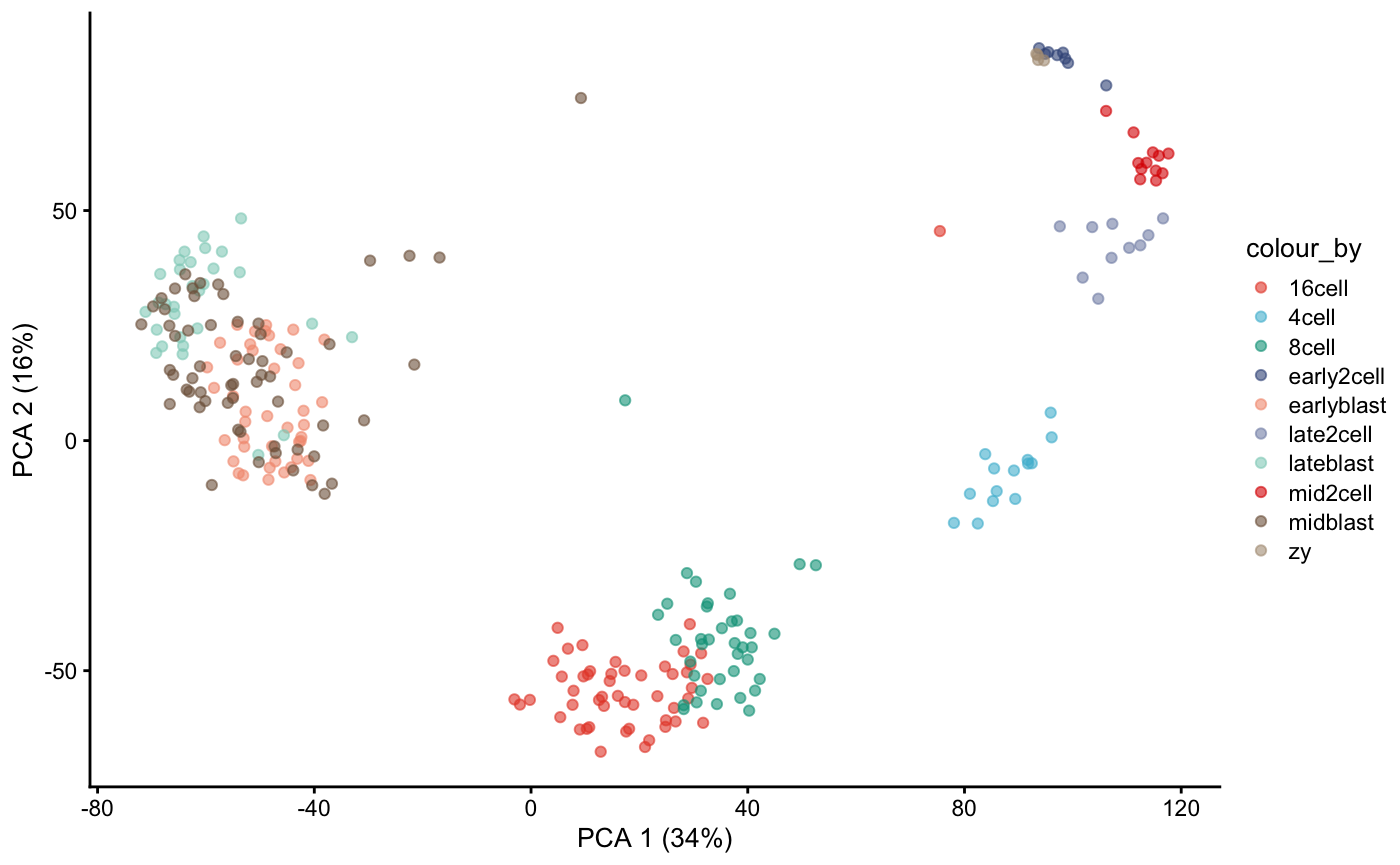
PCA 🥳 这里看到有的细胞类型是分的很开的,有明显的区分。
dat <- runPCA(dat)
plotPCA(dat, colour_by = "cell_type2")+
  scale_fill_npg()+
  scale_color_npg()
6SC3
这里我们只介绍一下SC3的方法进行聚类,其他方法耗时过长。
SC3的输入数据直接是SingleCellExperiment,非常方便。😁
6.1 sc3_estimate_k
dat <- sc3_estimate_k(dat)
6.2 查看聚类结果
我们看一下sc3提供的聚类方法,帮我们聚成了几类~
metadata(dat)$sc3$k_estimation

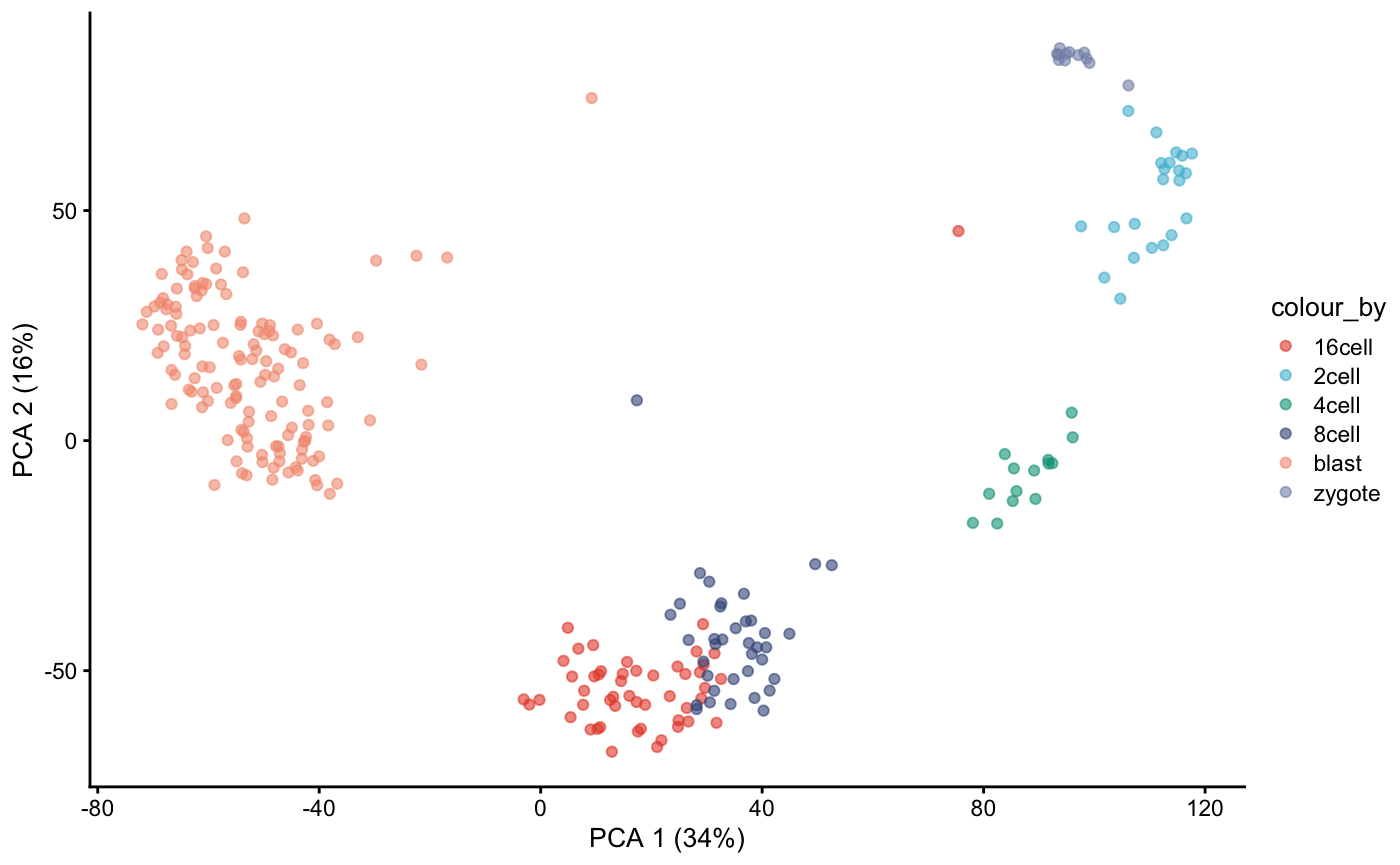
Note! 这里只帮我们聚了6类,但我们实际上不只6类啊。🫠
但是, 如果我们不考虑early, mid, late这种时间点的话,正好的6类。Nice !~🥳
6.3 可视化一下
plotPCA(dat, colour_by = "cell_type1")+
  scale_fill_npg()+
  scale_color_npg()
6.4 生物学分组聚类
这里我们将生物学分组纳入考虑中,进行聚类。
dat <- sc3(dat,
           ks = 10, # a range/single of the number of clusters k used for clustering
           biology = TRUE,
           n_cores = 4 # 默认是1
           )
6.5 通过Shiny结果可视化
SC包提供了一种交互的方式进行结果展示,就和网页工具一样简单。
sc3_interactive(dat)
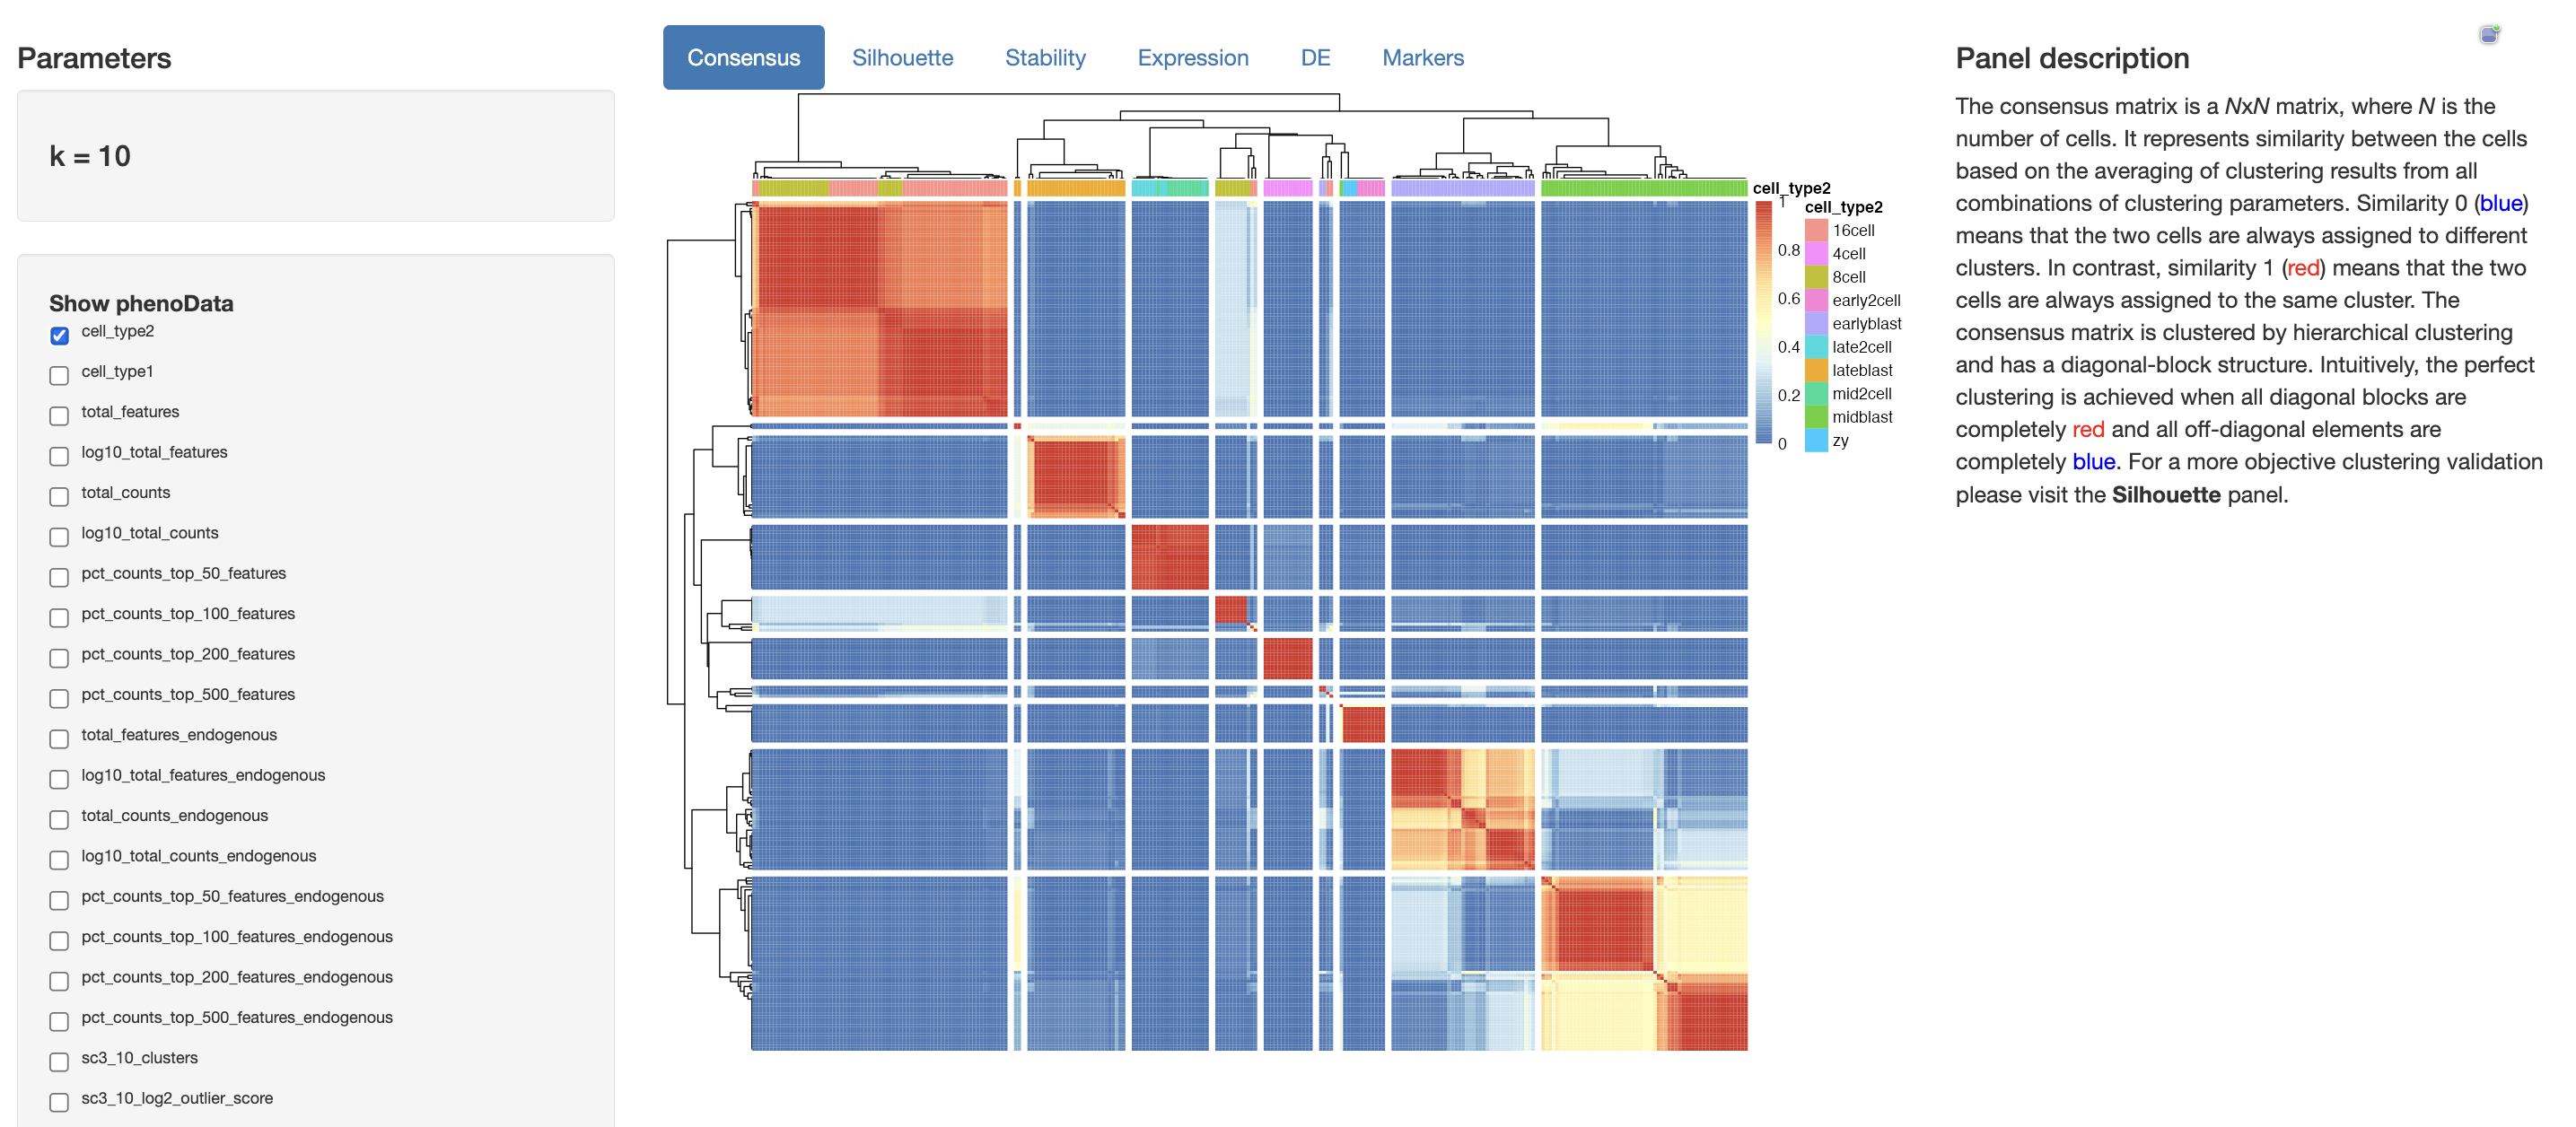
🤨 这里我们只讲一下如何使用代码实现结果可视化。
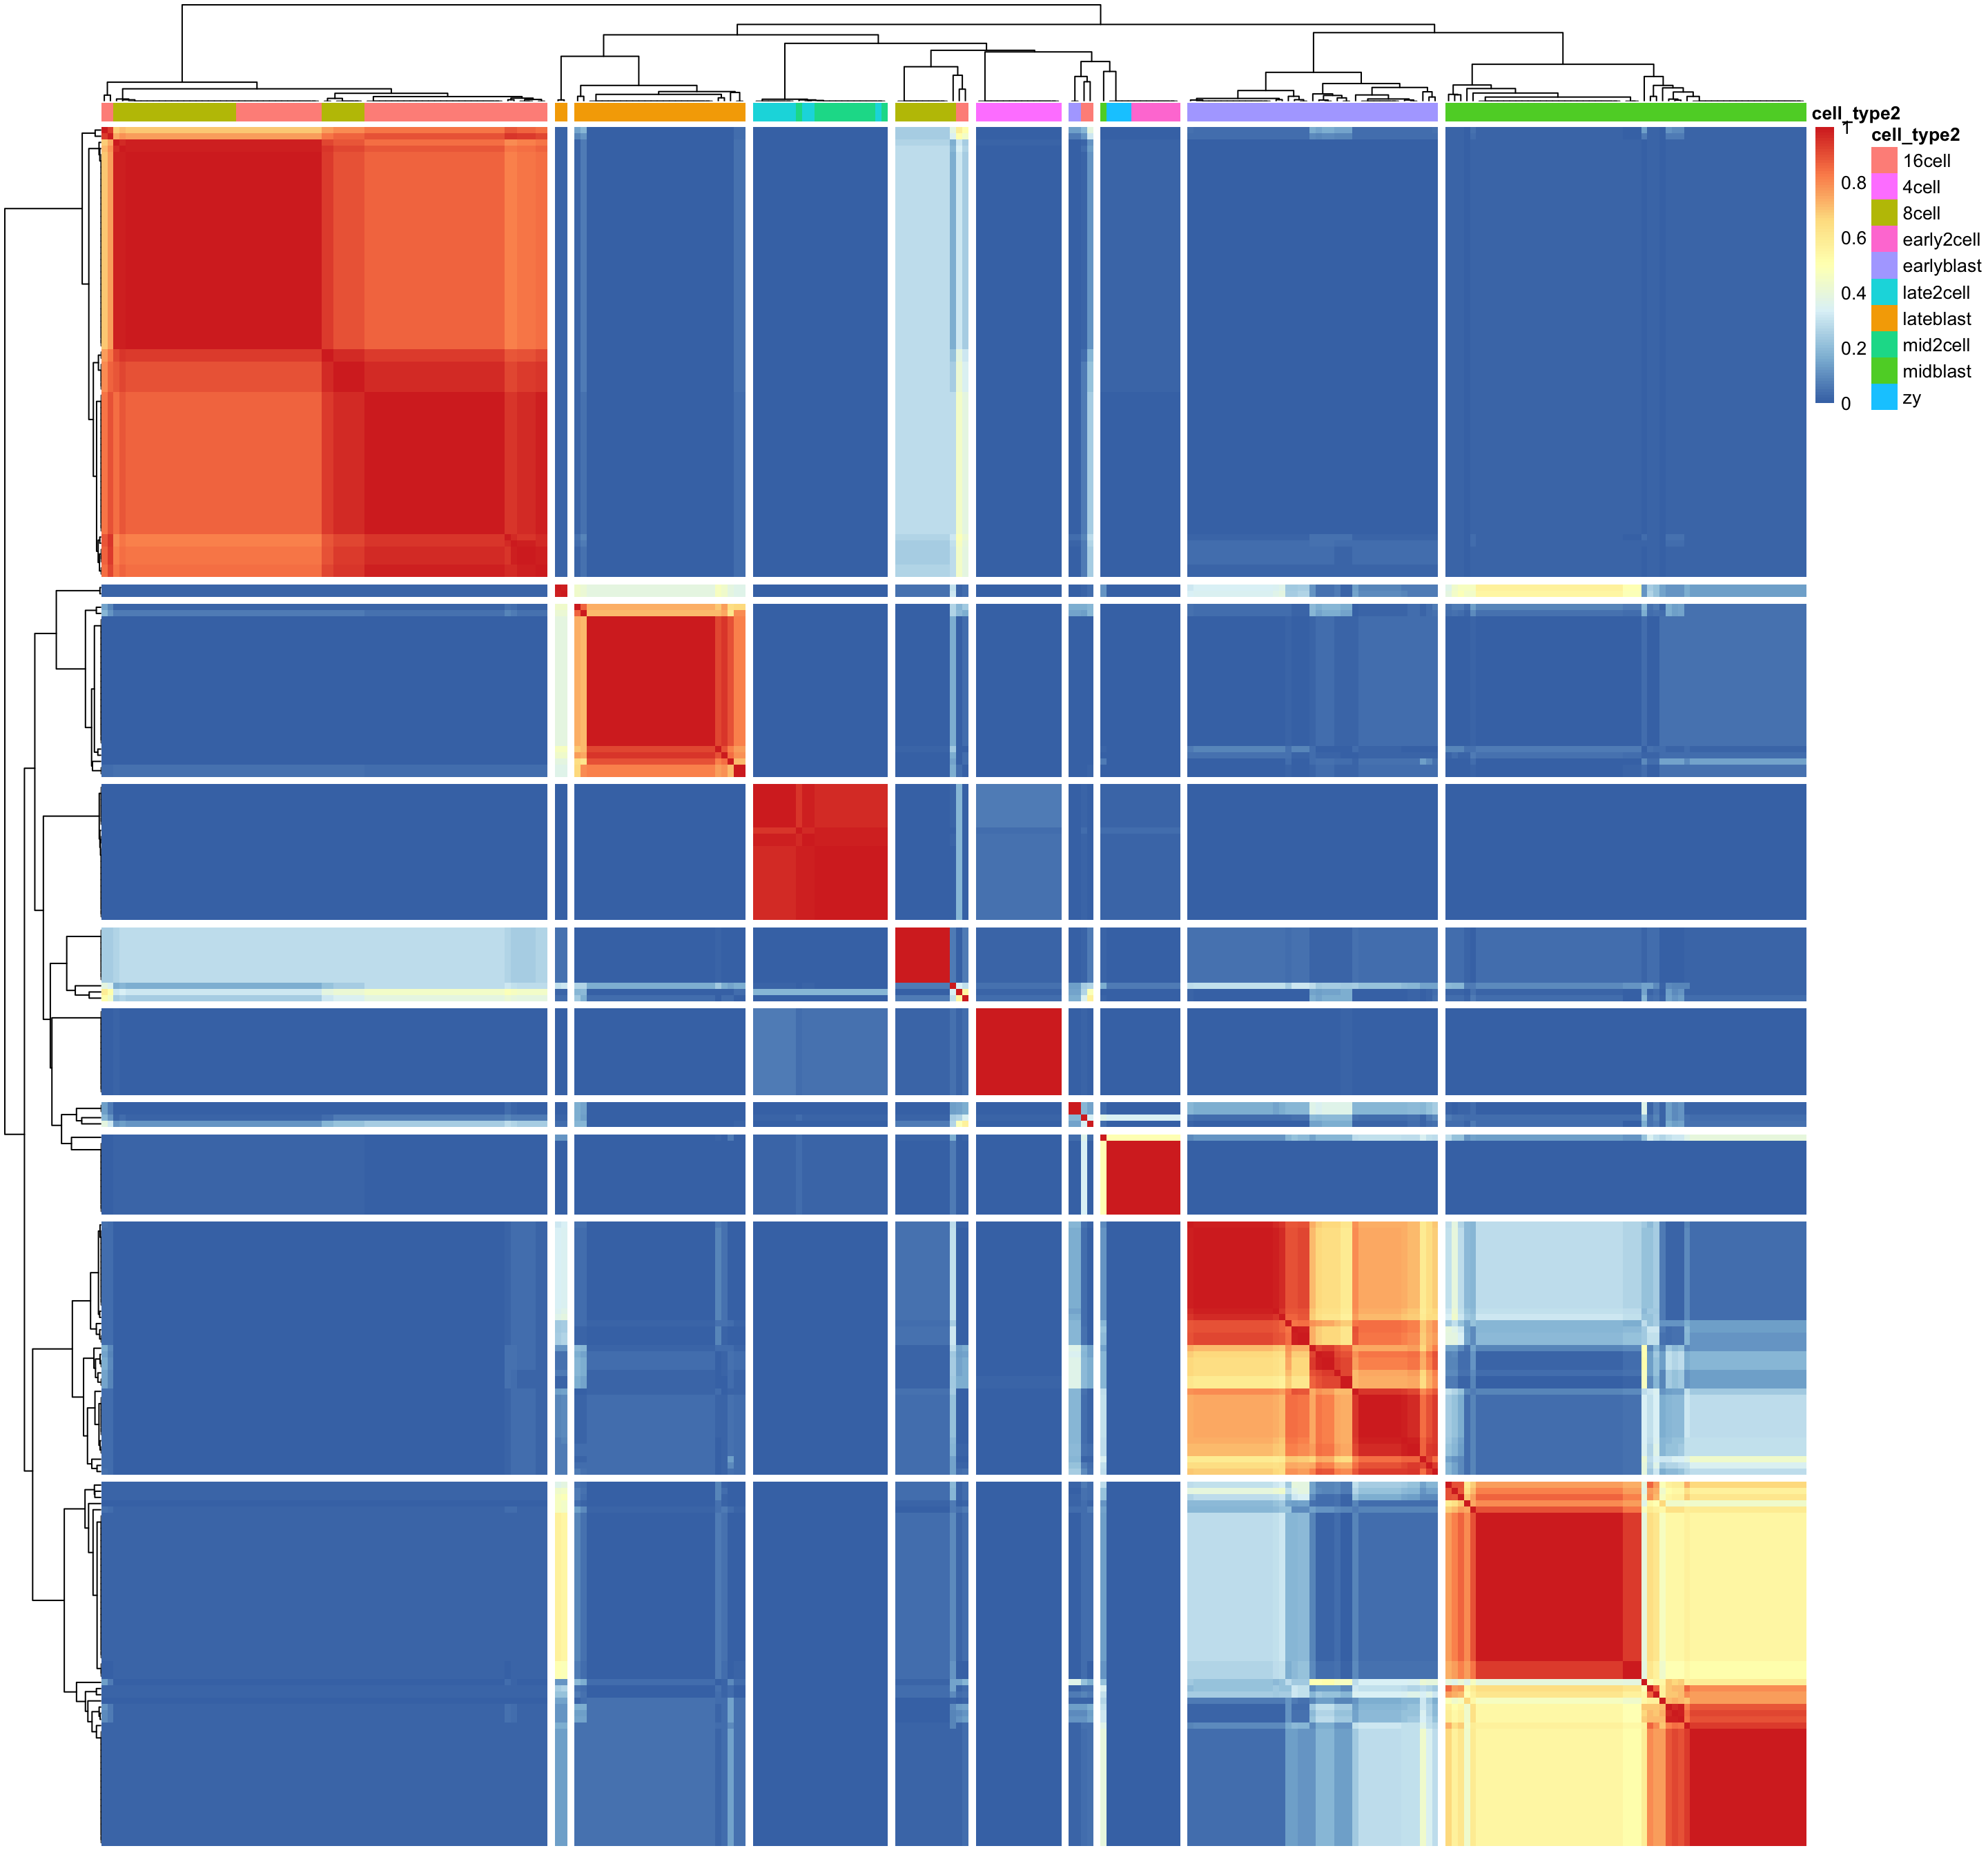
6.6 Consensus Matrix
sc3_plot_consensus(
    dat,
    k = 10,
    show_pdata = c(
        "cell_type2")
)
6.7 Silhouette Plot
sc3_plot_silhouette(dat, k = 10)
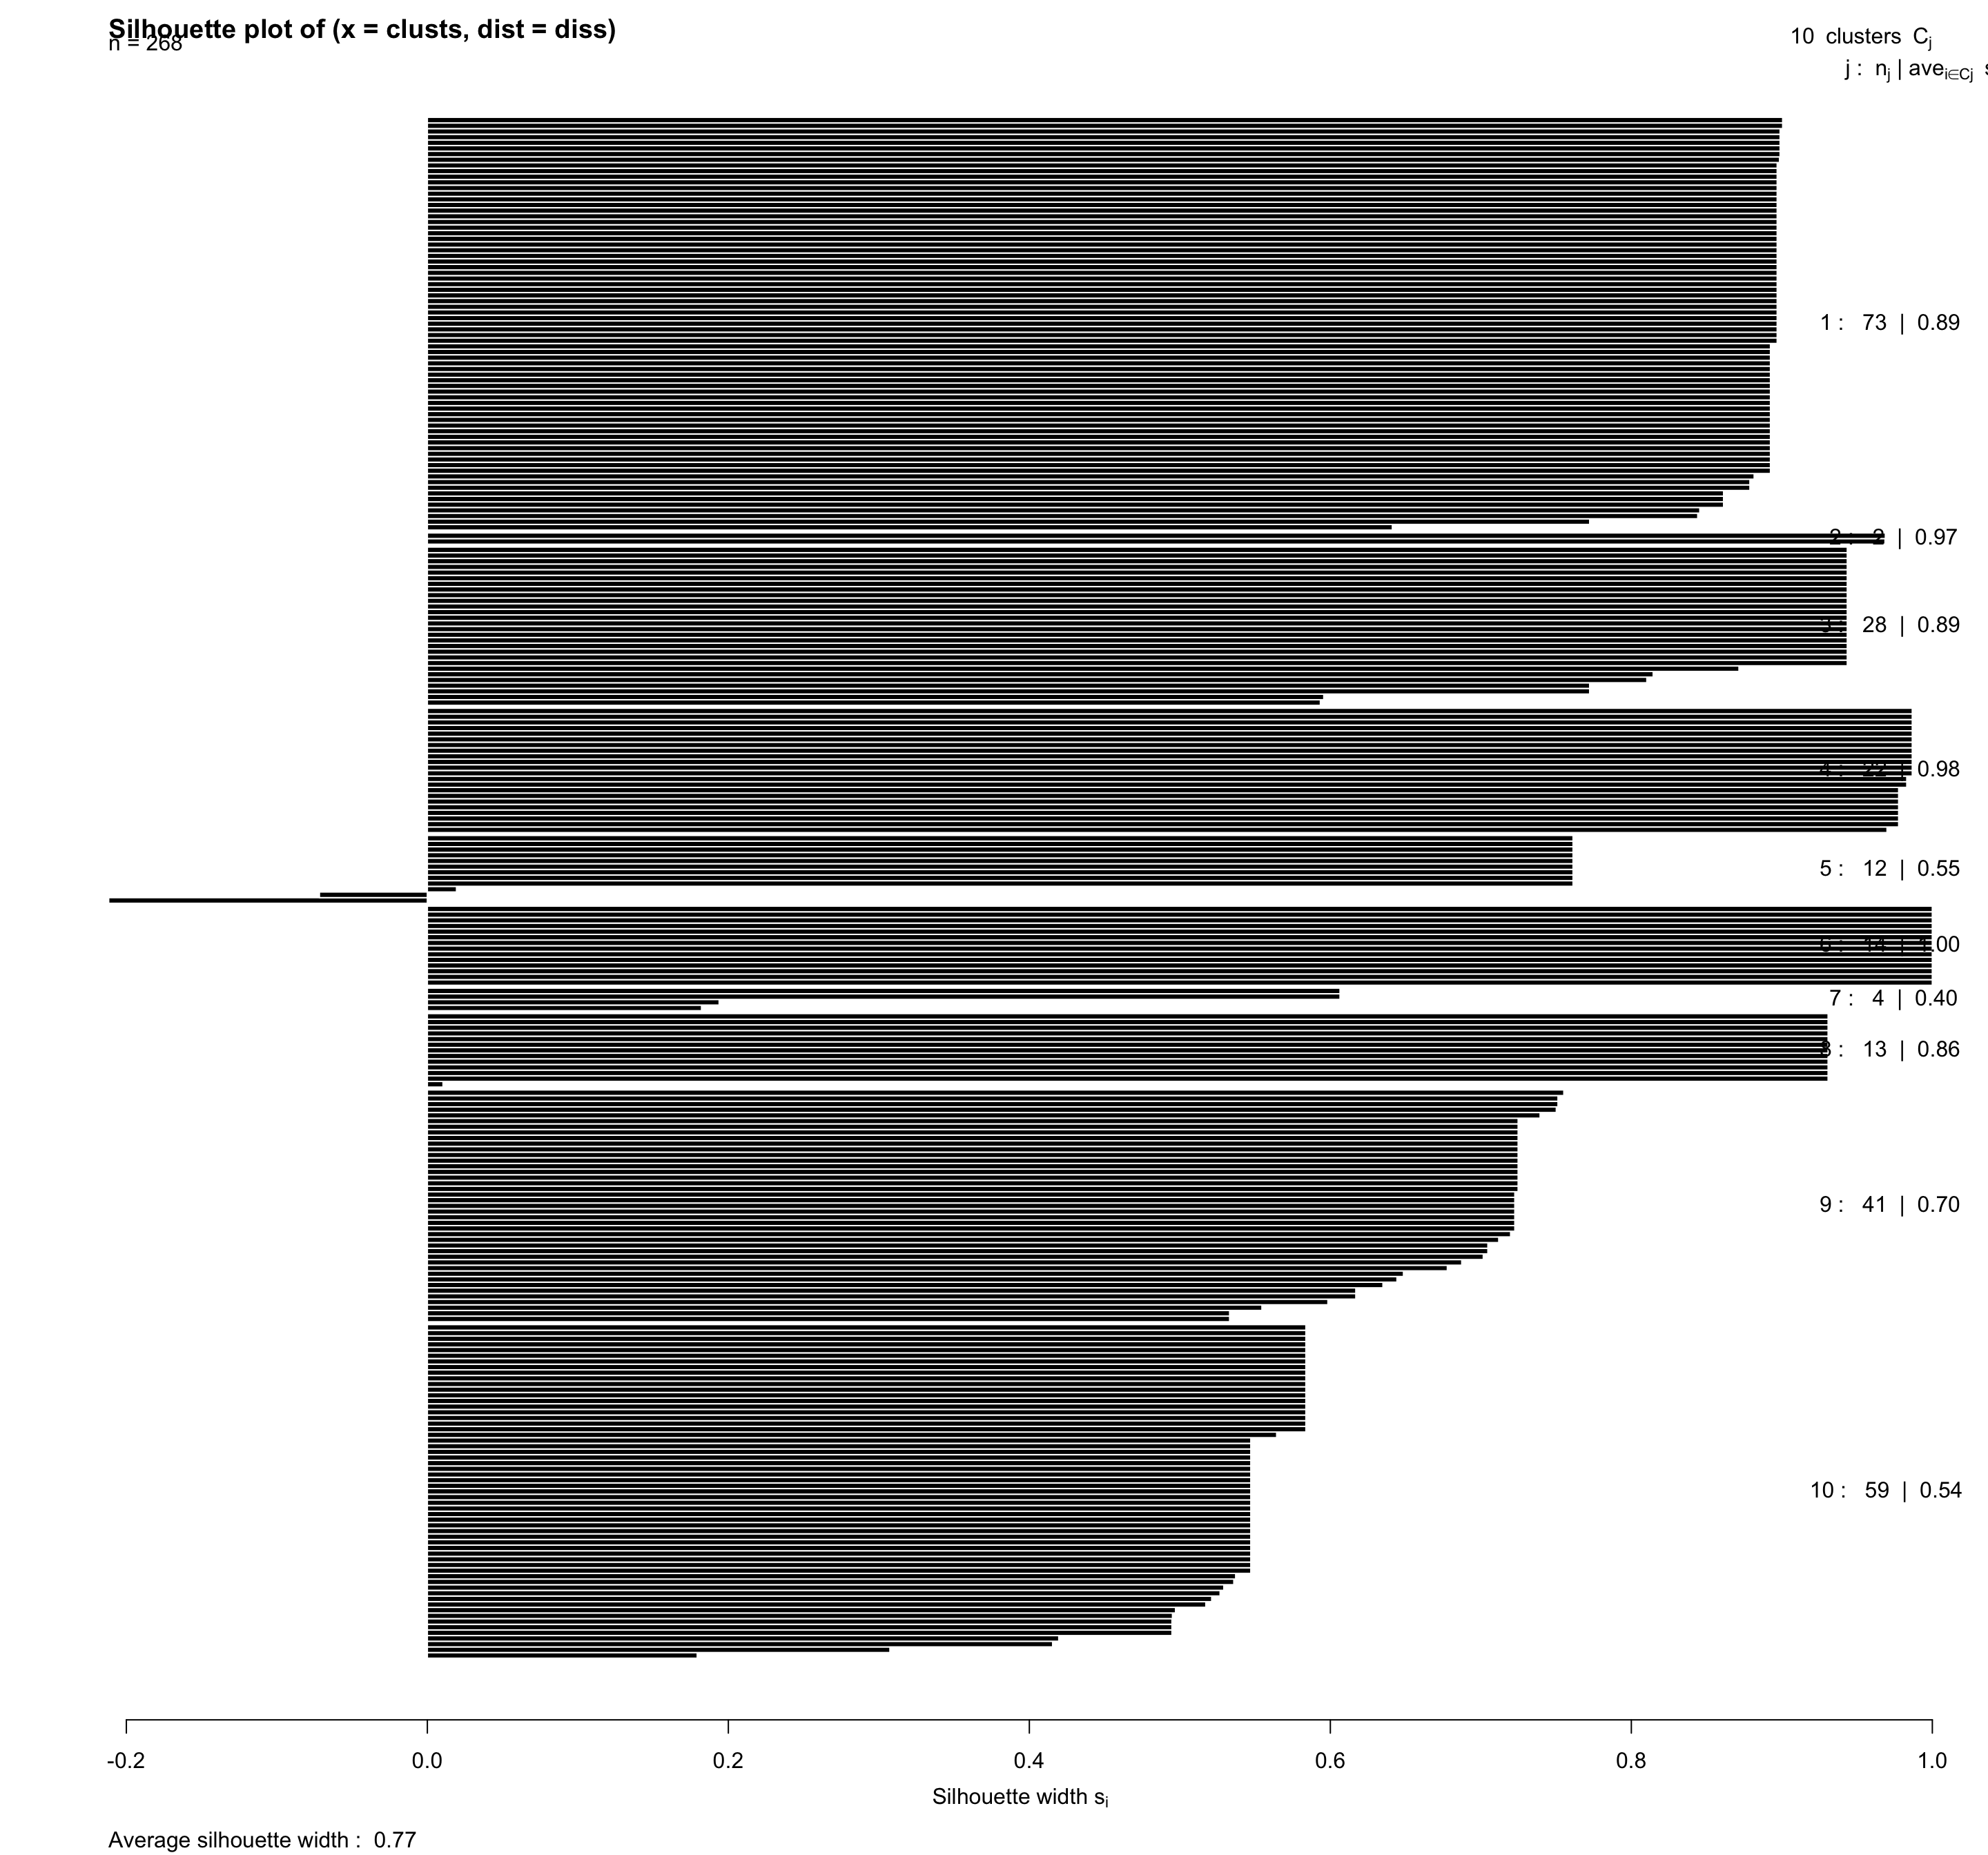
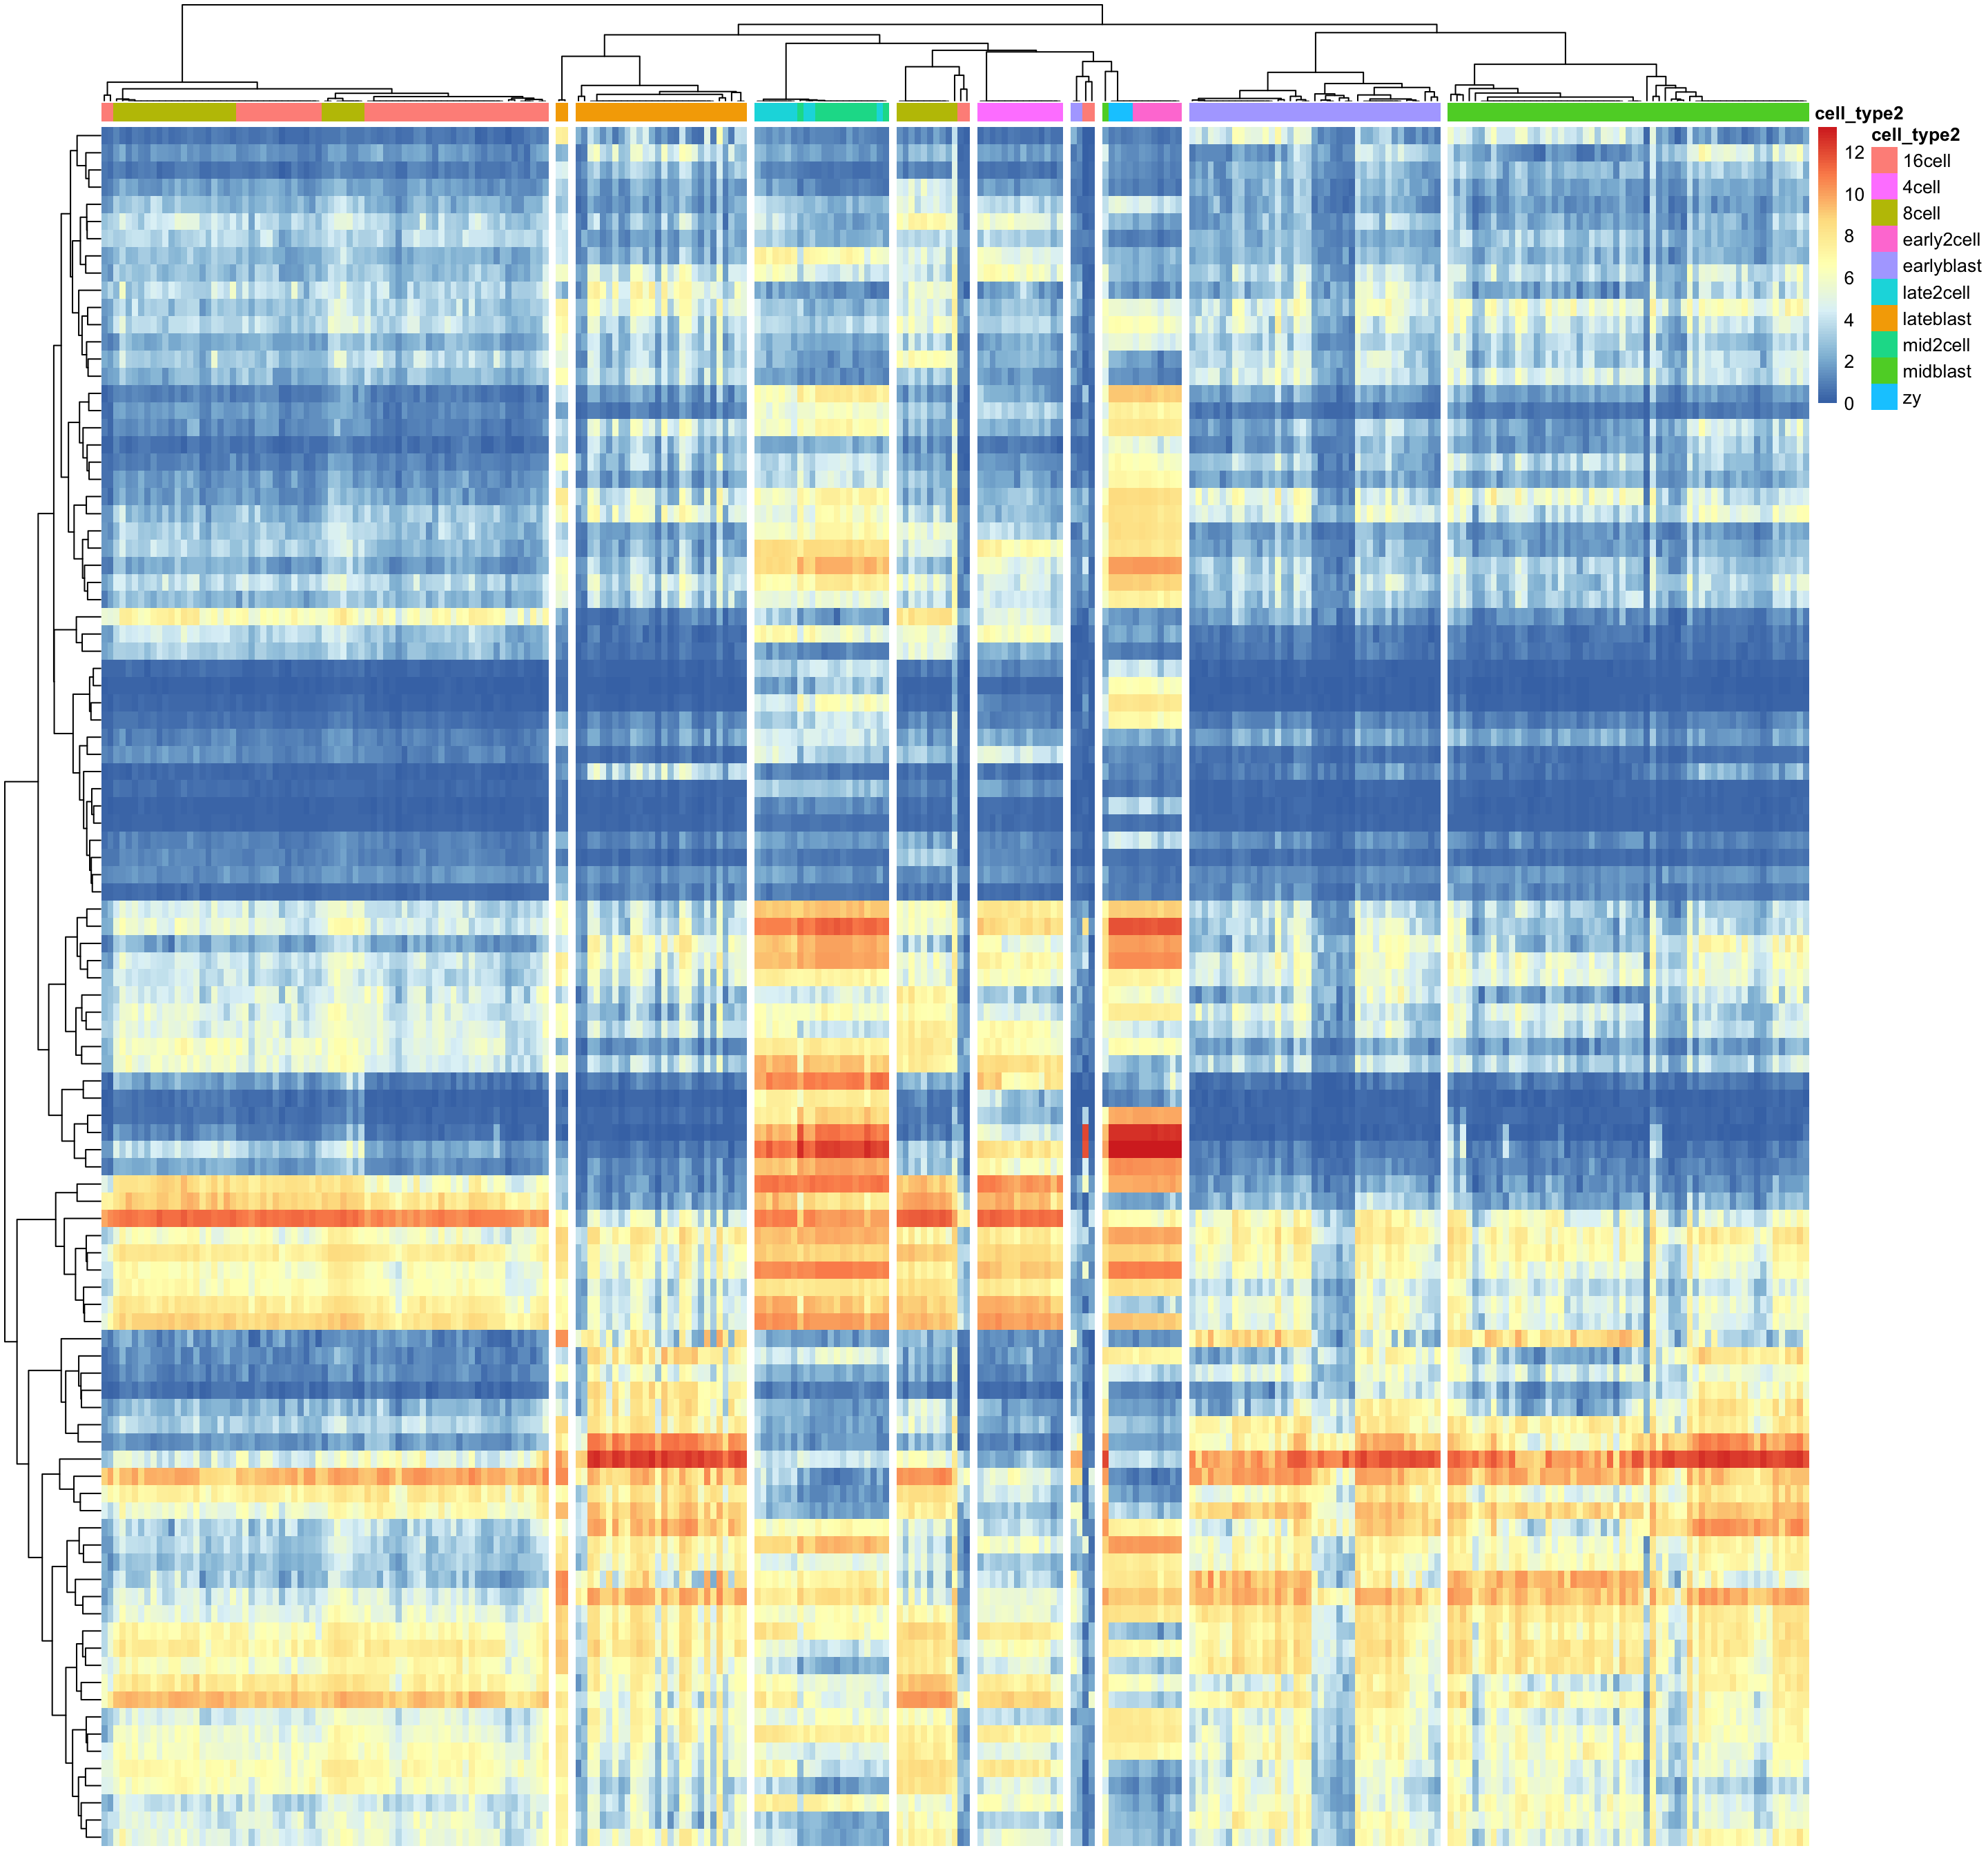
6.8 Expression Matrix
sc3_plot_expression(
    dat, k = 10,
    show_pdata = c(
        "cell_type2")
)
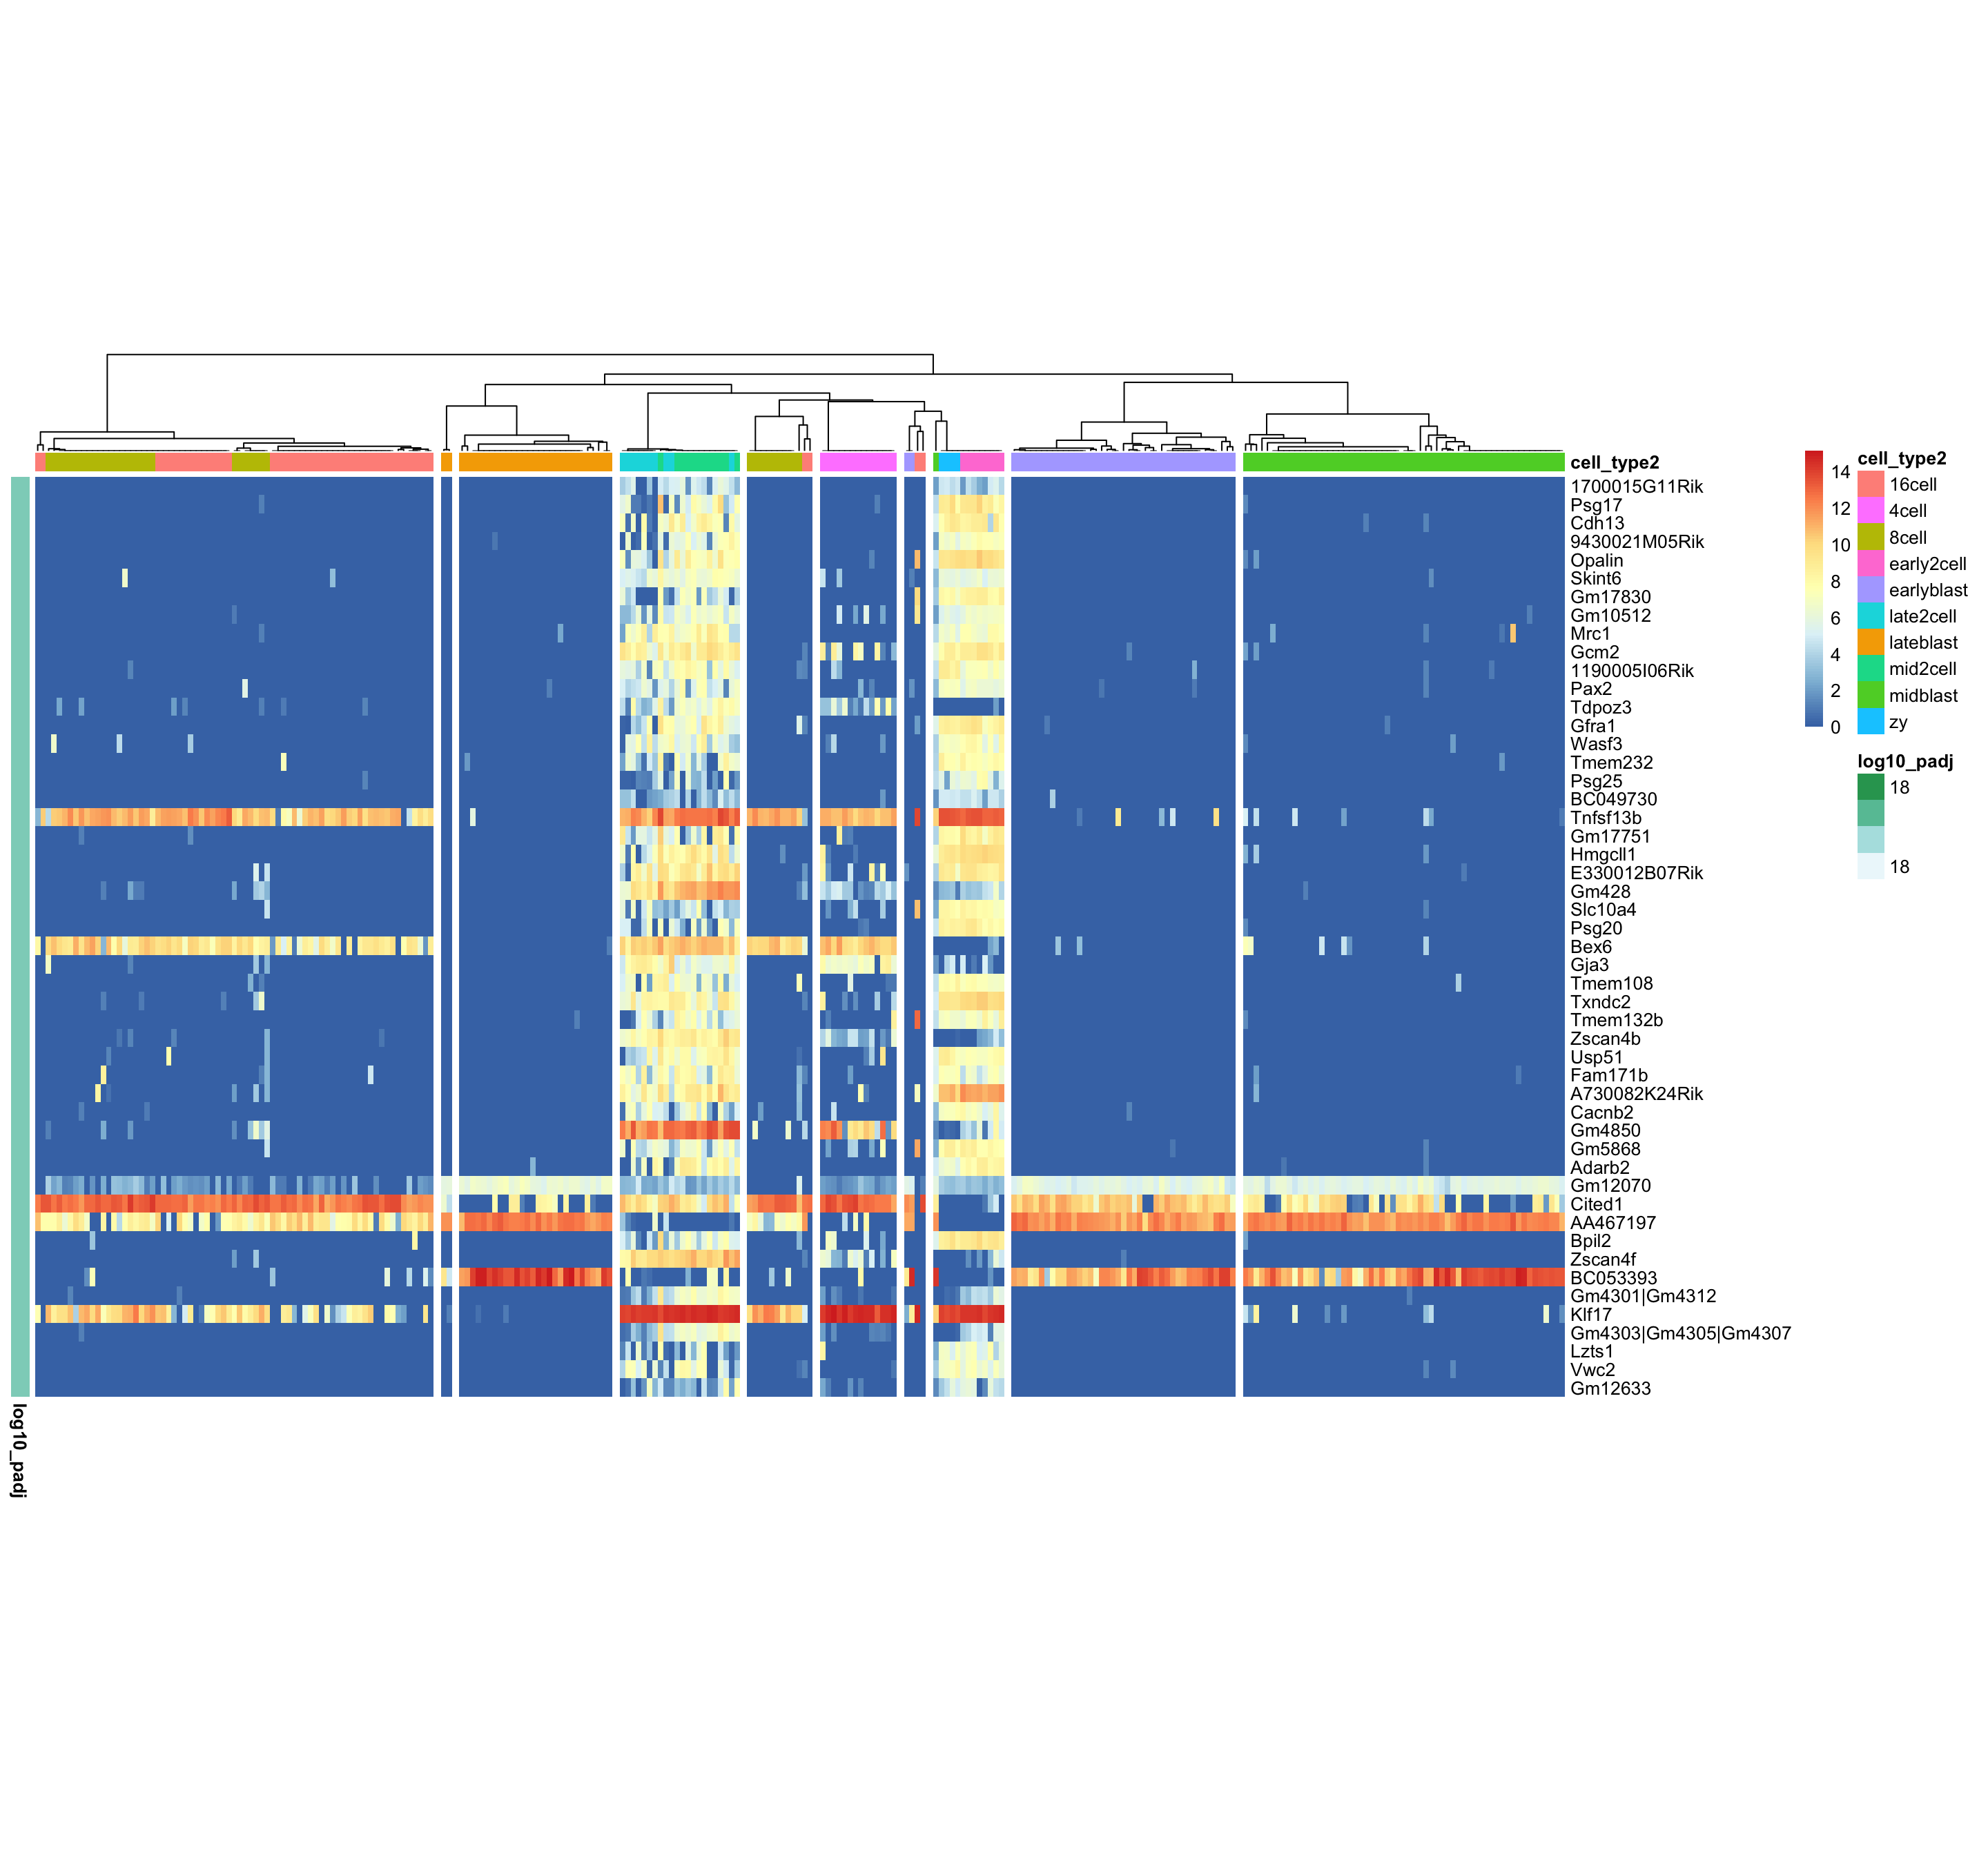
6.9 DE genes
sc3_plot_de_genes(
    dat, k = 10,
    show_pdata = c(
        "cell_type2")
)
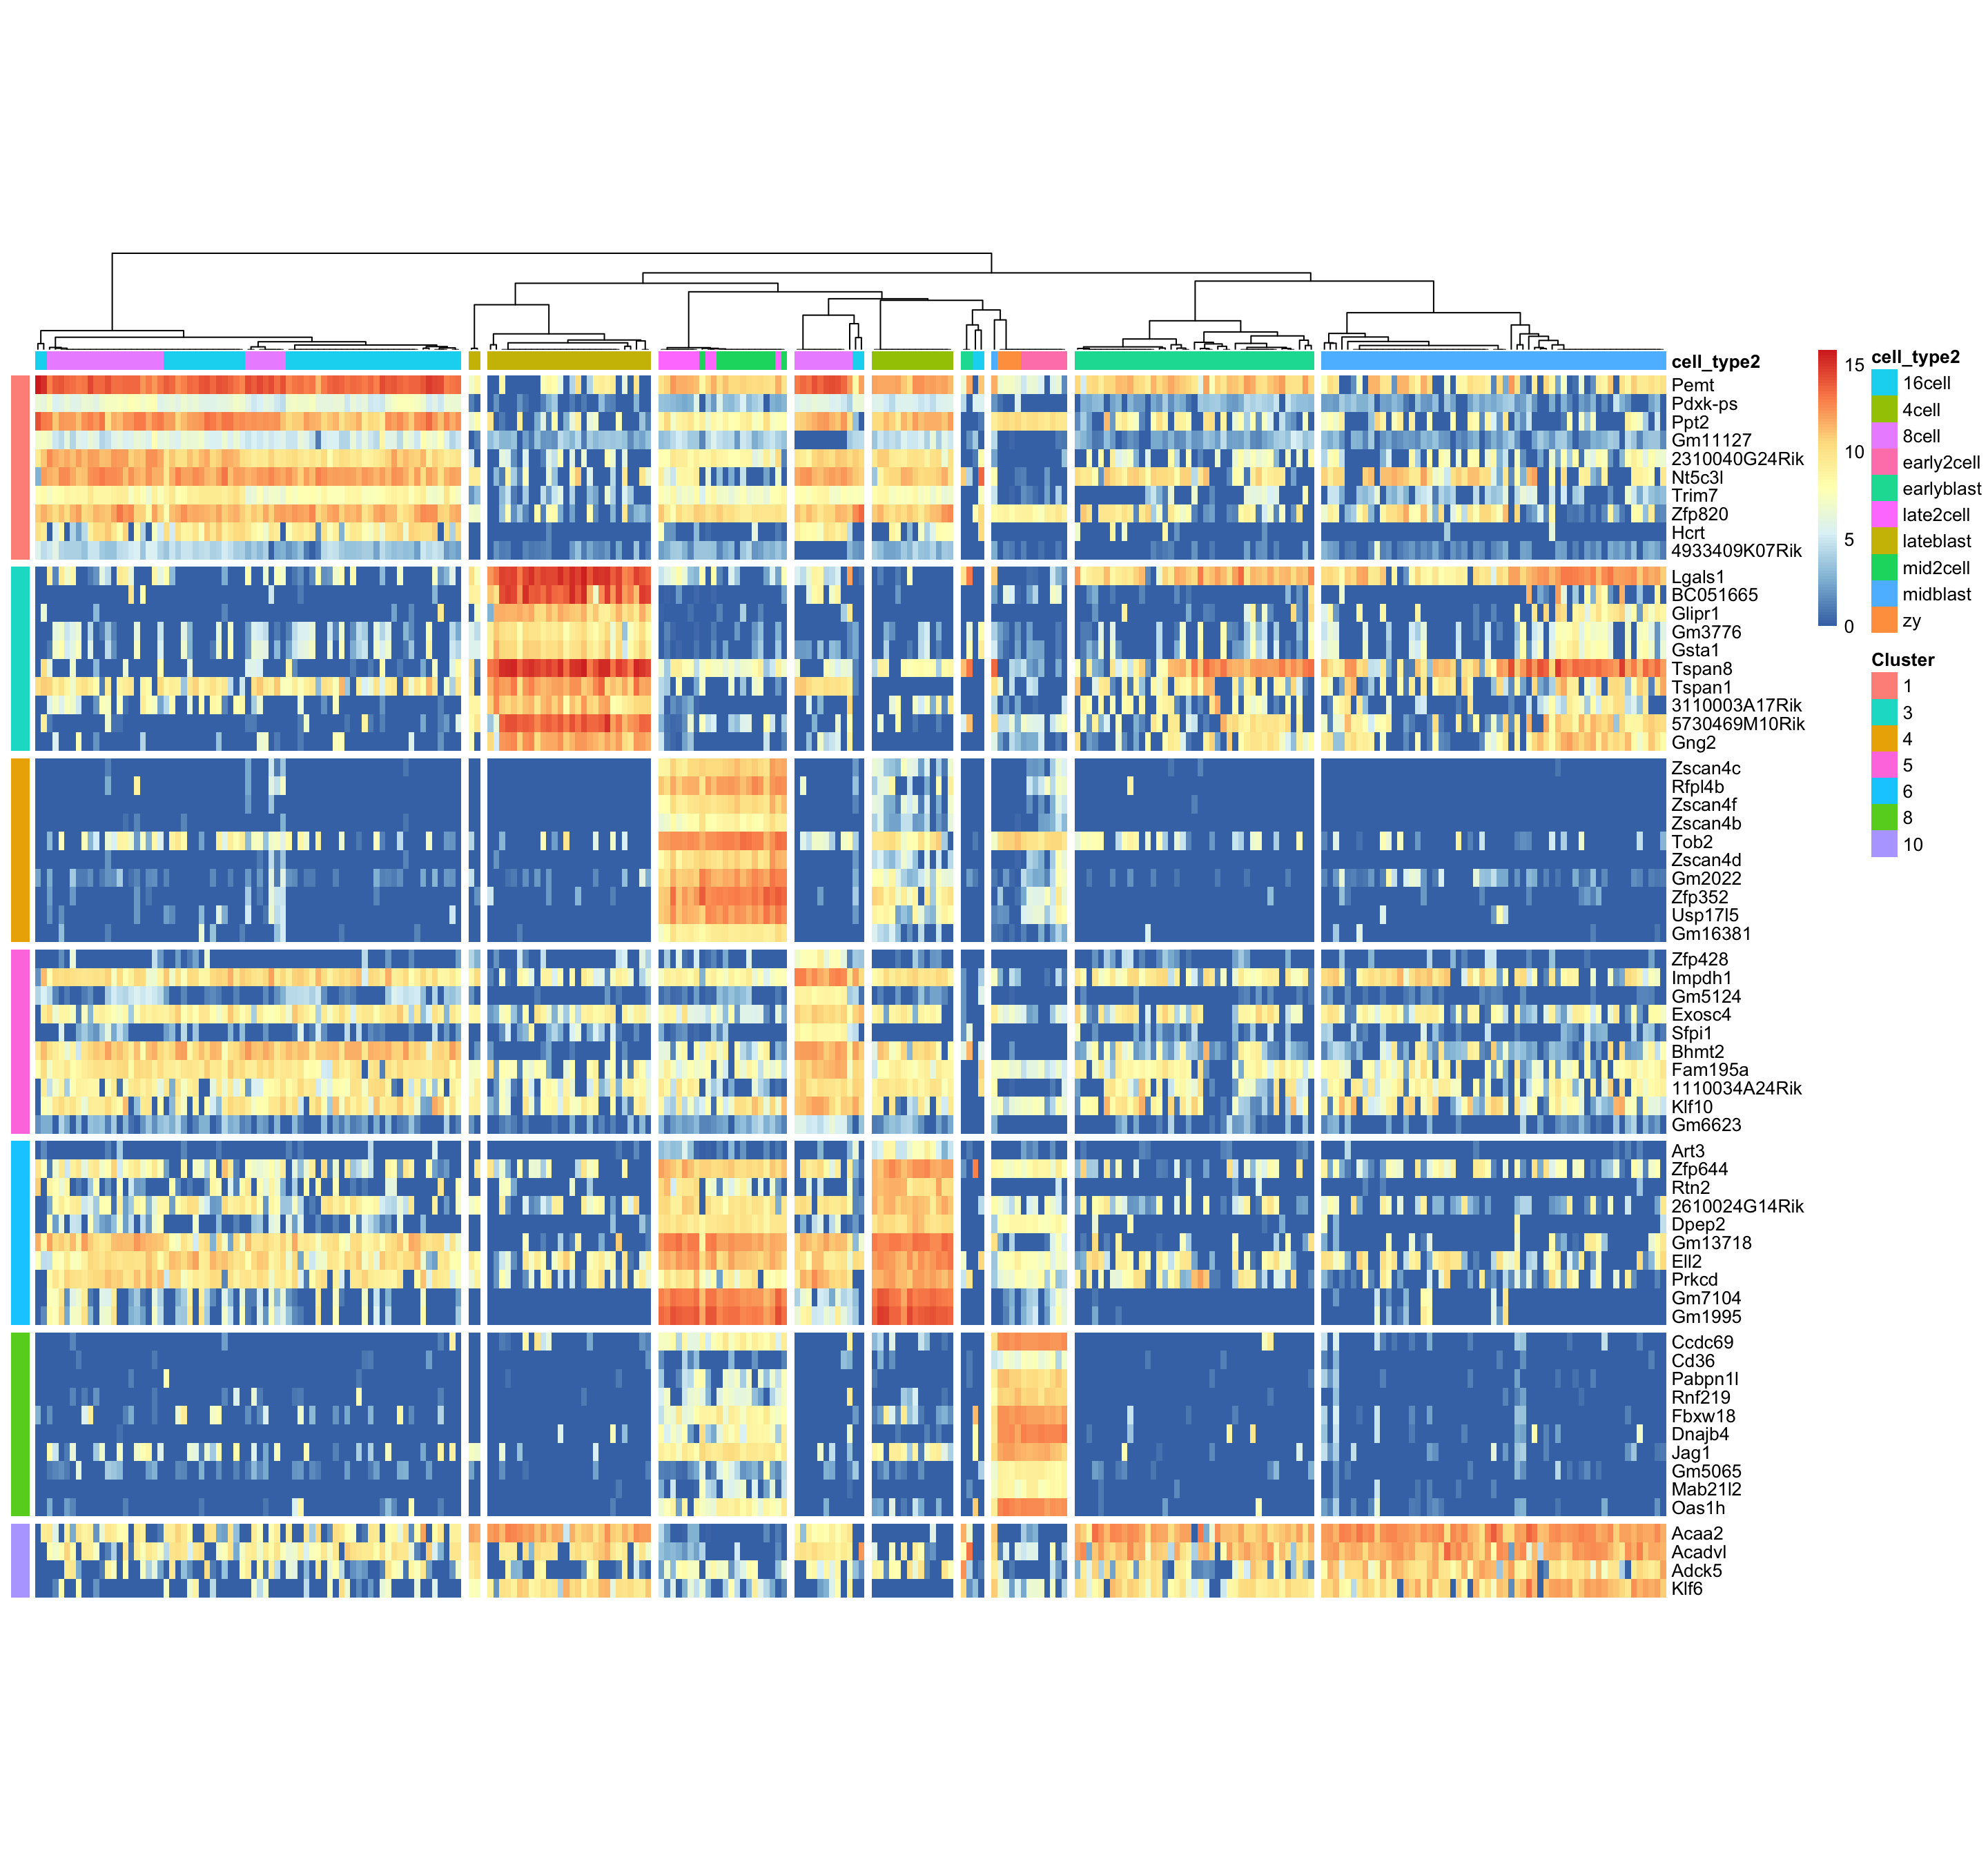
6.10 Marker Genes
sc3_plot_markers(
    dat, k = 10,
    show_pdata = c(
        "cell_type2")
)

需要示例数据的小伙伴,在公众号回复
scRNAseq2获取吧!点个在看吧各位~ ✐.ɴɪᴄᴇ ᴅᴀʏ 〰
本文由 mdnice 多平台发布


 1976
1976

 被折叠的 条评论
为什么被折叠?


