


✅作者简介:热爱科研的Matlab仿真开发者,修心和技术同步精进,matlab项目合作可私信。
🍎个人主页:Matlab科研工作室
🍊个人信条:格物致知。
更多Matlab仿真内容点击👇
⛄ 内容介绍
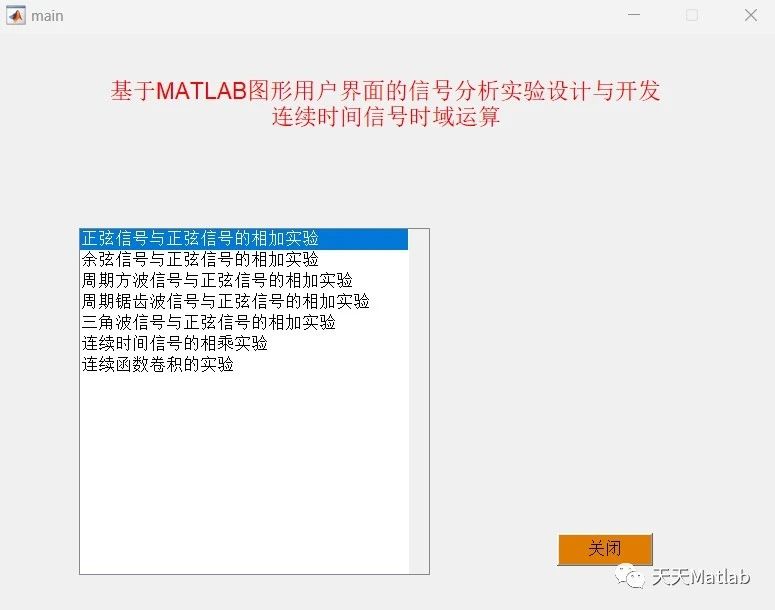
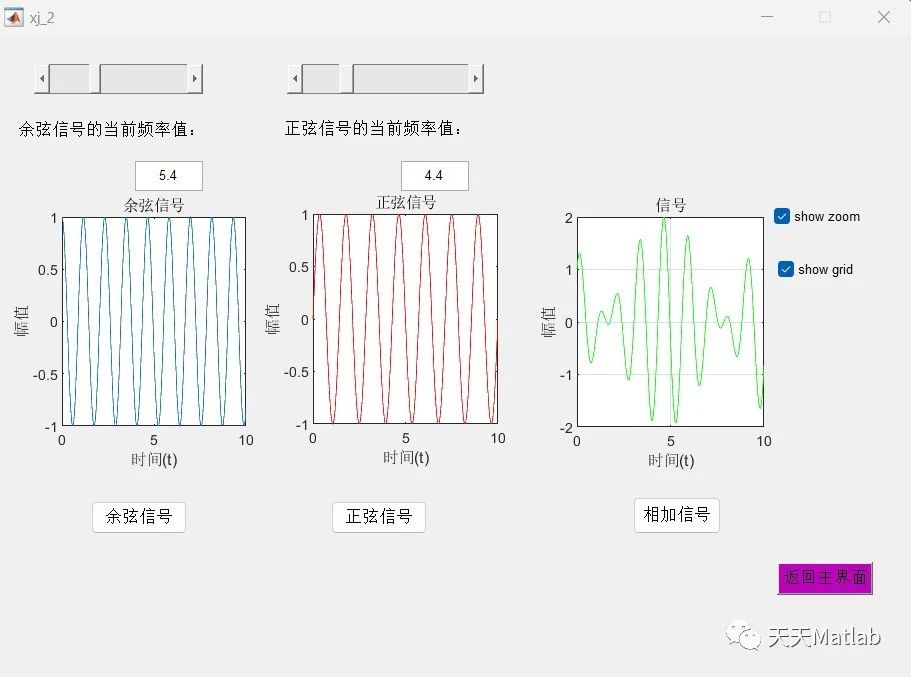
本文主要介绍基于MATLAB GUI的信号分析仪的设计,使用MATLAB图形用户界面中的各种控件来实现对参数的设定并最终显示信号波形曲线图.此分析仪能够输出的曲线图有时域曲线,复域曲线,频域曲线以及时域曲线与频域曲线的对比,使得能够准确的观察时域曲线与频域曲线的同步变化情况.
⛄ 部分代码
function varargout = juli(varargin)
% JULI M-file for juli.fig
% JULI, by itself, creates a new JULI or raises the existing
% singleton*.
%
% H = JULI returns the handle to a new JULI or the handle to
% the existing singleton*.
%
% JULI('CALLBACK',hObject,eventData,handles,...) calls the local
% function named CALLBACK in JULI.M with the given input arguments.
%
% JULI('Property','Value',...) creates a new JULI or raises the
% existing singleton*. Starting from the left, property value pairs are
% applied to the GUI before juli_OpeningFcn gets called. An
% unrecognized property name or invalid value makes property application
% stop. All inputs are passed to juli_OpeningFcn via varargin.
%
% *See GUI Options on GUIDE's Tools menu. Choose "GUI allows only one
% instance to run (singleton)".
%
% See also: GUIDE, GUIDATA, GUIHANDLES
% Edit the above text to modify the response to help juli
% Last Modified by GUIDE v2.5 28-May-2008 19:12:14
% Begin initialization code - DO NOT EDIT
gui_Singleton = 1;
gui_State = struct('gui_Name', mfilename, ...
'gui_Singleton', gui_Singleton, ...
'gui_OpeningFcn', @juli_OpeningFcn, ...
'gui_OutputFcn', @juli_OutputFcn, ...
'gui_LayoutFcn', [] , ...
'gui_Callback', []);
if nargin && ischar(varargin{1})
gui_State.gui_Callback = str2func(varargin{1});
end
if nargout
[varargout{1:nargout}] = gui_mainfcn(gui_State, varargin{:});
else
gui_mainfcn(gui_State, varargin{:});
end
% End initialization code - DO NOT EDIT
% --- Executes just before juli is made visible.
function juli_OpeningFcn(hObject, eventdata, handles, varargin)
% This function has no output args, see OutputFcn.
% hObject handle to figure
% eventdata reserved - to be defined in a future version of MATLAB
% handles structure with handles and user data (see GUIDATA)
% varargin command line arguments to juli (see VARARGIN)
% Choose default command line output for juli
handles.output = hObject;
% Update handles structure
guidata(hObject, handles);
% UIWAIT makes juli wait for user response (see UIRESUME)
% uiwait(handles.figure1);
% --- Outputs from this function are returned to the command line.
function varargout = juli_OutputFcn(hObject, eventdata, handles)
% varargout cell array for returning output args (see VARARGOUT);
% hObject handle to figure
% eventdata reserved - to be defined in a future version of MATLAB
% handles structure with handles and user data (see GUIDATA)
% Get default command line output from handles structure
varargout{1} = handles.output;
% --- Executes on selection change in listbox1.
function listbox1_Callback(hObject, eventdata, handles)
val=get(handles.listbox1 ,'Value');
switch val
case 1
t=-1:0.01:10;
y1=sin(2*pi*t);
axes(handles.axes1);
plot(t,y);
case 2
t=-1:0.01:10;
y1=cos(2*pi*t);
axes(handles.axes1);
plot(t,y);
case 3
t=-1:0.01:10;
y1=square(2*pi*t);
axes(handles.axes1);
plot(t,y);
case 4
t=-1:0.01:10;
axes(handles.axes1);
y1=sawtooth(2*pi*t);
plot(t,y);
case 5
t=-3:0.001:5;
axes(handles.axes1);
y1=tripuls(t,4,0.5);
plot(t,y);
end
% hObject handle to listbox1 (see GCBO)
% eventdata reserved - to be defined in a future version of MATLAB
% handles structure with handles and user data (see GUIDATA)
% Hints: contents = get(hObject,'String') returns listbox1 contents as cell array
% contents{get(hObject,'Value')} returns selected item from listbox1
% --- Executes during object creation, after setting all properties.
function listbox1_CreateFcn(hObject, eventdata, handles)
% hObject handle to listbox1 (see GCBO)
% eventdata reserved - to be defined in a future version of MATLAB
% handles empty - handles not created until after all CreateFcns called
% Hint: listbox controls usually have a white background on Windows.
% See ISPC and COMPUTER.
if ispc && isequal(get(hObject,'BackgroundColor'), get(0,'defaultUicontrolBackgroundColor'))
set(hObject,'BackgroundColor','white');
end
% --- Executes on button press in pushbutton1.
function pushbutton1_Callback(hObject, eventdata, handles)
t=-3:0.1:10;
hfstext=findobj('tag','edit1');
h=get(hfstext,'string');
w=str2num(h);
axes(handles.axes2);
y=sin(w*t);
plot(t,y);
% hObject handle to pushbutton1 (see GCBO)
% eventdata reserved - to be defined in a future version of MATLAB
% handles structure with handles and user data (see GUIDATA)
% --- Executes on button press in pushbutton2.
function pushbutton2_Callback(hObject, eventdata, handles)
val=get(handles.popupmenu1 ,'Value');
switch val
case 1
t=0:0.1:10;
hfstext=findobj('tag','edit1');
h=get(hfstext,'string');
w=str2num(h);
y=sin(w*t);
y1=sin(2*pi*t);
y2=y.*y1
axes(handles.axes3);
plot(t,y2);
case 2
t=0:0.01:10;
y1=cos(2*pi*t);
hfstext=findobj('tag','edit1');
h=get(hfstext,'string');
w=str2num(h);
y=sin(w*t);
y2=y.*y1
axes(handles.axes3);
plot(t,y);
case 3
t=0:0.01:10;
y1=square(2*pi*t);
hfstext=findobj('tag','edit1');
h=get(hfstext,'string');
w=str2num(h);
y=sin(w*t);
y2=y.*y1
axes(handles.axes3);
plot(t,y);
case 4
t=0:0.01:10;
y1=sawtooth(2*pi*t);
hfstext=findobj('tag','edit1');
h=get(hfstext,'string');
w=str2num(h);
y=sin(w*t);
y2=y.*y1
axes(handles.axes3);
plot(t,y);
case 5
t=-3:0.001:5;
hfstext=findobj('tag','edit1');
h=get(hfstext,'string');
w=str2num(h);
y=sin(w*t);
y1=tripuls(t,4,0.5);
y2=y.*y1
axes(handles.axes3);
plot(t,y);
xlabel('时间(t)');
title('正弦信号');
end
% hObject handle to pushbutton2 (see GCBO)
% eventdata reserved - to be defined in a future version of MATLAB
% handles structure with handles and user data (see GUIDATA)
% --- Executes on selection change in popupmenu1.
function popupmenu1_Callback(hObject, eventdata, handles)
val=get(handles.popupmenu1 ,'Value');
switch val
case 1
t=0:0.01:10;
y=sin(2*pi*t);
axes(handles.axes1);
plot(t,y);
xlabel('时间(t)');
title('正弦信号');
case 2
t=0:0.01:10;
y=cos(2*pi*t);
axes(handles.axes1);
plot(t,y);
xlabel('时间(t)');
title('余弦信号');
case 3
t=0:0.01:10;
y=square(2*pi*t);
axes(handles.axes1);
plot(t,y);
xlabel('时间(t)');
title('周期方波信号');
case 4
t=0:0.01:10;
axes(handles.axes1);
y=sawtooth(2*pi*t);
plot(t,y);
xlabel('时间(t)');
title('周期锯齿波信号');
case 5
t=-3:0.001:5;
axes(handles.axes1);
y=tripuls(t,4,0.5);
plot(t,y);
xlabel('时间(t)');
title('三角波信号');
end
% hObject handle to popupmenu1 (see GCBO)
% eventdata reserved - to be defined in a future version of MATLAB
% handles structure with handles and user data (see GUIDATA)
% Hints: contents = get(hObject,'String') returns popupmenu1 contents as cell array
% contents{get(hObject,'Value')} returns selected item from popupmenu1
% --- Executes during object creation, after setting all properties.
function popupmenu1_CreateFcn(hObject, eventdata, handles)
% hObject handle to popupmenu1 (see GCBO)
% eventdata reserved - to be defined in a future version of MATLAB
% handles empty - handles not created until after all CreateFcns called
% Hint: popupmenu controls usually have a white background on Windows.
% See ISPC and COMPUTER.
if ispc && isequal(get(hObject,'BackgroundColor'), get(0,'defaultUicontrolBackgroundColor'))
set(hObject,'BackgroundColor','white');
end
% --- Executes on slider movement.
function slider1_Callback(hObject, eventdata, handles)
fs=get(hObject,'value');
hfstext=findobj('tag','edit1');
set(hfstext,'string',num2str(fs));
% hObject handle to slider1 (see GCBO)
% eventdata reserved - to be defined in a future version of MATLAB
% handles structure with handles and user data (see GUIDATA)
% Hints: get(hObject,'Value') returns position of slider
% get(hObject,'Min') and get(hObject,'Max') to determine range of slider
% --- Executes during object creation, after setting all properties.
function slider1_CreateFcn(hObject, eventdata, handles)
% hObject handle to slider1 (see GCBO)
% eventdata reserved - to be defined in a future version of MATLAB
% handles empty - handles not created until after all CreateFcns called
% Hint: slider controls usually have a light gray background.
if isequal(get(hObject,'BackgroundColor'), get(0,'defaultUicontrolBackgroundColor'))
set(hObject,'BackgroundColor',[.9 .9 .9]);
end
function edit1_Callback(hObject, eventdata, handles)
fs=get(hObject,'value');
hfs=findobj('tag','slider1');
set(hfs,'string',num2str(fs));
% hObject handle to edit1 (see GCBO)
% eventdata reserved - to be defined in a future version of MATLAB
% handles structure with handles and user data (see GUIDATA)
% Hints: get(hObject,'String') returns contents of edit1 as text
% str2double(get(hObject,'String')) returns contents of edit1 as a double
% --- Executes during object creation, after setting all properties.
function edit1_CreateFcn(hObject, eventdata, handles)
% hObject handle to edit1 (see GCBO)
% eventdata reserved - to be defined in a future version of MATLAB
% handles empty - handles not created until after all CreateFcns called
% Hint: edit controls usually have a white background on Windows.
% See ISPC and COMPUTER.
if ispc && isequal(get(hObject,'BackgroundColor'), get(0,'defaultUicontrolBackgroundColor'))
set(hObject,'BackgroundColor','white');
end
% --- Executes on button press in pushbutton3.
function pushbutton3_Callback(hObject, eventdata, handles)
close;
main
% hObject handle to pushbutton3 (see GCBO)
% eventdata reserved - to be defined in a future version of MATLAB
% handles structure with handles and user data (see GUIDATA)
% --- Executes on button press in checkbox1.
function checkbox1_Callback(hObject, eventdata, handles)
r=get(hObject,'value');
if r==1
grid on
else
grid off
end
% hObject handle to checkbox1 (see GCBO)
% eventdata reserved - to be defined in a future version of MATLAB
% handles structure with handles and user data (see GUIDATA)
% Hint: get(hObject,'Value') returns toggle state of checkbox1
% --- Executes on button press in checkbox2.
function checkbox2_Callback(hObject, eventdata, handles)
r=get(hObject,'value');
if r==1
zoom on
else
zoom off
end
% hObject handle to checkbox2 (see GCBO)
% eventdata reserved - to be defined in a future version of MATLAB
% handles structure with handles and user data (see GUIDATA)
% Hint: get(hObject,'Value') returns toggle state of checkbox2
⛄ 运行结果

⛄ 参考文献
[1] 陈瑞峰, 左曙光, 郭伟. 基于MATLAB GUI的信号分析系统[J]. 佳木斯大学学报:自然科学版, 2009, 27(5):4.
[2] 赵秋英, 吴玲, 徐秀丽. 基于MATLAB GUI的信号分析仪设计[J]. 中国科技博览, 2015(004):000.
⛳️ 代码获取关注我
❤️部分理论引用网络文献,若有侵权联系博主删除
❤️ 关注我领取海量matlab电子书和数学建模资料


 803
803


 被折叠的 条评论
为什么被折叠?
被折叠的 条评论
为什么被折叠?
 到【灌水乐园】发言


